Estimated zip code population in 2022: 19,320 Zip code population in 2010: 18,042 Zip code population in 2000: 19,452
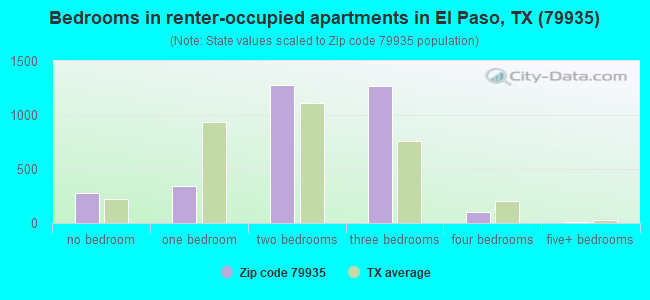
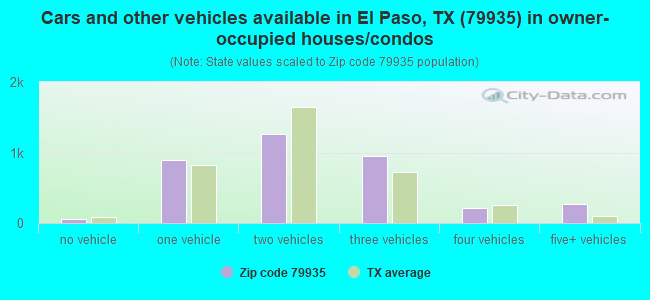
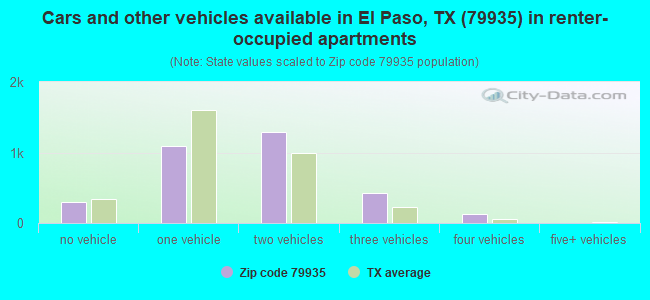
Houses and condos: 7,336 Renter-occupied apartments: 3,271
% of renters here:
47%
State:
38%
March 2022 cost of living index in zip code 79935: 82.3 (low, U.S. average is 100)
Land area: 3.5 sq. mi. Water area: 0.0 sq. mi.
Population density: 5,529 people per square mile
(average).
OSM Map
General Map
Google Map
MSN Map
OSM Map
General Map
Google Map
MSN Map
OSM Map
General Map
Google Map
MSN Map
OSM Map
General Map
Google Map
MSN Map
Please wait while loading the map...
Real estate property taxes paid for housing units in 2022:
This zip code:
1.9% ($3,764)
Texas:
1.5% ($4,050)
Median real estate property taxes paid for housing units with mortgages in 2022: $4,409 (2.0%) Median real estate property taxes paid for housing units with no mortgage in 2022: $3,532 (1.8%)
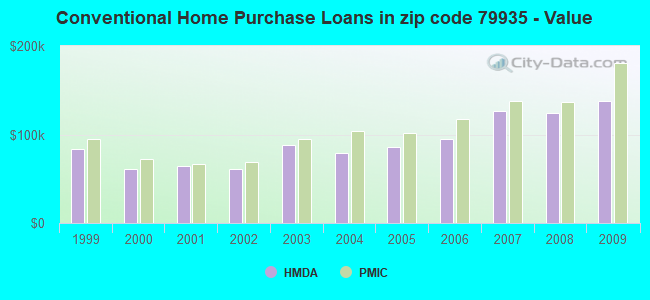
Estimated median house/condo value in 2022: $199,723
79935:
$199,723
Texas:
$275,400
According to our research of Texas and other state lists, there were 20 registered sex offenders living in 79935 zip code as of June 07, 2024. The ratio of all residents to sex offenders in zip code 79935 is 924 to 1. The ratio of registered sex offenders to all residents in this zip code is lower than the state average.
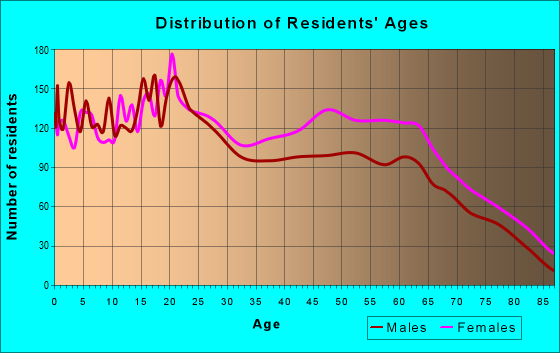
Median resident age:
This zip code:
37.7 years
Texas median age:
35.6 years
Average household size:
This zip code:
2.7 people
Texas:
2.6 people
Averages for the 2020 tax year for zip code 79935, filed in 2021:
Average Adjusted Gross Income (AGI) in 2020: $45,343 (Individual Income Tax Returns)
Here:
$45,343
State:
$77,054
Salary/wage: $39,645 (reported on 80.5% of returns)
Here:
$39,645
State:
$62,766
(% of AGI for various income ranges: 1096.4% for AGIs below $25k, 3176.6% for AGIs $25k-50k, 5787.5% for AGIs $50k-75k, 8372.4% for AGIs $75k-100k, 14867.0% for AGIs $100k-200k, 57040.0% for AGIs over 200k)
Taxable interest for individuals: $1,608 (reported on 21.6% of returns)
This zip code:
$1,608
Texas:
$2,665
(% of AGI for various income ranges: 8.9% for AGIs below $25k, 15.5% for AGIs $25k-50k, 46.5% for AGIs $50k-75k, 61.6% for AGIs $75k-100k, 170.2% for AGIs $100k-200k, 2272.5% for AGIs over 200k)
Ordinary dividends: $5,482 (reported on 7.5% of returns)
Here:
$5,482
State:
$10,044
(% of AGI for various income ranges: 5.9% for AGIs below $25k, 17.3% for AGIs $25k-50k, 36.0% for AGIs $50k-75k, 47.8% for AGIs $75k-100k, 192.7% for AGIs $100k-200k, 3817.5% for AGIs over 200k)
Net capital gain/loss in AGI: +$8,875 (reported on 7.0% of returns)
Here:
+$8,875
State:
+$39,590
(% of AGI for various income ranges: 1.6% for AGIs below $25k, 12.9% for AGIs $25k-50k, 79.6% for AGIs $50k-75k, 115.9% for AGIs $75k-100k, 448.9% for AGIs $100k-200k, 4315.0% for AGIs over 200k)
Profit/loss from business: +$8,593 (reported on 16.1% of returns)
Here:
+$8,593
State:
+$10,888
(% of AGI for various income ranges: 160.3% for AGIs below $25k, 104.2% for AGIs $25k-50k, 179.2% for AGIs $50k-75k, 206.8% for AGIs $75k-100k, 181.1% for AGIs $100k-200k, 3795.0% for AGIs over 200k)
Taxable individual retirement arrangement distribution: $12,654 (reported on 5.9% of returns)
79935:
$12,654
Texas:
$24,740
(% of AGI for various income ranges: 21.9% for AGIs below $25k, 54.1% for AGIs $25k-50k, 150.4% for AGIs $50k-75k, 235.9% for AGIs $75k-100k, 528.9% for AGIs $100k-200k)
Total itemized deductions: $28,415 (reported on 3.2% of returns)
Here:
$28,415
State:
$40,428
(% of AGI for various income ranges: 91.7% for AGIs $25k-50k, 205.3% for AGIs $50k-75k, 263.2% for AGIs $75k-100k, 438.6% for AGIs $100k-200k, 2725.0% for AGIs over 200k)
Charity contributions: $8,886 (reported on 2.6% of returns)
Here:
$8,886
State:
$18,201
(% of AGI for various income ranges: 12.5% for AGIs $25k-50k, 38.4% for AGIs $50k-75k, 59.7% for AGIs $75k-100k, 250.0% for AGIs $100k-200k)
Taxes paid: $7,136 (reported on 3.1% of returns)
79935:
$7,136
State:
$7,821
(% of AGI for various income ranges: 23.4% for AGIs $25k-50k, 50.2% for AGIs $50k-75k, 70.3% for AGIs $75k-100k, 106.6% for AGIs $100k-200k, 517.5% for AGIs over 200k)
Earned income credit: $2,709 (reported on 26.5% of returns)
Here:
$2,709
State:
$2,584
(% of AGI for various income ranges: 141.9% for AGIs below $25k, 86.6% for AGIs $25k-50k, 1.8% for AGIs $50k-75k)
Percentage of individuals using paid preparers for their 2020 taxes: 92.7%
Here:
93%
State:
92%
(% for various income ranges: 93.0% for AGIs below $25k, 93.3% for AGIs $25k-50k, 92.3% for AGIs $50k-75k, 92.3% for AGIs $75k-100k, 90.1% for AGIs $100k-200k, 91.7% for AGIs over 200k)
Averages for the 2012 tax year for zip code 79935, filed in 2013:
Average Adjusted Gross Income (AGI) in 2012: $40,646 (Individual Income Tax Returns)
Here:
$40,646
State:
$65,384
Salary/wage: $35,092 (reported on 82.8% of returns)
Here:
$35,092
State:
$52,524
(% of AGI for various income ranges: 80.0% for AGIs below $25k, 78.1% for AGIs $25k-50k, 72.8% for AGIs $50k-75k, 67.6% for AGIs $75k-100k, 71.7% for AGIs $100k-200k, 42.9% for AGIs over 200k)
Taxable interest for individuals: $1,430 (reported on 23.0% of returns)
This zip code:
$1,430
Texas:
$2,372
(% of AGI for various income ranges: 0.6% for AGIs below $25k, 0.6% for AGIs $25k-50k, 1.0% for AGIs $50k-75k, 0.9% for AGIs $75k-100k, 0.6% for AGIs $100k-200k, 1.5% for AGIs over 200k)
Ordinary dividends: $4,924 (reported on 9.3% of returns)
Here:
$4,924
State:
$9,721
(% of AGI for various income ranges: 0.9% for AGIs below $25k, 0.5% for AGIs $25k-50k, 0.6% for AGIs $50k-75k, 0.8% for AGIs $75k-100k, 1.1% for AGIs $100k-200k, 4.6% for AGIs over 200k)
Net capital gain/loss in AGI: +$4,214 (reported on 6.6% of returns)
Here:
+$4,214
State:
+$35,319
(% of AGI for various income ranges: 0.5% for AGIs $50k-75k, 0.8% for AGIs $75k-100k, 1.3% for AGIs $100k-200k, 2.5% for AGIs over 200k)
Profit/loss from business: +$11,370 (reported on 14.9% of returns)
Here:
+$11,370
State:
+$13,732
(% of AGI for various income ranges: 9.3% for AGIs below $25k, 2.7% for AGIs $25k-50k, 2.7% for AGIs $50k-75k, 3.0% for AGIs $75k-100k, 2.8% for AGIs $100k-200k, 7.3% for AGIs over 200k)
Taxable individual retirement arrangement distribution: $12,389 (reported on 7.1% of returns)
79935:
$12,389
Texas:
$19,511
(% of AGI for various income ranges: 1.0% for AGIs below $25k, 1.5% for AGIs $25k-50k, 2.1% for AGIs $50k-75k, 2.5% for AGIs $75k-100k, 4.2% for AGIs $100k-200k)
Total itemized deductions: $18,407 (22% of AGI, reported on 19.2% of returns)
Here:
$18,407
State:
$24,724
Here:
22.2% of AGI
State:
15.9% of AGI
(% of AGI for various income ranges: 5.6% for AGIs below $25k, 8.6% for AGIs $25k-50k, 10.1% for AGIs $50k-75k, 10.1% for AGIs $75k-100k, 10.0% for AGIs $100k-200k, 6.1% for AGIs over 200k)
Charity contributions: $3,365 (reported on 14.5% of returns)
Here:
$3,365
State:
$6,808
(% of AGI for various income ranges: 0.3% for AGIs below $25k, 0.8% for AGIs $25k-50k, 1.2% for AGIs $50k-75k, 1.5% for AGIs $75k-100k, 1.6% for AGIs $100k-200k, 2.1% for AGIs over 200k)
Taxes paid: $4,951 (reported on 19.0% of returns)
79935:
$4,951
State:
$6,921
(% of AGI for various income ranges: 0.9% for AGIs below $25k, 2.1% for AGIs $25k-50k, 2.7% for AGIs $50k-75k, 2.8% for AGIs $75k-100k, 3.1% for AGIs $100k-200k, 2.0% for AGIs over 200k)
Earned income credit: $2,605 (reported on 29.6% of returns)
Here:
$2,605
State:
$2,570
(% of AGI for various income ranges: 10.1% for AGIs below $25k, 1.6% for AGIs $25k-50k)
Percentage of individuals using paid preparers for their 2012 taxes: 53.8%
Here:
54%
State:
51%
(% for various income ranges: 52.9% for AGIs below $25k, 52.1% for AGIs $25k-50k, 53.2% for AGIs $50k-75k, 54.7% for AGIs $75k-100k, 62.3% for AGIs $100k-200k, 85.7% for AGIs over 200k)
Averages for the 2004 tax year for zip code 79935, filed in 2005:
Average Adjusted Gross Income (AGI) in 2004: $35,532 (Individual Income Tax Returns)
Here:
$35,532
State:
$47,881
Salary/wage: $31,082 (reported on 84.9% of returns)
Here:
$31,082
State:
$41,947
(% of AGI for various income ranges: 89.0% for AGIs below $10k, 82.8% for AGIs $10k-25k, 82.4% for AGIs $25k-50k, 75.8% for AGIs $50k-75k, 75.5% for AGIs $75k-100k, 57.7% for AGIs over 100k)
Taxable interest for individuals: $1,883 (reported on 31.5% of returns)
This zip code:
$1,883
Texas:
$2,255
(% of AGI for various income ranges: 2.2% for AGIs below $10k, 0.8% for AGIs $10k-25k, 0.9% for AGIs $25k-50k, 1.2% for AGIs $50k-75k, 1.2% for AGIs $75k-100k, 3.5% for AGIs over 100k)
Taxable dividends: $2,661 (reported on 11.9% of returns)
Here:
$2,661
State:
$4,261
(% of AGI for various income ranges: 1.4% for AGIs below $10k, 0.6% for AGIs $10k-25k, 0.5% for AGIs $25k-50k, 0.8% for AGIs $50k-75k, 0.6% for AGIs $75k-100k, 1.7% for AGIs over 100k)
Net capital gain/loss: +$4,421 (reported on 9.4% of returns)
Here:
+$4,421
State:
+$16,110
(% of AGI for various income ranges: -0.2% for AGIs below $10k, 0.2% for AGIs $10k-25k, 0.5% for AGIs $25k-50k, 0.8% for AGIs $50k-75k, 1.2% for AGIs $75k-100k, 2.9% for AGIs over 100k)
Profit/loss from business: +$7,549 (reported on 16.2% of returns)
Here:
+$7,549
State:
+$11,013
(% of AGI for various income ranges: 7.8% for AGIs below $10k, 5.9% for AGIs $10k-25k, 1.7% for AGIs $25k-50k, 2.0% for AGIs $50k-75k, 2.2% for AGIs $75k-100k, 4.8% for AGIs over 100k)
IRA payment deduction: $2,731 (reported on 2.2% of returns)
79935:
$2,731
Texas:
$3,120
(% of AGI for various income ranges: 0.1% for AGIs $10k-25k, 0.2% for AGIs $25k-50k, 0.2% for AGIs $50k-75k, 0.2% for AGIs $75k-100k, 0.2% for AGIs over 100k)
Self-employed pension: $14,600 (reported on 0.2% of returns)
Here:
$14,600
Texas:
$16,401
Total itemized deductions: $15,158 (20% of AGI, reported on 20.1% of returns)
Here:
$15,158
State:
$19,631
Here:
20.4% of AGI
State:
18.9% of AGI
(% of AGI for various income ranges: 4.2% for AGIs below $10k, 4.2% for AGIs $10k-25k, 9.6% for AGIs $25k-50k, 11.2% for AGIs $50k-75k, 11.1% for AGIs $75k-100k, 7.3% for AGIs over 100k)
Charity contributions deductions: $2,694 (3% of AGI, reported on 17.2% of returns)
Here:
$2,694
State:
$4,753
Here:
3.4% of AGI
State:
4.2% of AGI
(% of AGI for various income ranges: 0.2% for AGIs below $10k, 0.4% for AGIs $10k-25k, 1.0% for AGIs $25k-50k, 1.7% for AGIs $50k-75k, 1.8% for AGIs $75k-100k, 1.6% for AGIs over 100k)
Total tax: $5,377 (reported on 65.5% of returns)
79935:
$5,377
State:
$9,058
(% of AGI for various income ranges: 2.8% for AGIs below $10k, 3.3% for AGIs $10k-25k, 6.0% for AGIs $25k-50k, 8.8% for AGIs $50k-75k, 10.6% for AGIs $75k-100k, 19.0% for AGIs over 100k)
Earned income credit: $2,156 (reported on 30.2% of returns)
Here:
$2,156
State:
$2,024
Percentage of individuals using paid preparers for their 2004 taxes: 61.2%
Here:
61%
State:
57%
(% for various income ranges: 55.5% for AGIs below $10k, 65.8% for AGIs $10k-25k, 61.2% for AGIs $25k-50k, 58.3% for AGIs $50k-75k, 58.1% for AGIs $75k-100k, 67.8% for AGIs over 100k)
Household received Food Stamps/SNAP in the past 12 months: 1,118 Household did not receive Food Stamps/SNAP in the past 12 months: 5,804
Women who had a birth in the past 12 months: 119 (68 now married, 50 unmarried) Women who did not have a birth in the past 12 months: 4,397 (1,442 now married, 2,970 unmarried)
Housing units in zip code 79935 with a mortgage: 1,714 (79 second mortgage, 85 both second mortgage and home equity loan) Houses without a mortgage: 44
Median monthly owner costs for units with a mortgage: $1,571 Median monthly owner costs for units without a mortgage: $633
Residents with income below the poverty level in 2022:
This zip code:
21.2%
Whole state:
14.0%
Residents with income below 50% of the poverty level in 2022:
This zip code:
13.5%
Whole state:
7.4%
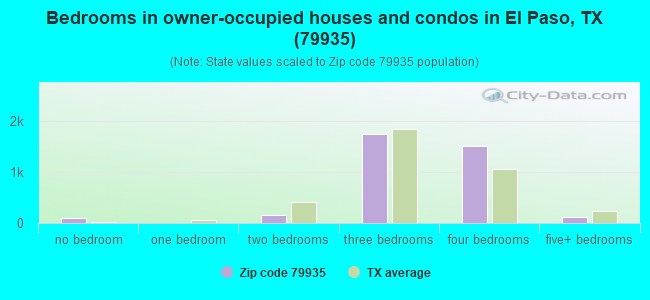
Median number of rooms in houses and condos:
Here:
6.8
State:
6.3
Median number of rooms in apartments:
Here:
4.4
State:
4.0
Notable locations in this zip code not listed on our city pages
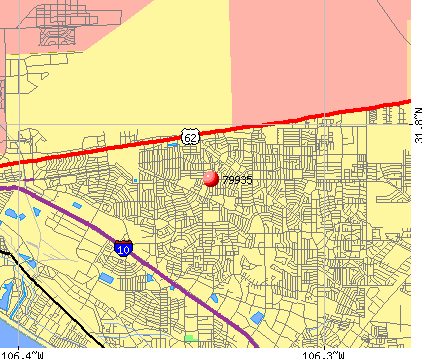
Notable locations in zip code 79935: El Paso Fire Department Station 25 (A), El Paso Fire Department Station 24 (B). Display/hide their locations on the map
Parks in zip code 79935 include: Pebble Hills Park (1), Pico Norte Park (2), Vista del Sol Park (3), Eastwood Junior High School Track and Field (4), Eastwood Junior High School Baseball Field (5). Display/hide their locations on the map
In group quarters: 292 (-1 institutionalized population)
Size of family households: 1,902 2-persons, 1,180 3-persons, 950 4-persons, 426 5-persons, 334 6-persons, 86 7-or-more-persons
Size of nonfamily households: 1,520 1-person, 476 2-persons, 27 3-persons
2,098 married couples with children.
1,449 single-parent households (226 men, 1,223 women).
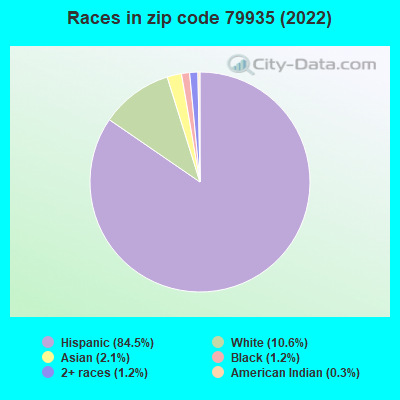
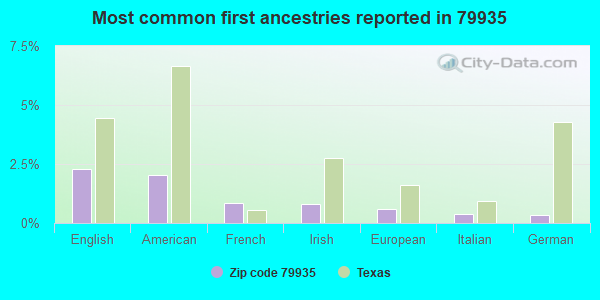
32.8% of residents of 79935 zip code speak English at home.
64.4% of residents speak Spanish at home (72% very well, 16% well, 8% not well, 4% not at all).
0.5% of residents speak other Indo-European language at home (86% very well, 14% well).
2.2% of residents speak Asian or Pacific Island language at home (57% very well, 22% well, 22% not well).
0.1% of residents speak other language at home (100% very well).
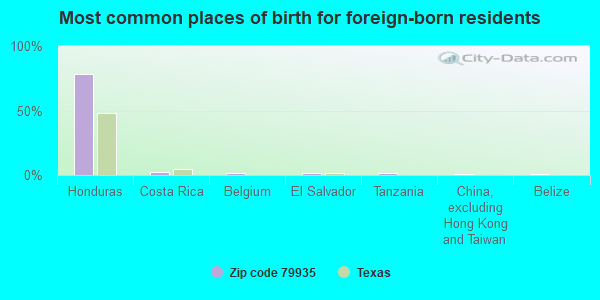
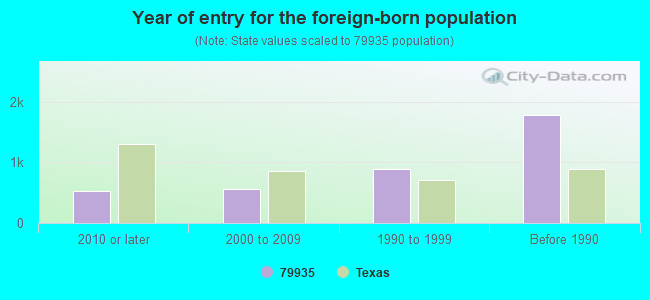
Foreign born population: 3,689 (19.1%) (55.3% of them are naturalized citizens)
Facilities with environmental interests located in this zip code:
ABF FREIGHT SYSTEM INC (1321 GAIL BORDEN PLACE in EL PASO, TX)
(Resource Conservation and Recovery Act (tracking hazardous waste))
ACUSTAR (11210 ARMOUR DR STE A1 in EL PASO, TX)
(Resource Conservation and Recovery Act (tracking hazardous waste)) Alternative names: ACUSTAR-A CHRY MTR
AUTO CENTER PLUS (10780 PEBBLE HILLS BLVD in EL PASO, TX)
(Resource Conservation and Recovery Act (tracking hazardous waste))
AUTOMATIC LAUNDRY CO (1410 GAIL BORDEN UNIT A2 in EL PASO, TX)
Conditionally Exempt Small Quantity Generators, less than 100 kg/month of hazardous waste (Resource Conservation and Recovery Act (tracking hazardous waste)) - notification Organizations: VISTA DEV JOINT VENTURE III (CONTACT/OWNER)
Housing units lacking complete plumbing facilities: 0.1% Housing units lacking complete kitchen facilities: 1.8%
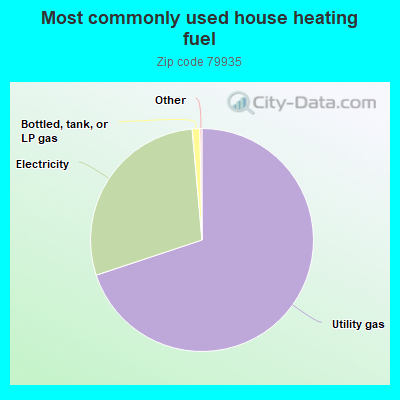
69.9%Utility gas
28.7%Electricity
1.1%Bottled, tank, or LP gas
Population in 1990: 20,465.
Place of birth for U.S.-born residents:
This state: 12,698
Northeast: 381
Midwest: 332
South: 574
West: 1,331
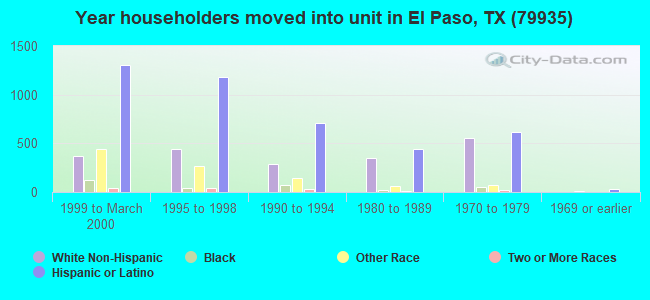
55% of the 79935 zip code residents lived in the same house 5 years ago. Out of people who lived in different houses, 83% lived in this county. Out of people who lived in different counties, 50% lived in Texas.
87% of the 79935 zip code residents lived in the same house 1 year ago. Out of people who lived in different houses, 69% moved from this county. Out of people who lived in different houses, 6% moved from different county within same state. Out of people who lived in different houses, 22% moved from different state. Out of people who lived in different houses, 1% moved from abroad.
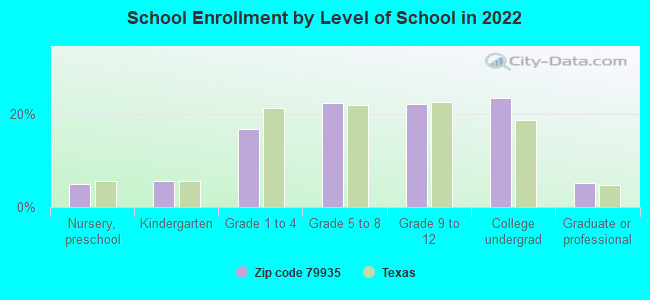
Private vs. public school enrollment:
Students in private schools in grades 1 to 8 (elementary and middle school): 32
Here:
1.7%
Texas:
8.8%
Students in private schools in grades 9 to 12 (high school): 61
Here:
5.9%
Texas:
8.0%
Students in private undergraduate colleges: 28
Here:
2.5%
Texas:
16.2%
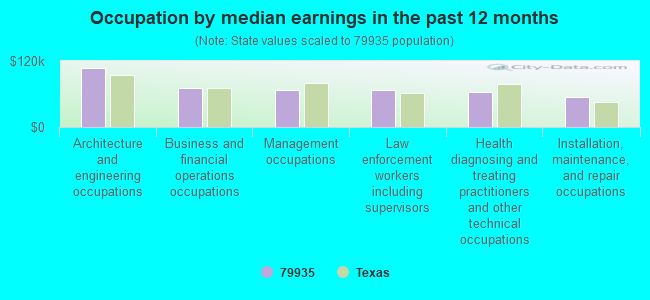
Occupation by median earnings in the past 12 months ($)
107,179Architecture and engineering occupations
71,213Business and financial operations occupations
67,412Management occupations
66,835Law enforcement workers including supervisors
63,161Health diagnosing and treating practitioners and other technical occupations
54,929Installation, maintenance, and repair occupations
Companies with biggest federal contracts located in this zip code (EL PASO, TX):
HOLIDAY MOVING & STORAGE CO (1111 VISTA DE ORO DR; small business) : $4,572,914 in 25 contractsfrom 2000 to 2006
Contracts for Relocation Services by Army Signed by year:2000: $135,000; 2001: $2,769,813; 2002: -$114,584; 2003: $576,174; 2004: $588,732; 2005: $396,446; 2006: $221,333.
Biggest contracts:
$831,906 with Army for Relocation Services. Signed on 2001-12-06. Completion date: 2005-12-31.
$580,289, same as above.Signed on 2001-12-10. Completion date: 2002-12-31.
$536,732, same as above.Signed on 2004-01-21. Completion date: 2004-12-31.
$505,000, same as above.Signed on 2001-01-31. Completion date: 2001-12-31.
PEPSI COLA METROPOLITAN BOTTLI (10841 PELLICANO DRIVE; small business) : $2,265,648 in 30 contractsfrom 1999 to 2005
Contracts for Food Items For Resale, Non-Food Items For Resale by Defense Commissary Agency, Department of Defense Signed by year:2000: $474,351; 2001: $132,782; 2002: $422,564; 2003: $156,675; 2004: $333,539; 2005: $642,867; 2006: $0.
Biggest contracts:
$279,616 with Defense Commissary Agency for Food Items For Resale. Signed on 2005-04-01. Completion date: 2005-08-31.
$230,144 with Department of Defense for Food Items For Resale. Signed on 2002-01-02. Completion date: 2002-06-30.
$178,136 with Defense Commissary Agency for Non-Food Items For Resale. Signed on 2005-10-01. Completion date: 2005-12-31.
$163,237 with Defense Commissary Agency for Food Items For Resale. Signed on 2004-10-01. Completion date: 2005-02-28.
EL PASO AUTO OFF & IND SYSTEMS (11045 ARGAL CT; small business) : $1,718,945 in 40 contractsfrom 2000 to 2006
Contracts for Office Furniture, Draperies, Awnings, and Shades, Carpet Laying and Cleaning, Cabinets, Lockers, Bins, and Shelving, and moreby Army, Department of State, Air Force, Navy, and others Signed by year:2000: $27,345; 2001: $161,562; 2002: $351,325; 2003: $299,131; 2004: $621,006; 2005: $241,182; 2006: $17,394.
Biggest contracts:
$711,000 with Army for Office Furniture. Signed on 2004-02-20. Completion date: 2004-11-15.
$248,000 with Department of State for Office Furniture. Signed on 2002-01-15. Completion date: 2002-05-15.
$196,500 with Army for Draperies, Awnings, and Shades. Signed on 2005-08-09. Completion date: 2005-11-03.
$87,000 with Army for Office Furniture. Taking place in NM. Signed on 2003-09-30. Completion date: 2003-12-31.
COMNET SYSTEMS INC (1477 LOMALAND DR , SUITE A; small business) : $337,709 in 34 contractsfrom 2002 to 2006
Contracts for ADP Central Processing Unit (CPU, Computer), Digital, ADP Input/Output and Storage Devices, Photographic Projection Equipment, ADPE System Configuration, and moreby Army, Air Force, Navy, U.S. Army Corps of Engineers - civil program financing only, and others Signed by year:2000: $0; 2001: $0; 2002: $91,088; 2003: $16,292; 2004: $45,243; 2005: $153,011; 2006: $32,075.
Biggest contracts:
$38,040 with Army for ADP Central Processing Unit (CPU, Computer), Digital. Signed on 2005-04-05. Completion date: 2005-05-07.
$31,650, same as above.Signed on 2005-04-05. Completion date: 2005-05-07.
$27,300 with Air Force for ADP Input/Output and Storage Devices. Signed on 2005-02-24. Completion date: 2005-03-02.
$23,600 with Army for Photographic Projection Equipment. Signed on 2006-07-10. Effective on 2006-07-07. Completion date: 2006-07-14.
EL PASO COMMUNITY COLLEGE (1359 LOMALAND, SUITE 519) : $255,313 in 16 contractsfrom 2001 to 2006
Contracts for Education Services, Other Education and Training Services, Other Housekeeping Services by Army Signed by year:2000: $0; 2001: $4,635; 2002: $132,879; 2003: $120,369; 2004: -$7,237; 2005: $68,922; 2006: -$64,255.
Biggest contracts:
$71,854 with Army for Education Services. Signed on 2003-11-12. Completion date: 2003-11-01.
$68,922, same as above.Signed on 2005-01-13. Completion date: 2005-01-18.
$65,424 with Army for Other Education and Training Services. Signed on 2002-10-29. Completion date: 2002-10-03.
$44,640 with Army for Other Housekeeping Services. Signed on 2003-10-02. Completion date: 2004-09-30.
SEVERIN MICHAEL GROEMLING (2033 TRAWOOD DRIVE; small business) : $121,333 in 7 contractsfrom 2004 to 2006
Contracts for Non-Food Items For Resale, Food Items For Resale by Defense Commissary Agency Signed by year:2000: $0; 2001: $0; 2002: $0; 2003: $0; 2004: $25,128; 2005: $64,897; 2006: $31,308.
Biggest contracts:
$31,308 with Defense Commissary Agency for Non-Food Items For Resale. Signed on 2006-01-01. Completion date: 2006-03-31.
$27,643 with Defense Commissary Agency for Food Items For Resale. Signed on 2005-04-01. Completion date: 2005-08-31.
$25,128, same as above.Signed on 2004-10-01. Completion date: 2005-02-28.
$16,702 with Defense Commissary Agency for Non-Food Items For Resale. Signed on 2005-10-01. Completion date: 2005-12-31.
LONGINO GONZALEZ III (10940 PELLICANO) : $120,947 in 5 contractsfrom 2001 to 2003
Contracts for Lease or Rental of Equipment -- Special Industry Machinery, Lease or Rental of Equipment -- Mechanical Power Transmission Equipment by Army Signed by year:2000: $0; 2001: $28,448; 2002: $36,999; 2003: $55,500; 2004: $0; 2005: $0; 2006: $0.
Biggest contracts:
$50,000 with Army for Lease or Rental of Equipment -- Special Industry Machinery. Signed on 2003-09-15. Completion date: 2004-09-19.
$36,999 with Army for Lease or Rental of Equipment -- Mechanical Power Transmission Equipment. Signed on 2002-09-07. Completion date: 2003-09-20.
$28,448, same as above.Signed on 2001-09-24. Completion date: 2001-09-30.
$5,500, same as above.Signed on 2003-09-26. Completion date: 2004-09-28.
KSI, A DIVISION OF DSPCON, INC (11209 ARMOUR DR; small business) : $107,595 in 3 contractsfrom 2002 to 2003
$98,235 with Navy for Electrical and Electronic assemblies, Boards, Cards, and Associated Hardware. Signed on 2003-09-25. Completion date: 2003-12-31.
$5,000, same as above.Signed on 2003-08-15. Completion date: 2003-08-22.
$4,360, same as above.Signed on 2002-11-15. Completion date: 2002-12-15.
GREENSCENE INC (10950 #B PELLICANO; small business) : $83,332 in 10 contractsfrom 2004 to 2006
Contracts for Non-Food Items For Resale by Defense Commissary Agency Signed by year:2000: $0; 2001: $0; 2002: $0; 2003: $0; 2004: $18,850; 2005: $47,947; 2006: $16,535.
Biggest contracts:
$18,850 with Defense Commissary Agency for Non-Food Items For Resale. Signed on 2004-10-01. Completion date: 2005-09-30.
$14,080, same as above.Signed on 2005-04-01. Completion date: 2005-05-31.
$9,792, same as above.Signed on 2006-03-01. Completion date: 2006-03-31.
$9,305, same as above.Signed on 2005-01-01. Completion date: 2005-09-30.
N S I , INC (2267 TRAWOOD DR , SUITE D-; small business)
$59,801 with Army for ADPE System Configuration. Signed on 2001-08-22. Completion date: 2001-09-28.
Top industries in this zip code by the number of employees in 2005:
Health Care and Social Assistance: Home Health Care Services (500-999 employees: 1 establishment)
2002 - 2018 National Fire Incident Reporting System (NFIRS) incidents
According to the data from the years 2002 - 2018 the average number of fires per year is 46. The highest number of reported fires - 74 took place in 2005, and the least - 25 in 2018. The data has a decreasing trend.
When looking into fire subcategories, the most incidents belonged to: Outside Fires (37.3%), and Structure Fires (26.4%).
Fire incident types reported to NFIRS in Zip Code 79935
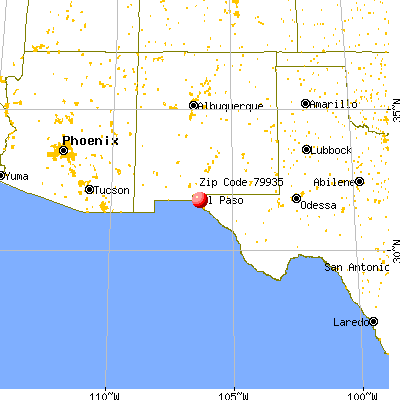


 Nearest zip codes: 79936, 79925, 79915, 79907, 79906, 79905.
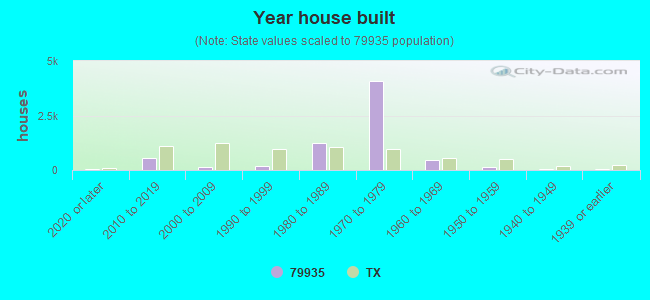


 According to the data from the years 2002 - 2018 the average number of fires per year is 46. The highest number of reported fires - 74 took place in 2005, and the least - 25 in 2018. The data has a decreasing trend.
 When looking into fire subcategories, the most incidents belonged to: Outside Fires (37.3%), and Structure Fires (26.4%).