Estimated zip code population in 2022: 1,844 Zip code population in 2010: 1,171 Zip code population in 2000: 1,131
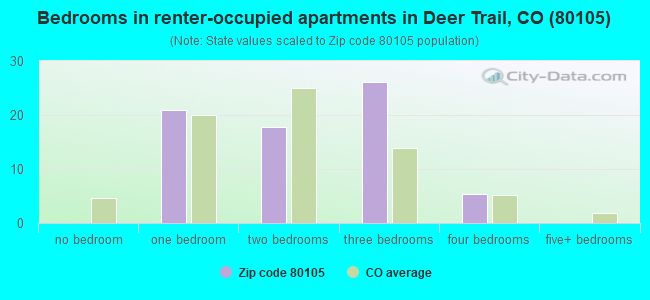
Houses and condos: 792 Renter-occupied apartments: 70
% of renters here:
9%
State:
34%
March 2022 cost of living index in zip code 80105: 92.8 (less than average, U.S. average is 100)
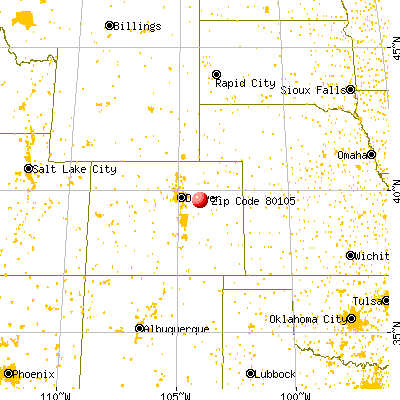
Land area: 498.7 sq. mi. Water area: 2.0 sq. mi.
Population density: 4 people per square mile
(very low).
OSM Map
General Map
Google Map
MSN Map
OSM Map
General Map
Google Map
MSN Map
OSM Map
General Map
Google Map
MSN Map
OSM Map
General Map
Google Map
MSN Map
Please wait while loading the map...
Real estate property taxes paid for housing units in 2022:
This zip code:
0.4% ($1,485)
Colorado:
0.5% ($2,422)
Median real estate property taxes paid for housing units with mortgages in 2022: $1,677 (0.4%) Median real estate property taxes paid for housing units with no mortgage in 2022: $1,414 (0.4%)
Business Search- 14 Million verified businesses
Males: 919
(49.8%)
Females: 925
(50.2%)
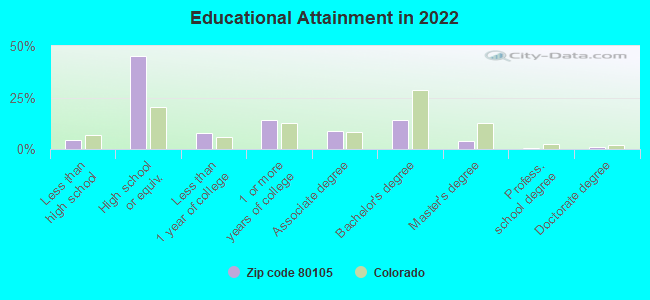
For population 25 years and over in 80105:
High school or higher: 94.3%
Bachelor's degree or higher: 19.5%
Graduate or professional degree: 5.4%
Unemployed: 0.9%
Mean travel time to work (commute): 44.2 minutes
For population 15 years and over in 80105:
Never married: 19.0%
Now married: 72.0%
Separated: 0.4%
Widowed: 3.0%
Divorced: 5.6%
Zip code 80105 compared to state average:
Unemployed percentage significantly below state average.
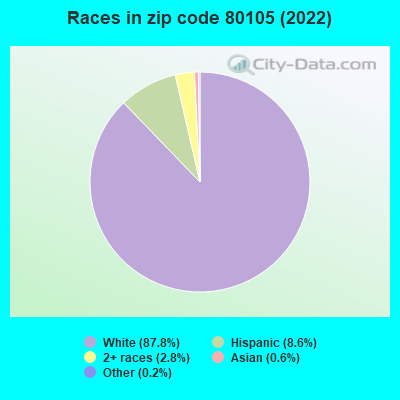
Black race population percentage significantly below state average.
Hispanic race population percentage below state average.
Median age significantly above state average.
Foreign-born population percentage significantly below state average.
Renting percentage significantly below state average.
Length of stay since moving in significantly below state average.
House age below state average.
Number of college students below state average.
Percentage of population with a bachelor's degree or higher significantly below state average.
Averages for the 2020 tax year for zip code 80105, filed in 2021:
Average Adjusted Gross Income (AGI) in 2020: $57,641 (Individual Income Tax Returns)
Here:
$57,641
State:
$89,260
Salary/wage: $54,889 (reported on 83.5% of returns)
Here:
$54,889
State:
$70,330
(% of AGI for various income ranges: 1152.0% for AGIs below $25k, 3607.2% for AGIs $25k-50k, 6697.9% for AGIs $50k-75k, 9761.1% for AGIs $75k-100k, 20980.0% for AGIs $100k-200k)
Taxable interest for individuals: $535 (reported on 20.0% of returns)
This zip code:
$535
Colorado:
$2,176
(% of AGI for various income ranges: 10.0% for AGIs below $25k, 18.3% for AGIs $25k-50k, 5.7% for AGIs $50k-75k, 6.7% for AGIs $75k-100k, 48.3% for AGIs $100k-200k)
Ordinary dividends: $1,212 (reported on 9.4% of returns)
Here:
$1,212
State:
$8,820
(% of AGI for various income ranges: 10.0% for AGIs below $25k, 17.1% for AGIs $50k-75k, 96.7% for AGIs $100k-200k)
Net capital gain/loss in AGI: +$5,662 (reported on 9.4% of returns)
Here:
+$5,662
State:
+$37,276
(% of AGI for various income ranges: 125.0% for AGIs $25k-50k, 253.3% for AGIs $75k-100k)
Profit/loss from business: +$6,400 (reported on 18.8% of returns)
Here:
+$6,400
State:
+$15,295
(% of AGI for various income ranges: 172.0% for AGIs below $25k, 145.0% for AGIs $25k-50k, 134.3% for AGIs $50k-75k, 352.2% for AGIs $75k-100k)
Taxable individual retirement arrangement distribution: $18,540 (reported on 5.9% of returns)
80105:
$18,540
Colorado:
$23,785
(% of AGI for various income ranges: 199.3% for AGIs below $25k, 697.8% for AGIs $75k-100k)
Total itemized deductions: $24,017 (reported on 7.1% of returns)
Here:
$24,017
State:
$35,141
(% of AGI for various income ranges: 328.9% for AGIs $25k-50k, 943.3% for AGIs $75k-100k)
Charity contributions: $2,533 (reported on 3.5% of returns)
Here:
$2,533
State:
$12,103
(% of AGI for various income ranges: 84.4% for AGIs $75k-100k)
Taxes paid: $5,250 (reported on 7.1% of returns)
80105:
$5,250
State:
$7,710
(% of AGI for various income ranges: 59.4% for AGIs $25k-50k, 231.1% for AGIs $75k-100k)
Earned income credit: $2,285 (reported on 15.3% of returns)
Here:
$2,285
State:
$2,053
(% of AGI for various income ranges: 102.7% for AGIs below $25k, 79.4% for AGIs $25k-50k)
Percentage of individuals using paid preparers for their 2020 taxes: 90.6%
Here:
91%
State:
93%
(% for various income ranges: 85.7% for AGIs below $25k, 95.5% for AGIs $25k-50k, 88.9% for AGIs $50k-75k, 91.7% for AGIs $75k-100k, 91.7% for AGIs $100k-200k)
Averages for the 2012 tax year for zip code 80105, filed in 2013:
Average Adjusted Gross Income (AGI) in 2012: $50,796 (Individual Income Tax Returns)
Here:
$50,796
State:
$69,103
Salary/wage: $44,174 (reported on 77.6% of returns)
Here:
$44,174
State:
$54,794
(% of AGI for various income ranges: 65.5% for AGIs below $25k, 77.3% for AGIs $25k-50k, 84.9% for AGIs $50k-75k, 81.3% for AGIs $75k-100k, 47.8% for AGIs $100k-200k)
Taxable interest for individuals: $350 (reported on 28.6% of returns)
This zip code:
$350
Colorado:
$1,971
(% of AGI for various income ranges: 0.7% for AGIs below $25k, 0.3% for AGIs $25k-50k, 0.2% for AGIs $50k-75k, 0.1% for AGIs $100k-200k)
Ordinary dividends: $640 (reported on 10.2% of returns)
Here:
$640
State:
$7,140
Net capital gain/loss in AGI: +$11,343 (reported on 14.3% of returns)
Here:
+$11,343
State:
+$23,009
Profit/loss from business: +$4,089 (reported on 18.4% of returns)
Here:
+$4,089
State:
+$13,514
(% of AGI for various income ranges: 8.5% for AGIs below $25k, 2.4% for AGIs $25k-50k, 2.0% for AGIs $50k-75k)
Taxable individual retirement arrangement distribution: $6,533 (reported on 6.1% of returns)
80105:
$6,533
Colorado:
$17,927
Total itemized deductions: $17,120 (22% of AGI, reported on 30.6% of returns)
Here:
$17,120
State:
$24,621
Here:
22.3% of AGI
State:
18.5% of AGI
(% of AGI for various income ranges: 16.0% for AGIs $25k-50k, 11.4% for AGIs $50k-75k, 13.2% for AGIs $75k-100k, 7.7% for AGIs $100k-200k)
Charity contributions: $1,990 (reported on 20.4% of returns)
Here:
$1,990
State:
$4,449
(% of AGI for various income ranges: 0.7% for AGIs $25k-50k, 1.0% for AGIs $50k-75k, 1.7% for AGIs $75k-100k, 0.6% for AGIs $100k-200k)
Taxes paid: $4,080 (reported on 30.6% of returns)
80105:
$4,080
State:
$7,641
(% of AGI for various income ranges: 2.1% for AGIs $25k-50k, 2.1% for AGIs $50k-75k, 3.5% for AGIs $75k-100k, 2.9% for AGIs $100k-200k)
Earned income credit: $2,300 (reported on 16.3% of returns)
Here:
$2,300
State:
$2,095
(% of AGI for various income ranges: 6.9% for AGIs below $25k, 1.5% for AGIs $25k-50k)
Percentage of individuals using paid preparers for their 2012 taxes: 51.0%
Here:
51%
State:
49%
(% for various income ranges: 41.2% for AGIs below $25k, 53.8% for AGIs $25k-50k, 55.6% for AGIs $50k-75k, 50.0% for AGIs $75k-100k, 66.7% for AGIs $100k-200k)
Averages for the 2004 tax year for zip code 80105, filed in 2005:
Average Adjusted Gross Income (AGI) in 2004: $36,472 (Individual Income Tax Returns)
Here:
$36,472
State:
$55,014
Salary/wage: $39,552 (reported on 78.0% of returns)
Here:
$39,552
State:
$46,010
(% of AGI for various income ranges: 62.0% for AGIs $10k-25k, 77.6% for AGIs $25k-50k, 94.8% for AGIs $50k-75k, 81.0% for AGIs $75k-100k, 66.3% for AGIs over 100k)
Taxable interest for individuals: $1,088 (reported on 46.1% of returns)
This zip code:
$1,088
Colorado:
$2,127
(% of AGI for various income ranges: 2.1% for AGIs $10k-25k, 2.4% for AGIs $25k-50k, 0.3% for AGIs $50k-75k, 0.3% for AGIs $75k-100k, 1.1% for AGIs over 100k)
Taxable dividends: $708 (reported on 14.6% of returns)
Here:
$708
State:
$3,782
(% of AGI for various income ranges: 0.2% for AGIs $25k-50k, 0.1% for AGIs $50k-75k, 0.7% for AGIs $75k-100k)
Net capital gain/loss: +$446 (reported on 13.2% of returns)
Here:
+$446
State:
+$17,882
(% of AGI for various income ranges: -0.1% for AGIs $25k-50k, -0.2% for AGIs $50k-75k, 0.2% for AGIs $75k-100k)
Profit/loss from business: +$3,479 (reported on 19.1% of returns)
Here:
+$3,479
State:
+$11,247
(% of AGI for various income ranges: 12.4% for AGIs $10k-25k, 2.1% for AGIs $25k-50k, 1.5% for AGIs $50k-75k)
IRA payment deduction: $1,462 (reported on 2.6% of returns)
80105:
$1,462
Colorado:
$2,947
Total itemized deductions: $16,813 (28% of AGI, reported on 38.0% of returns)
Here:
$16,813
State:
$20,560
Here:
28.0% of AGI
State:
21.4% of AGI
(% of AGI for various income ranges: 21.0% for AGIs $10k-25k, 14.4% for AGIs $25k-50k, 18.5% for AGIs $50k-75k, 16.8% for AGIs $75k-100k, 17.6% for AGIs over 100k)
Charity contributions deductions: $1,795 (3% of AGI, reported on 26.8% of returns)
Here:
$1,795
State:
$3,518
Here:
2.8% of AGI
State:
3.4% of AGI
(% of AGI for various income ranges: 0.8% for AGIs $10k-25k, 0.8% for AGIs $25k-50k, 1.5% for AGIs $50k-75k, 1.4% for AGIs $75k-100k, 1.9% for AGIs over 100k)
Total tax: $4,140 (reported on 74.2% of returns)
80105:
$4,140
State:
$9,173
(% of AGI for various income ranges: 4.8% for AGIs $10k-25k, 6.4% for AGIs $25k-50k, 7.3% for AGIs $50k-75k, 9.5% for AGIs $75k-100k, 13.1% for AGIs over 100k)
Earned income credit: $1,859 (reported on 14.4% of returns)
Here:
$1,859
State:
$1,595
Percentage of individuals using paid preparers for their 2004 taxes: 58.3%
Here:
58%
State:
55%
(% for various income ranges: 55.4% for AGIs below $10k, 64.4% for AGIs $10k-25k, 54.0% for AGIs $25k-50k, 62.6% for AGIs $50k-75k, 53.8% for AGIs $75k-100k, 66.7% for AGIs over 100k)
Likely homosexual households (counted as self-reported same-sex unmarried-partner households)
Lesbian couples: 0.3% of all households
Gay men: 0.0% of all households
Household received Food Stamps/SNAP in the past 12 months: 54 Household did not receive Food Stamps/SNAP in the past 12 months: 693
Women who had a birth in the past 12 months: 43 (44 now married, 0 unmarried) Women who did not have a birth in the past 12 months: 281 (165 now married, 115 unmarried)
Housing units in zip code 80105 with a mortgage: 345 (7 second mortgage, 1 both second mortgage and home equity loan) Median monthly owner costs for units with a mortgage: $1,782 Median monthly owner costs for units without a mortgage: $408
Residents with income below the poverty level in 2022:
This zip code:
10.5%
Whole state:
9.4%
Residents with income below 50% of the poverty level in 2022:
This zip code:
4.9%
Whole state:
4.6%
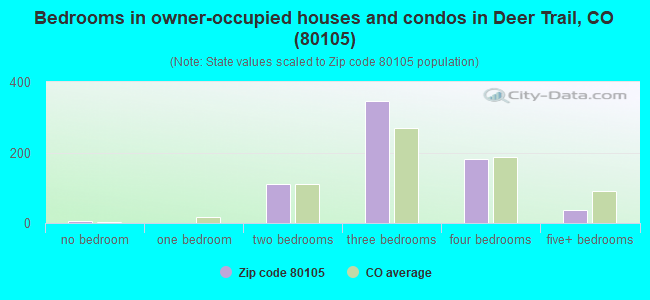
Median number of rooms in houses and condos:
Here:
5.9
State:
6.8
Median number of rooms in apartments:
Here:
5.0
State:
4.0
Notable locations in this zip code not listed on our city pages
Notable locations in zip code 80105: Arrow K Ranch (A), Cross J Ranch (B), North Central Fire Protection District (C), Deer Trail Fire Department (D), Deer Trail Ambulance Service (E). Display/hide their locations on the map
Creeks: Key Creek (A), Middle Bijou Creek (B), Poision Springs Creek (C), Rattlesnake Creek (D), Middlemist Creek (E), First Creek (F), Cottonwood Creek (G). Display/hide their locations on the map
Size of family households: 364 2-persons, 107 3-persons, 71 4-persons, 53 5-persons, 23 6-persons, 1 7-or-more-persons
Size of nonfamily households: 108 1-person, 9 2-persons, 4 3-persons
282 married couples with children.
81 single-parent households (14 men, 67 women).
96.0% of residents of 80105 zip code speak English at home.
3.5% of residents speak Spanish at home (54% very well, 7% well, 39% not well).
0.3% of residents speak other Indo-European language at home (100% very well).
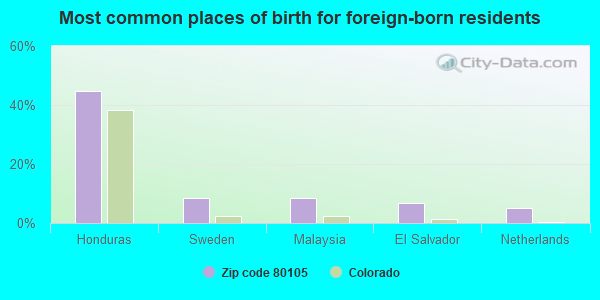
Foreign born population: 58 (3.1%) (48.5% of them are naturalized citizens)
This zip code:
3.1%
Whole state:
9.5%
45%Honduras
9%Sweden
9%Malaysia
7%El Salvador
5%Netherlands
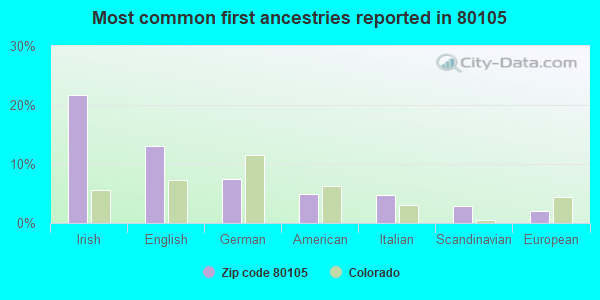
22%Irish
13%English
8%German
5%American
5%Italian
3%Scandinavian
2%European
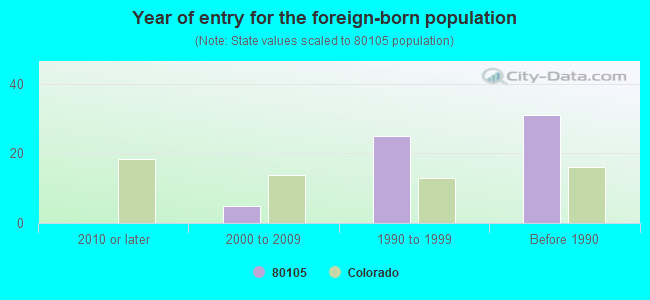
Year of entry for the foreign-born population
02010 or later
52000 to 2009
251990 to 1999
31Before 1990
Facilities with environmental interests located in this zip code:
AWFUL JOHNS CONOCO (484 7TH AVENUE in DEER TRAIL, CO)
AIR MINOR (AIRS/AFS) CRITERIA AND HAZARDOUS AIR POLLUTANT INVENTORY (Inventory of air pollution sources) Business SIC classification: GASOLINE SERVICE STATIONS
ARAPAHOE SCHOOL DISTRICT 26 J (PO BOX 129 in DEER TRAIL, CO)
ENFORCEMENT/COMPLIANCE ACTIVITY (Integrated Compliance Information System) COMPLIANCE ACTIVITY (Tracking inspections of insecticide, fungicide, and rodenticide, and toxic substances) Business SIC classification: ELEMENTARY AND SECONDARY SCHOOLS Alternative names: DEER TRAIL SCHOOL DISTRICT
BENNETT SOLID WASTE DISPOSAL SITE LANDFILL (BOX 309 in DEER TRAIL, CO)
CRITERIA AND HAZARDOUS AIR POLLUTANT INVENTORY (Inventory of air pollution sources) Business SIC classification: REFUSE SYSTEMS Business NAICS classification: SOLID WASTE LANDFILL.
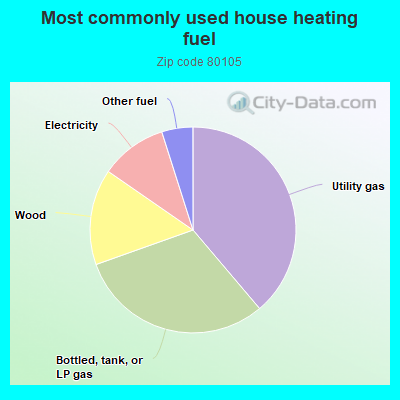
38.9%Utility gas
30.8%Bottled, tank, or LP gas
15.1%Wood
10.5%Electricity
4.9%Other fuel
Population in 1990: 634. Population change in the 1990s: +497 (+78.4%).
Place of birth for U.S.-born residents:
This state: 1,039
Northeast: 182
Midwest: 255
South: 137
West: 163
47% of the 80105 zip code residents lived in the same house 5 years ago. Out of people who lived in different houses, 36% lived in this county. Out of people who lived in different counties, 50% lived in Colorado.
95% of the 80105 zip code residents lived in the same house 1 year ago. Out of people who lived in different houses, 12% moved from this county. Out of people who lived in different houses, 102% moved from different county within same state. Out of people who lived in different houses, 2% moved from different state.
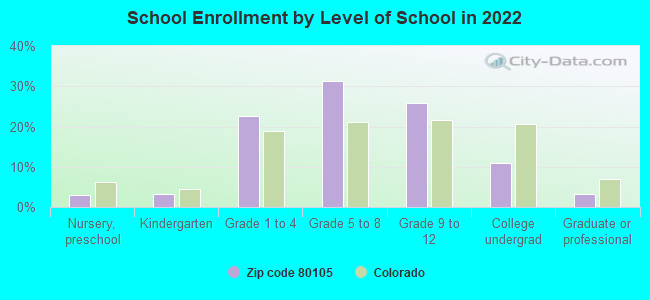
Private vs. public school enrollment:
Students in private schools in grades 1 to 8 (elementary and middle school): 11
Here:
7.8%
Colorado:
11.4%
Students in private schools in grades 9 to 12 (high school): 8
Here:
11.8%
Colorado:
8.5%
Students in private undergraduate colleges:
Here:
0.0%
Colorado:
14.0%
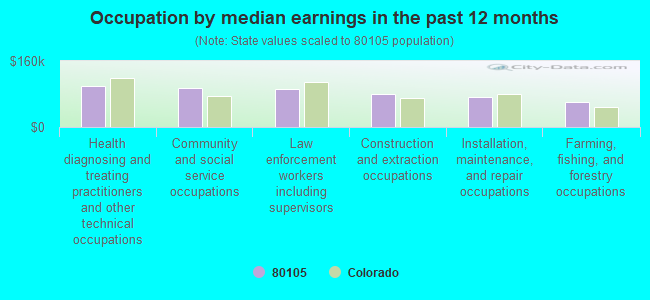
Occupation by median earnings in the past 12 months ($)
100,492Health diagnosing and treating practitioners and other technical occupations
95,666Community and social service occupations
92,977Law enforcement workers including supervisors
80,958Construction and extraction occupations
71,864Installation, maintenance, and repair occupations
59,417Farming, fishing, and forestry occupations
Top industries in this zip code by the number of employees in 2005:
Administrative and Support and Waste Management and Remediation Services: Solid Waste Landfill (5-9 employees: 1 establishment)
Construction: Water and Sewer Line and Related Structures Construction (5-9: 1)
Administrative and Support and Waste Management and Remediation Services: Landscaping Services (5-9: 1)
Accommodation and Food Services: Full-Service Restaurants (5-9: 1)
Construction: Painting and Wall Covering Contractors (1-4: 2)
Administrative and Support and Waste Management and Remediation Services: Security Systems Services (except Locksmiths) (1-4: 2)
Wholesale Trade: Electrical Apparatus and Equipment, Wiring Supplies, and Related Equipment Merchant Wholesalers (1-4: 1)
Mining: Crude Petroleum and Natural Gas Extraction (1-4: 1)
Fatal accident statistics in 2014:
Fatal accident count: 3
Vehicles involved in fatal accidents: 5
Fatal accidents caused by drunken drivers: 1
Fatalities: 3
Persons involved in fatal accidents: 7
Pedestrians involved in fatal accidents: 0
Fatal accident statistics in 2012:
Fatal accident count: 1
Vehicles involved in fatal accidents: 2
Fatal accidents caused by drunken drivers: 0
Fatalities: 2
Persons involved in fatal accidents: 3
Pedestrians involved in fatal accidents: 0
Home Mortgage Disclosure Act Aggregated Statistics For Year 2009 (Based on 4 partial tracts)
A) FHA, FSA/RHS & VA Home Purchase Loans
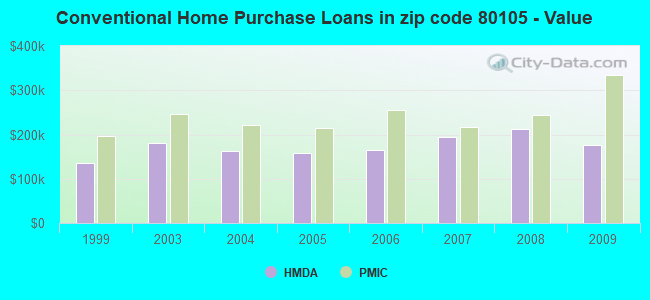
B) Conventional Home Purchase Loans
C) Refinancings
D) Home Improvement Loans
F) Non-occupant Loans on < 5 Family Dwellings (A B C & D)
G) Loans On Manufactured Home Dwelling (A B C & D)
Number
Average Value
Number
Average Value
Number
Average Value
Number
Average Value
Number
Average Value
Number
Average Value
LOANS ORIGINATED
45
$185,041
22
$177,001
179
$216,609
14
$75,851
7
$108,164
10
$141,208
APPLICATIONS APPROVED, NOT ACCEPTED
2
$159,840
2
$159,775
20
$246,979
1
$263,760
0
$0
0
$0
APPLICATIONS DENIED
16
$175,528
11
$150,284
93
$218,712
12
$55,708
5
$128,170
9
$172,700
APPLICATIONS WITHDRAWN
7
$171,487
5
$247,898
38
$200,123
3
$63,417
3
$178,103
3
$203,003
FILES CLOSED FOR INCOMPLETENESS
2
$258,400
0
$0
14
$221,503
0
$0
0
$0
0
$0
Aggregated Statistics For Year 2008 (Based on 4 partial tracts)
A) FHA, FSA/RHS & VA Home Purchase Loans
B) Conventional Home Purchase Loans
C) Refinancings
D) Home Improvement Loans
E) Loans on Dwellings For 5+ Families
F) Non-occupant Loans on < 5 Family Dwellings (A B C & D)
G) Loans On Manufactured Home Dwelling (A B C & D)
Number
Average Value
Number
Average Value
Number
Average Value
Number
Average Value
Number
Average Value
Number
Average Value
Number
Average Value
LOANS ORIGINATED
56
$190,951
37
$211,605
97
$205,917
12
$53,120
0
$0
9
$136,331
13
$150,762
APPLICATIONS APPROVED, NOT ACCEPTED
2
$286,955
12
$210,986
13
$226,412
4
$65,780
0
$0
1
$85,250
0
$0
APPLICATIONS DENIED
9
$183,962
15
$139,774
96
$241,548
17
$68,568
0
$0
3
$131,990
5
$99,840
APPLICATIONS WITHDRAWN
8
$177,042
7
$102,754
41
$200,840
4
$134,332
1
$176,910
4
$189,948
3
$161,363
FILES CLOSED FOR INCOMPLETENESS
2
$334,225
1
$257,330
8
$224,779
5
$122,586
0
$0
0
$0
2
$80,415
Aggregated Statistics For Year 2007 (Based on 4 partial tracts)
A) FHA, FSA/RHS & VA Home Purchase Loans
B) Conventional Home Purchase Loans
C) Refinancings
D) Home Improvement Loans
F) Non-occupant Loans on < 5 Family Dwellings (A B C & D)
G) Loans On Manufactured Home Dwelling (A B C & D)
Number
Average Value
Number
Average Value
Number
Average Value
Number
Average Value
Number
Average Value
Number
Average Value
LOANS ORIGINATED
27
$198,171
87
$194,899
153
$192,658
27
$55,469
17
$172,379
21
$182,410
APPLICATIONS APPROVED, NOT ACCEPTED
1
$214,220
14
$187,756
34
$179,459
4
$23,812
2
$112,665
5
$165,334
APPLICATIONS DENIED
4
$177,112
38
$201,351
188
$198,116
23
$78,390
7
$263,684
10
$191,693
APPLICATIONS WITHDRAWN
1
$232,100
12
$188,712
62
$193,510
6
$182,687
5
$84,522
1
$196,210
FILES CLOSED FOR INCOMPLETENESS
0
$0
2
$258,660
13
$241,345
0
$0
1
$309,870
0
$0
Aggregated Statistics For Year 2006 (Based on 4 partial tracts)
A) FHA, FSA/RHS & VA Home Purchase Loans
B) Conventional Home Purchase Loans
C) Refinancings
D) Home Improvement Loans
F) Non-occupant Loans on < 5 Family Dwellings (A B C & D)
G) Loans On Manufactured Home Dwelling (A B C & D)
Number
Average Value
Number
Average Value
Number
Average Value
Number
Average Value
Number
Average Value
Number
Average Value
LOANS ORIGINATED
9
$198,726
162
$165,321
246
$175,444
33
$47,369
24
$148,904
16
$158,153
APPLICATIONS APPROVED, NOT ACCEPTED
2
$156,860
28
$181,560
64
$205,686
3
$131,597
7
$271,889
7
$144,946
APPLICATIONS DENIED
3
$225,523
82
$169,344
212
$194,972
26
$101,573
14
$171,042
15
$145,988
APPLICATIONS WITHDRAWN
4
$201,048
40
$147,780
139
$197,133
7
$58,689
8
$119,448
1
$43,820
FILES CLOSED FOR INCOMPLETENESS
0
$0
4
$140,395
22
$211,181
1
$278,770
0
$0
0
$0
Aggregated Statistics For Year 2005 (Based on 4 partial tracts)
A) FHA, FSA/RHS & VA Home Purchase Loans
B) Conventional Home Purchase Loans
C) Refinancings
D) Home Improvement Loans
F) Non-occupant Loans on < 5 Family Dwellings (A B C & D)
G) Loans On Manufactured Home Dwelling (A B C & D)
Number
Average Value
Number
Average Value
Number
Average Value
Number
Average Value
Number
Average Value
Number
Average Value
LOANS ORIGINATED
17
$187,508
186
$157,833
288
$186,587
35
$66,375
24
$169,530
15
$134,353
APPLICATIONS APPROVED, NOT ACCEPTED
1
$116,550
30
$161,896
67
$182,400
5
$90,312
2
$275,555
3
$76,483
APPLICATIONS DENIED
5
$169,550
73
$149,264
243
$208,472
25
$58,182
10
$224,799
17
$128,021
APPLICATIONS WITHDRAWN
1
$100,570
49
$164,797
175
$203,613
13
$123,804
6
$223,852
1
$505,970
FILES CLOSED FOR INCOMPLETENESS
0
$0
1
$138,310
34
$227,832
0
$0
0
$0
0
$0
Aggregated Statistics For Year 2004 (Based on 4 partial tracts)
A) FHA, FSA/RHS & VA Home Purchase Loans
B) Conventional Home Purchase Loans
C) Refinancings
D) Home Improvement Loans
F) Non-occupant Loans on < 5 Family Dwellings (A B C & D)
G) Loans On Manufactured Home Dwelling (A B C & D)
Number
Average Value
Number
Average Value
Number
Average Value
Number
Average Value
Number
Average Value
Number
Average Value
LOANS ORIGINATED
30
$182,268
193
$162,007
378
$193,511
34
$47,179
23
$186,114
19
$181,722
APPLICATIONS APPROVED, NOT ACCEPTED
2
$176,825
29
$149,269
86
$196,003
5
$45,676
5
$129,850
10
$127,748
APPLICATIONS DENIED
8
$226,759
91
$151,399
247
$184,424
21
$62,135
10
$135,321
21
$129,408
APPLICATIONS WITHDRAWN
2
$176,990
36
$200,424
145
$193,153
7
$100,637
3
$219,443
5
$149,460
FILES CLOSED FOR INCOMPLETENESS
0
$0
2
$182,165
36
$220,962
4
$24,265
0
$0
1
$273,940
Aggregated Statistics For Year 2003 (Based on 4 partial tracts)
A) FHA, FSA/RHS & VA Home Purchase Loans
B) Conventional Home Purchase Loans
C) Refinancings
D) Home Improvement Loans
F) Non-occupant Loans on < 5 Family Dwellings (A B C & D)
Number
Average Value
Number
Average Value
Number
Average Value
Number
Average Value
Number
Average Value
LOANS ORIGINATED
33
$203,745
96
$179,960
541
$180,953
27
$64,797
18
$132,982
APPLICATIONS APPROVED, NOT ACCEPTED
2
$172,865
17
$211,912
86
$180,548
6
$61,130
5
$164,022
APPLICATIONS DENIED
4
$124,168
28
$168,129
219
$183,674
21
$30,045
5
$183,348
APPLICATIONS WITHDRAWN
2
$265,450
16
$176,631
125
$189,989
7
$64,824
0
$0
FILES CLOSED FOR INCOMPLETENESS
0
$0
2
$174,305
19
$174,122
1
$40,740
1
$225,400
Aggregated Statistics For Year 1999 (Based on 2 partial tracts)
A) FHA, FSA/RHS & VA Home Purchase Loans
B) Conventional Home Purchase Loans
C) Refinancings
D) Home Improvement Loans
F) Non-occupant Loans on < 5 Family Dwellings (A B C & D)
Detailed PMIC statistics for the following Tracts:0071.01
, 0084.02
2003 - 2018 National Fire Incident Reporting System (NFIRS) incidents
Based on the data from the years 2003 - 2018 the average number of fires per year is 11. The highest number of reported fires - 40 took place in 2016, and the least - 0 in 2004. The data has a growing trend.
When looking into fire subcategories, the most reports belonged to: Outside Fires (76.4%), and Structure Fires (13.2%).
Fire incident types reported to NFIRS in Zip Code 80105


 Nearest zip codes: 80103, 80101, 80136, 80757, 80828, 80835.
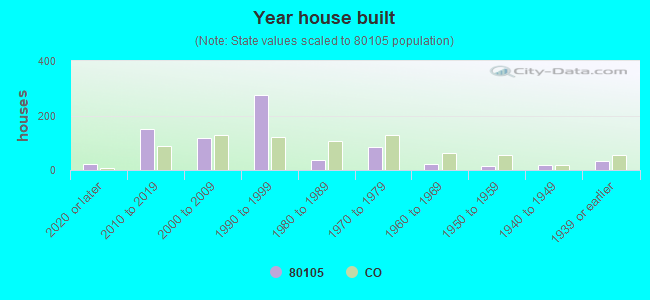


 Based on the data from the years 2003 - 2018 the average number of fires per year is 11. The highest number of reported fires - 40 took place in 2016, and the least - 0 in 2004. The data has a growing trend.
 When looking into fire subcategories, the most reports belonged to: Outside Fires (76.4%), and Structure Fires (13.2%).