Estimated zip code population in 2022: 2,557 Zip code population in 2010: 2,042 Zip code population in 2000: 1,529
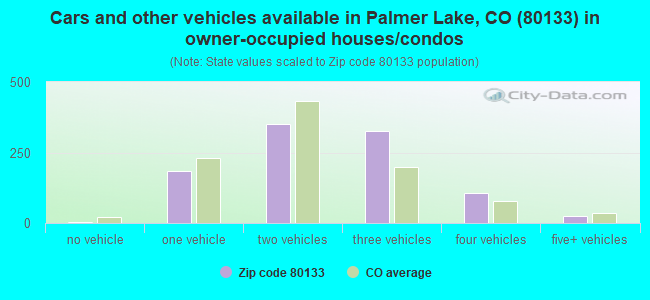
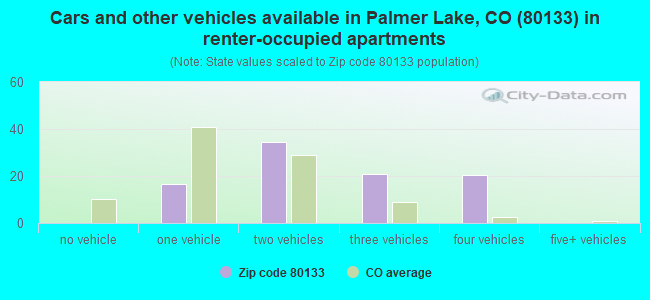
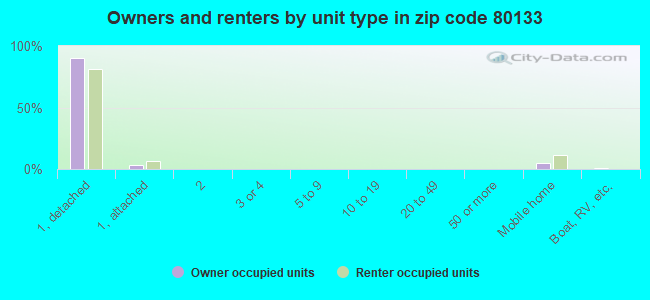
Houses and condos: 1,118 Renter-occupied apartments: 90
% of renters here:
8%
State:
34%
March 2022 cost of living index in zip code 80133: 99.7 (near average, U.S. average is 100)
Land area: 30.8 sq. mi. Water area: 0.0 sq. mi.
Population density: 83 people per square mile
(very low).
OSM Map
General Map
Google Map
MSN Map
OSM Map
General Map
Google Map
MSN Map
OSM Map
General Map
Google Map
MSN Map
OSM Map
General Map
Google Map
MSN Map
Please wait while loading the map...
Real estate property taxes paid for housing units in 2022:
This zip code:
0.4% ($1,685)
Colorado:
0.5% ($2,422)
Median real estate property taxes paid for housing units with mortgages in 2022: $1,820 (0.4%) Median real estate property taxes paid for housing units with no mortgage in 2022: $1,324 (0.3%)
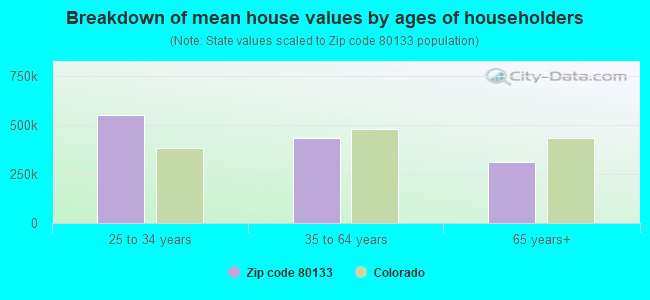
Estimated median house/condo value in 2022: $446,402
80133:
$446,402
Colorado:
$531,100
According to our research of Colorado and other state lists, there were 4 registered sex offenders living in 80133 zip code as of May 17, 2024. The ratio of all residents to sex offenders in zip code 80133 is 623 to 1. The ratio of registered sex offenders to all residents in this zip code is lower than the state average.
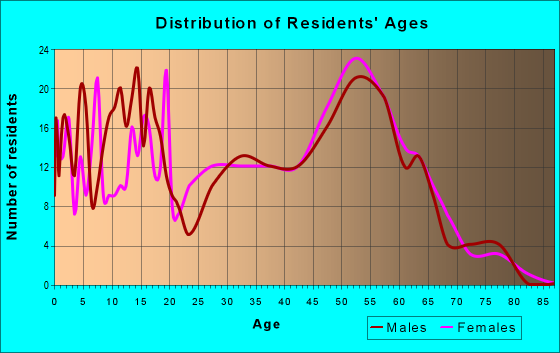
Median resident age:
This zip code:
50.8 years
Colorado median age:
37.7 years
Average household size:
This zip code:
2.3 people
Colorado:
2.4 people
Averages for the 2020 tax year for zip code 80133, filed in 2021:
Average Adjusted Gross Income (AGI) in 2020: $83,396 (Individual Income Tax Returns)
Here:
$83,396
State:
$89,260
Salary/wage: $69,470 (reported on 81.2% of returns)
Here:
$69,470
State:
$70,330
(% of AGI for various income ranges: 1109.6% for AGIs below $25k, 3595.0% for AGIs $25k-50k, 6807.9% for AGIs $50k-75k, 9082.7% for AGIs $75k-100k, 18730.0% for AGIs $100k-200k, 67786.7% for AGIs over 200k)
Taxable interest for individuals: $680 (reported on 42.8% of returns)
This zip code:
$680
Colorado:
$2,176
(% of AGI for various income ranges: 26.2% for AGIs below $25k, 16.0% for AGIs $25k-50k, 26.4% for AGIs $50k-75k, 24.5% for AGIs $75k-100k, 68.0% for AGIs $100k-200k, 466.7% for AGIs over 200k)
Ordinary dividends: $4,532 (reported on 24.6% of returns)
Here:
$4,532
State:
$8,820
(% of AGI for various income ranges: 26.2% for AGIs below $25k, 81.5% for AGIs $25k-50k, 73.6% for AGIs $50k-75k, 89.1% for AGIs $75k-100k, 292.0% for AGIs $100k-200k, 2253.3% for AGIs over 200k)
Net capital gain/loss in AGI: +$26,970 (reported on 23.9% of returns)
Here:
+$26,970
State:
+$37,276
(% of AGI for various income ranges: 32.9% for AGIs below $25k, 57.0% for AGIs $25k-50k, 176.4% for AGIs $50k-75k, 387.3% for AGIs $75k-100k, 686.0% for AGIs $100k-200k, 23350.0% for AGIs over 200k)
Profit/loss from business: +$12,823 (reported on 22.5% of returns)
Here:
+$12,823
State:
+$15,295
(% of AGI for various income ranges: 183.3% for AGIs below $25k, 332.5% for AGIs $25k-50k, 166.4% for AGIs $50k-75k, 164.5% for AGIs $75k-100k, 1120.0% for AGIs $100k-200k, 2586.7% for AGIs over 200k)
Taxable individual retirement arrangement distribution: $19,607 (reported on 10.1% of returns)
80133:
$19,607
Colorado:
$23,785
(% of AGI for various income ranges: 144.6% for AGIs below $25k, 283.6% for AGIs $50k-75k, 224.5% for AGIs $75k-100k, 1169.3% for AGIs $100k-200k)
Total itemized deductions: $28,960 (reported on 14.5% of returns)
Here:
$28,960
State:
$35,141
(% of AGI for various income ranges: 287.5% for AGIs $25k-50k, 446.4% for AGIs $50k-75k, 670.9% for AGIs $75k-100k, 1125.3% for AGIs $100k-200k, 7220.0% for AGIs over 200k)
Charity contributions: $8,962 (reported on 11.6% of returns)
Here:
$8,962
State:
$12,103
(% of AGI for various income ranges: 120.0% for AGIs $25k-50k, 69.1% for AGIs $75k-100k, 221.3% for AGIs $100k-200k, 2620.0% for AGIs over 200k)
Taxes paid: $6,525 (reported on 14.5% of returns)
80133:
$6,525
State:
$7,710
(% of AGI for various income ranges: 43.5% for AGIs $25k-50k, 67.9% for AGIs $50k-75k, 168.2% for AGIs $75k-100k, 307.3% for AGIs $100k-200k, 1590.0% for AGIs over 200k)
Earned income credit: $1,854 (reported on 9.4% of returns)
Here:
$1,854
State:
$2,053
(% of AGI for various income ranges: 62.5% for AGIs below $25k, 45.5% for AGIs $25k-50k)
Percentage of individuals using paid preparers for their 2020 taxes: 93.5%
Here:
93%
State:
93%
(% for various income ranges: 91.7% for AGIs below $25k, 92.6% for AGIs $25k-50k, 95.2% for AGIs $50k-75k, 93.8% for AGIs $75k-100k, 96.4% for AGIs $100k-200k, 90.0% for AGIs over 200k)
Averages for the 2012 tax year for zip code 80133, filed in 2013:
Average Adjusted Gross Income (AGI) in 2012: $57,747 (Individual Income Tax Returns)
Here:
$57,747
State:
$69,103
Salary/wage: $49,425 (reported on 83.7% of returns)
Here:
$49,425
State:
$54,794
(% of AGI for various income ranges: 76.0% for AGIs below $25k, 77.9% for AGIs $25k-50k, 78.0% for AGIs $50k-75k, 74.4% for AGIs $75k-100k, 77.6% for AGIs $100k-200k, 35.2% for AGIs over 200k)
Taxable interest for individuals: $998 (reported on 44.2% of returns)
This zip code:
$998
Colorado:
$1,971
(% of AGI for various income ranges: 1.0% for AGIs below $25k, 0.7% for AGIs $25k-50k, 1.0% for AGIs $50k-75k, 0.1% for AGIs $75k-100k, 0.5% for AGIs $100k-200k, 1.9% for AGIs over 200k)
Ordinary dividends: $3,785 (reported on 20.9% of returns)
Here:
$3,785
State:
$7,140
(% of AGI for various income ranges: 1.9% for AGIs below $25k, 1.1% for AGIs $25k-50k, 0.5% for AGIs $50k-75k, 0.3% for AGIs $75k-100k, 2.9% for AGIs $100k-200k)
Net capital gain/loss in AGI: +$6,137 (reported on 14.7% of returns)
Here:
+$6,137
State:
+$23,009
(% of AGI for various income ranges: 0.2% for AGIs $25k-50k, 0.5% for AGIs $50k-75k, 0.1% for AGIs $75k-100k, 4.3% for AGIs $100k-200k)
Profit/loss from business: +$9,732 (reported on 21.7% of returns)
Here:
+$9,732
State:
+$13,514
(% of AGI for various income ranges: 12.0% for AGIs below $25k, 5.4% for AGIs $25k-50k, 4.5% for AGIs $50k-75k, 3.4% for AGIs $75k-100k, 2.3% for AGIs $100k-200k)
Taxable individual retirement arrangement distribution: $13,771 (reported on 10.9% of returns)
80133:
$13,771
Colorado:
$17,927
(% of AGI for various income ranges: 3.2% for AGIs below $25k, 2.3% for AGIs $25k-50k, 2.8% for AGIs $50k-75k, 2.6% for AGIs $75k-100k, 3.4% for AGIs $100k-200k)
Total itemized deductions: $22,554 (23% of AGI, reported on 38.8% of returns)
Here:
$22,554
State:
$24,621
Here:
23.2% of AGI
State:
18.5% of AGI
(% of AGI for various income ranges: 15.4% for AGIs below $25k, 13.7% for AGIs $25k-50k, 17.2% for AGIs $50k-75k, 14.1% for AGIs $75k-100k, 15.5% for AGIs $100k-200k, 14.4% for AGIs over 200k)
Charity contributions: $3,207 (reported on 33.3% of returns)
Here:
$3,207
State:
$4,449
(% of AGI for various income ranges: 0.6% for AGIs below $25k, 1.5% for AGIs $25k-50k, 1.9% for AGIs $50k-75k, 1.9% for AGIs $75k-100k, 2.0% for AGIs $100k-200k, 2.3% for AGIs over 200k)
Taxes paid: $5,584 (reported on 38.8% of returns)
80133:
$5,584
State:
$7,641
(% of AGI for various income ranges: 1.5% for AGIs below $25k, 2.1% for AGIs $25k-50k, 3.4% for AGIs $50k-75k, 3.4% for AGIs $75k-100k, 4.7% for AGIs $100k-200k, 5.0% for AGIs over 200k)
Earned income credit: $1,663 (reported on 14.7% of returns)
Here:
$1,663
State:
$2,095
(% of AGI for various income ranges: 4.5% for AGIs below $25k, 0.8% for AGIs $25k-50k)
Percentage of individuals using paid preparers for their 2012 taxes: 45.0%
Here:
45%
State:
49%
(% for various income ranges: 39.1% for AGIs below $25k, 46.2% for AGIs $25k-50k, 47.4% for AGIs $50k-75k, 50.0% for AGIs $75k-100k, 57.9% for AGIs $100k-200k)
Averages for the 2004 tax year for zip code 80133, filed in 2005:
Average Adjusted Gross Income (AGI) in 2004: $48,297 (Individual Income Tax Returns)
Here:
$48,297
State:
$55,014
Salary/wage: $43,593 (reported on 84.0% of returns)
Here:
$43,593
State:
$46,010
(% of AGI for various income ranges: 116.6% for AGIs below $10k, 70.5% for AGIs $10k-25k, 79.8% for AGIs $25k-50k, 79.2% for AGIs $50k-75k, 84.1% for AGIs $75k-100k, 65.5% for AGIs over 100k)
Taxable interest for individuals: $1,142 (reported on 50.4% of returns)
This zip code:
$1,142
Colorado:
$2,127
(% of AGI for various income ranges: 5.1% for AGIs below $10k, 1.8% for AGIs $10k-25k, 1.3% for AGIs $25k-50k, 0.8% for AGIs $50k-75k, 0.7% for AGIs $75k-100k, 1.4% for AGIs over 100k)
Taxable dividends: $1,958 (reported on 24.7% of returns)
Here:
$1,958
State:
$3,782
(% of AGI for various income ranges: 1.7% for AGIs below $10k, 0.7% for AGIs $10k-25k, 0.7% for AGIs $25k-50k, 0.6% for AGIs $50k-75k, 0.4% for AGIs $75k-100k, 1.9% for AGIs over 100k)
Net capital gain/loss: +$3,446 (reported on 23.6% of returns)
Here:
+$3,446
State:
+$17,882
(% of AGI for various income ranges: -2.6% for AGIs below $10k, 0.7% for AGIs $10k-25k, 0.5% for AGIs $25k-50k, 1.6% for AGIs $50k-75k, 0.6% for AGIs $75k-100k, 3.5% for AGIs over 100k)
Profit/loss from business: +$7,144 (reported on 27.4% of returns)
Here:
+$7,144
State:
+$11,247
(% of AGI for various income ranges: 26.3% for AGIs below $10k, 11.6% for AGIs $10k-25k, 7.9% for AGIs $25k-50k, 5.2% for AGIs $50k-75k, 1.0% for AGIs $75k-100k, 0.1% for AGIs over 100k)
IRA payment deduction: $3,073 (reported on 3.9% of returns)
80133:
$3,073
Colorado:
$2,947
Total itemized deductions: $18,639 (26% of AGI, reported on 50.3% of returns)
Here:
$18,639
State:
$20,560
Here:
25.6% of AGI
State:
21.4% of AGI
(% of AGI for various income ranges: 29.5% for AGIs below $10k, 18.0% for AGIs $10k-25k, 18.0% for AGIs $25k-50k, 21.0% for AGIs $50k-75k, 19.8% for AGIs $75k-100k, 18.8% for AGIs over 100k)
Charity contributions deductions: $2,537 (3% of AGI, reported on 45.6% of returns)
Here:
$2,537
State:
$3,518
Here:
3.4% of AGI
State:
3.4% of AGI
(% of AGI for various income ranges: 2.6% for AGIs below $10k, 1.7% for AGIs $10k-25k, 1.8% for AGIs $25k-50k, 2.5% for AGIs $50k-75k, 2.8% for AGIs $75k-100k, 2.6% for AGIs over 100k)
Total tax: $6,114 (reported on 81.3% of returns)
80133:
$6,114
State:
$9,173
(% of AGI for various income ranges: 6.1% for AGIs below $10k, 5.7% for AGIs $10k-25k, 7.3% for AGIs $25k-50k, 8.4% for AGIs $50k-75k, 10.0% for AGIs $75k-100k, 14.9% for AGIs over 100k)
Earned income credit: $1,270 (reported on 10.5% of returns)
Here:
$1,270
State:
$1,595
Percentage of individuals using paid preparers for their 2004 taxes: 52.4%
Here:
52%
State:
55%
(% for various income ranges: 50.3% for AGIs below $10k, 51.2% for AGIs $10k-25k, 48.9% for AGIs $25k-50k, 57.6% for AGIs $50k-75k, 50.9% for AGIs $75k-100k, 58.9% for AGIs over 100k)
Household received Food Stamps/SNAP in the past 12 months: 30 Household did not receive Food Stamps/SNAP in the past 12 months: 1,057
Women who had a birth in the past 12 months: 43 (0 now married, 38 unmarried) Women who did not have a birth in the past 12 months: 418 (215 now married, 202 unmarried)
Housing units in zip code 80133 with a mortgage: 709 (50 second mortgage, 43 both second mortgage and home equity loan) Houses without a mortgage: 82
Median monthly owner costs for units with a mortgage: $1,953 Median monthly owner costs for units without a mortgage: $633
Residents with income below the poverty level in 2022:
This zip code:
3.2%
Whole state:
9.4%
Residents with income below 50% of the poverty level in 2022:
This zip code:
1.5%
Whole state:
4.6%
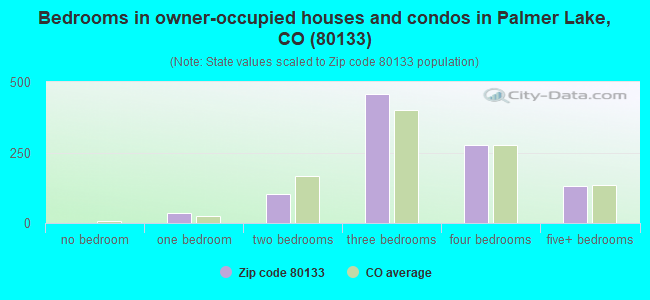
Median number of rooms in houses and condos:
Here:
6.8
State:
6.8
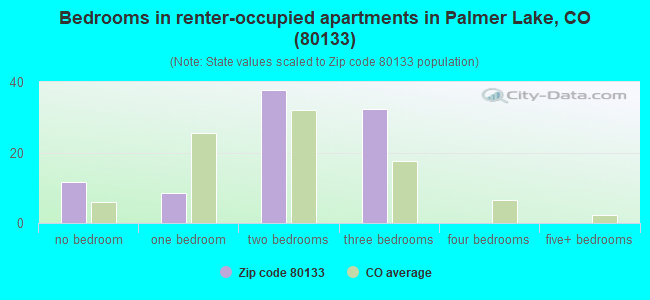
Median number of rooms in apartments:
Here:
4.0
State:
4.0
Notable locations in this zip code not listed on our city pages
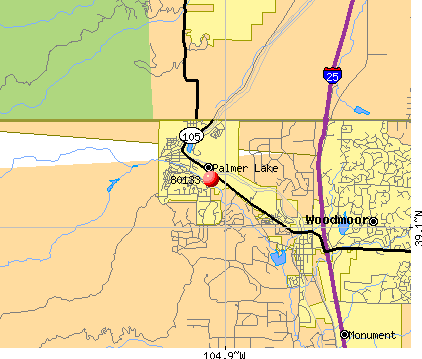
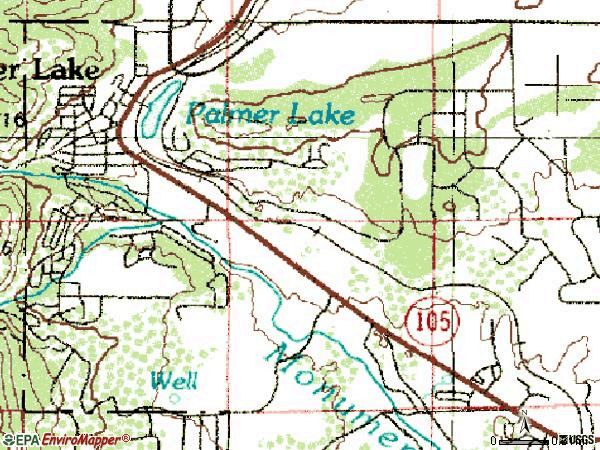
Notable locations in zip code 80133: Swank Cabin (A), Twin Pines Ranch (B), Tri - Lakes / Monument Fire Rescue Authority Station 1 (C), Palmer Lake Volunteer Fire Department (D), Palmer Lake Library (E). Display/hide their locations on the map
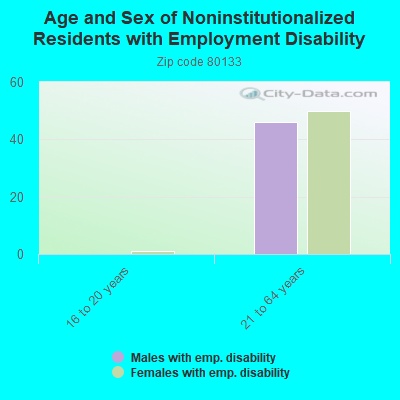
In group quarters: 3 (-1 institutionalized population)
Size of family households: 445 2-persons, 186 3-persons, 77 4-persons, 39 5-persons, 6 6-persons, 27 7-or-more-persons
Size of nonfamily households: 236 1-person, 61 2-persons, 12 3-persons
207 married couples with children.
31 single-parent households (13 men, 18 women).
88.9% of residents of 80133 zip code speak English at home.
7.2% of residents speak Spanish at home (100% very well).
4.3% of residents speak other Indo-European language at home (100% very well).
0.4% of residents speak Asian or Pacific Island language at home (33% very well, 67% not well).
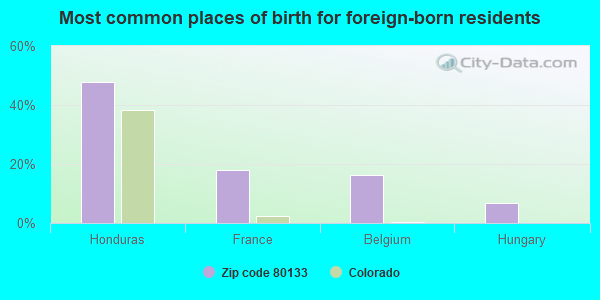
Foreign born population: 134 (5.3%) (56.4% of them are naturalized citizens)
This zip code:
5.3%
Whole state:
9.5%
48%Honduras
18%France
16%Belgium
7%Hungary
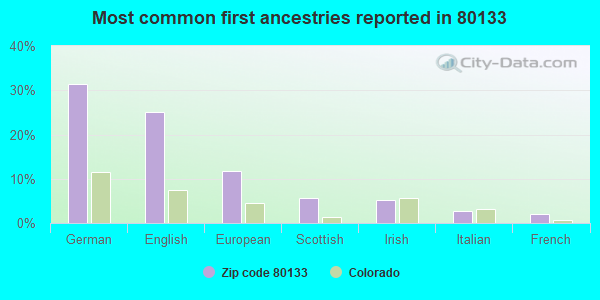
32%German
25%English
12%European
6%Scottish
5%Irish
3%Italian
2%French
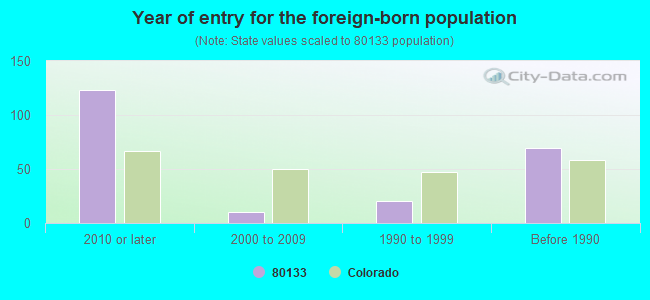
Year of entry for the foreign-born population
1232010 or later
102000 to 2009
201990 to 1999
69Before 1990
Facilities with environmental interests located in this zip code:
GRANDVIEW MOBILE HOME PARK, INC. (695 HWY 105 in PALMER LAKE, CO)
(Integrated Compliance Information System) - ICIS-08-2000-0114, FORMAL ENFORCEMENT ACTION Business SIC classification: WATER SUPPLY
COUNTRY CASH (56A HWY 105 in PALMER LAKE, CO)
AIR MINOR (AIRS/AFS) Business SIC classification: GASOLINE SERVICE STATIONS Alternative names: COUNTRY CASH GENERAL STORE
Housing units lacking complete plumbing facilities: 0.5% Housing units lacking complete kitchen facilities: 1.0%
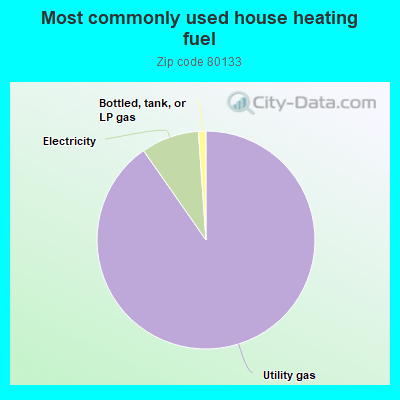
90.3%Utility gas
8.6%Electricity
1.1%Bottled, tank, or LP gas
Population in 1990: 1,237. Population change in the 1990s: +292 (+23.6%).
Place of birth for U.S.-born residents:
This state: 669
Northeast: 233
Midwest: 601
South: 317
West: 523
42% of the 80133 zip code residents lived in the same house 5 years ago. Out of people who lived in different houses, 48% lived in this county. Out of people who lived in different counties, 50% lived in Colorado.
85% of the 80133 zip code residents lived in the same house 1 year ago. Out of people who lived in different houses, 11% moved from this county. Out of people who lived in different houses, 76% moved from different county within same state. Out of people who lived in different houses, 16% moved from different state.
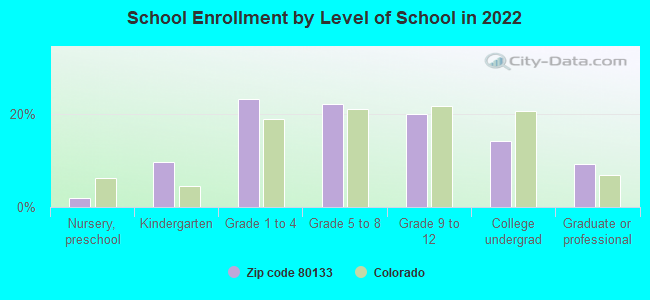
Private vs. public school enrollment:
Students in private schools in grades 1 to 8 (elementary and middle school): 26
Here:
16.6%
Colorado:
11.4%
Students in private schools in grades 9 to 12 (high school):
Here:
0.0%
Colorado:
8.5%
Students in private undergraduate colleges:
Here:
0.0%
Colorado:
14.0%
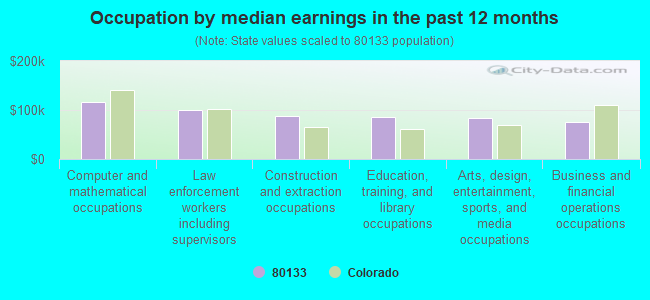
Occupation by median earnings in the past 12 months ($)
116,057Computer and mathematical occupations
99,665Law enforcement workers including supervisors
87,491Construction and extraction occupations
85,167Education, training, and library occupations
84,066Arts, design, entertainment, sports, and media occupations
76,452Business and financial operations occupations
Companies with federal contracts located in this zip code (PALMER LAKE, CO):
LETELLIER ENTERPRISES INC (581 COUNTY LINE RD) : $164,484 in 7 contractsfrom 2004 to 2006
Contracts for Food Items For Resale by Defense Commissary Agency Signed by year:2000: $0; 2001: $0; 2002: $0; 2003: $0; 2004: $41,819; 2005: $116,744; 2006: $5,921.
Biggest contracts:
$55,358 with Defense Commissary Agency for Food Items For Resale. Signed on 2005-04-01. Completion date: 2005-03-31.
$41,819, same as above.Signed on 2004-10-01. Completion date: 2005-02-28.
$26,488, same as above.Signed on 2005-10-01. Completion date: 2005-12-31.
$19,458, same as above.Signed on 2005-01-01. Completion date: 2005-03-31.
TIDEWATER EXPERIENTIAL TRAININ (430 THOMPSON PLACE; small business)
$48,695 with Air Force for Other Education and Training Services. Signed on 2004-08-12. Completion date: 2005-07-05.
OEL WORLDWIDE INDUSTRIES, LLC (701 COUNTY LINE RD; small business) : $17,640 in 4 contractsfrom 2004 to 2005
$6,974 with Air Force for Hand Tools, Power Driven. Signed on 2004-11-16. Completion date: 2004-11-29.
$4,135 with Air Force for Hand Tools, Nonedged, Nonpowered. Signed on 2005-03-04. Completion date: 2005-03-24.
$3,381 with Air Force for Electrical Hardware and Supplies. Signed on 2005-01-07. Completion date: 2005-01-18.
$3,150 with Air Force for Hand Tools, Power Driven. Signed on 2004-11-16. Completion date: 2004-11-29.
DECORATING ON A DIME INC (701 COUNTY LINE RD; small business)
$2,736 with Army for Miscellaneous Items. Signed on 2003-11-24. Completion date: 2003-10-01.
Top industries in this zip code by the number of employees in 2005:
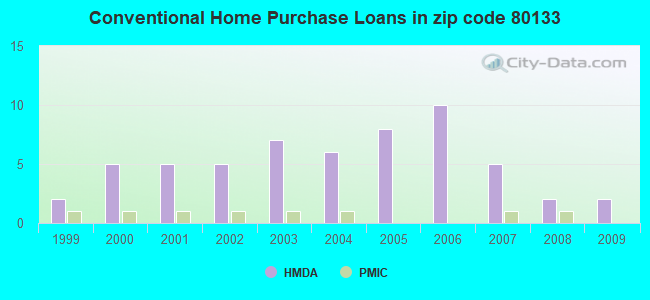
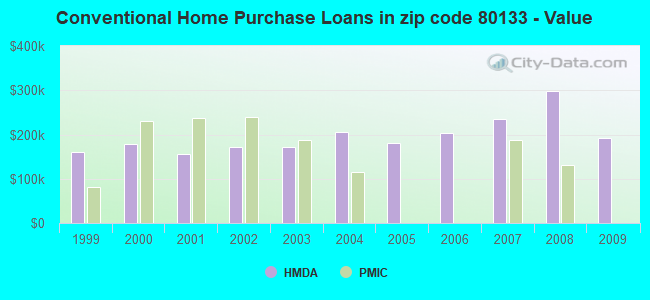
Detailed PMIC statistics for the following Tracts:0037.01
2003 - 2018 National Fire Incident Reporting System (NFIRS) incidents
Based on the data from the years 2003 - 2018 the average number of fire incidents per year is 9. The highest number of fire incidents - 31 took place in 2010, and the least - 1 in 2015. The data has a rising trend.
When looking into fire subcategories, the most reports belonged to: Structure Fires (49.3%), and Outside Fires (38.4%).
Fire incident types reported to NFIRS in Zip Code 80133
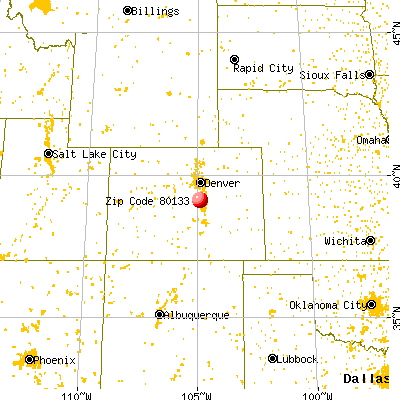


 Nearest zip codes: 80921, 80118, 80132, 80819, 80840, 80863.
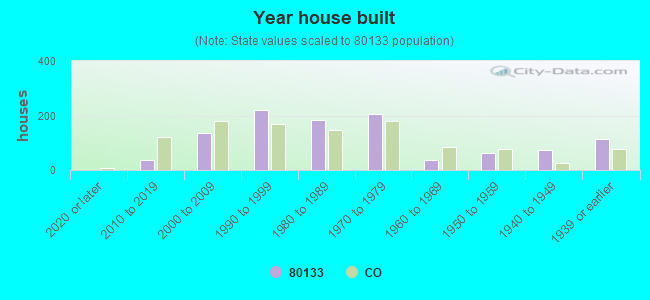


 Based on the data from the years 2003 - 2018 the average number of fire incidents per year is 9. The highest number of fire incidents - 31 took place in 2010, and the least - 1 in 2015. The data has a rising trend.
 When looking into fire subcategories, the most reports belonged to: Structure Fires (49.3%), and Outside Fires (38.4%).