Averages for the 2020 tax year for zip code 80459, filed in 2021:
Average Adjusted Gross Income (AGI) in 2020: $64,435 (Individual Income Tax Returns)
Here:
$64,435
State:
$89,260
Salary/wage: $52,043 (reported on 82.6% of returns)
Here:
$52,043
State:
$70,330
(% of AGI for various income ranges: 1335.2% for AGIs below $25k, 4000.4% for AGIs $25k-50k, 7614.6% for AGIs $50k-75k, 10355.6% for AGIs $75k-100k, 17280.0% for AGIs $100k-200k)
Taxable interest for individuals: $879 (reported on 28.1% of returns)
This zip code:
$879
Colorado:
$2,176
(% of AGI for various income ranges: 6.7% for AGIs below $25k, 10.9% for AGIs $25k-50k, 38.5% for AGIs $50k-75k, 54.4% for AGIs $75k-100k, 94.4% for AGIs $100k-200k)
Ordinary dividends: $2,306 (reported on 14.9% of returns)
Here:
$2,306
State:
$8,820
(% of AGI for various income ranges: 10.5% for AGIs below $25k, 22.6% for AGIs $25k-50k, 13.8% for AGIs $50k-75k, 46.7% for AGIs $75k-100k, 312.2% for AGIs $100k-200k)
Net capital gain/loss in AGI: +$30,278 (reported on 14.9% of returns)
Here:
+$30,278
State:
+$37,276
(% of AGI for various income ranges: 1.0% for AGIs below $25k, 12.6% for AGIs $25k-50k, 70.8% for AGIs $50k-75k, 170.0% for AGIs $75k-100k, 675.6% for AGIs $100k-200k)
Profit/loss from business: +$10,161 (reported on 19.0% of returns)
Here:
+$10,161
State:
+$15,295
(% of AGI for various income ranges: 191.4% for AGIs below $25k, 317.8% for AGIs $25k-50k, 276.9% for AGIs $50k-75k, 425.6% for AGIs $75k-100k, 512.2% for AGIs $100k-200k)
Taxable individual retirement arrangement distribution: $17,900 (reported on 5.8% of returns)
80459:
$17,900
Colorado:
$23,785
(% of AGI for various income ranges: 131.0% for AGIs below $25k, 293.1% for AGIs $50k-75k, 663.3% for AGIs $100k-200k)
Total itemized deductions: $26,457 (reported on 5.8% of returns)
Here:
$26,457
State:
$35,141
(% of AGI for various income ranges: 753.8% for AGIs $50k-75k, 968.9% for AGIs $100k-200k)
Charity contributions: $6,500 (reported on 3.3% of returns)
Here:
$6,500
State:
$12,103
(% of AGI for various income ranges: 288.9% for AGIs $100k-200k)
Taxes paid: $6,186 (reported on 5.8% of returns)
80459:
$6,186
State:
$7,710
(% of AGI for various income ranges: 122.3% for AGIs $50k-75k, 304.4% for AGIs $100k-200k)
Earned income credit: $1,964 (reported on 11.6% of returns)
Here:
$1,964
State:
$2,053
(% of AGI for various income ranges: 76.2% for AGIs below $25k, 50.0% for AGIs $25k-50k)
Percentage of individuals using paid preparers for their 2020 taxes: 92.6%
Here:
93%
State:
93%
(% for various income ranges: 88.2% for AGIs below $25k, 93.8% for AGIs $25k-50k, 95.0% for AGIs $50k-75k, 92.9% for AGIs $75k-100k, 94.1% for AGIs $100k-200k, 100.0% for AGIs over 200k)
Averages for the 2012 tax year for zip code 80459, filed in 2013:
Average Adjusted Gross Income (AGI) in 2012: $48,397 (Individual Income Tax Returns)
Here:
$48,397
State:
$69,103
Salary/wage: $43,567 (reported on 86.2% of returns)
Here:
$43,567
State:
$54,794
(% of AGI for various income ranges: 73.4% for AGIs below $25k, 77.3% for AGIs $25k-50k, 86.4% for AGIs $50k-75k, 86.8% for AGIs $75k-100k, 65.1% for AGIs $100k-200k)
Taxable interest for individuals: $694 (reported on 34.0% of returns)
This zip code:
$694
Colorado:
$1,971
(% of AGI for various income ranges: 0.9% for AGIs below $25k, 0.9% for AGIs $25k-50k, 0.2% for AGIs $50k-75k, 0.2% for AGIs $75k-100k, 0.5% for AGIs $100k-200k)
Ordinary dividends: $1,608 (reported on 12.8% of returns)
Here:
$1,608
State:
$7,140
(% of AGI for various income ranges: 0.7% for AGIs $25k-50k, 0.2% for AGIs $50k-75k, 0.1% for AGIs $75k-100k, 0.8% for AGIs $100k-200k)
Net capital gain/loss in AGI: +$8,655 (reported on 11.7% of returns)
Here:
+$8,655
State:
+$23,009
(% of AGI for various income ranges: 1.2% for AGIs $25k-50k, 0.1% for AGIs $50k-75k, 6.5% for AGIs $100k-200k)
Profit/loss from business: +$7,614 (reported on 22.3% of returns)
Here:
+$7,614
State:
+$13,514
(% of AGI for various income ranges: 7.6% for AGIs below $25k, 7.3% for AGIs $25k-50k, 2.7% for AGIs $50k-75k, 3.8% for AGIs $75k-100k)
Taxable individual retirement arrangement distribution: $12,267 (reported on 6.4% of returns)
80459:
$12,267
Colorado:
$17,927
Total itemized deductions: $17,583 (23% of AGI, reported on 30.9% of returns)
Here:
$17,583
State:
$24,621
Here:
23.4% of AGI
State:
18.5% of AGI
(% of AGI for various income ranges: 10.8% for AGIs below $25k, 9.9% for AGIs $25k-50k, 12.0% for AGIs $50k-75k, 11.7% for AGIs $75k-100k, 11.3% for AGIs $100k-200k)
Charity contributions: $3,310 (reported on 21.3% of returns)
Here:
$3,310
State:
$4,449
(% of AGI for various income ranges: 1.9% for AGIs $25k-50k, 1.4% for AGIs $50k-75k, 1.3% for AGIs $75k-100k, 1.8% for AGIs $100k-200k)
Taxes paid: $4,459 (reported on 30.9% of returns)
80459:
$4,459
State:
$7,641
(% of AGI for various income ranges: 1.0% for AGIs below $25k, 1.5% for AGIs $25k-50k, 3.2% for AGIs $50k-75k, 2.8% for AGIs $75k-100k, 4.1% for AGIs $100k-200k)
Earned income credit: $2,367 (reported on 16.0% of returns)
Here:
$2,367
State:
$2,095
(% of AGI for various income ranges: 6.5% for AGIs below $25k, 1.0% for AGIs $25k-50k)
Percentage of individuals using paid preparers for their 2012 taxes: 52.1%
Here:
52%
State:
49%
(% for various income ranges: 42.4% for AGIs below $25k, 50.0% for AGIs $25k-50k, 62.5% for AGIs $50k-75k, 58.3% for AGIs $75k-100k, 66.7% for AGIs $100k-200k)
Averages for the 2004 tax year for zip code 80459, filed in 2005:
Average Adjusted Gross Income (AGI) in 2004: $38,650 (Individual Income Tax Returns)
Here:
$38,650
State:
$55,014
Salary/wage: $35,907 (reported on 88.4% of returns)
Here:
$35,907
State:
$46,010
(% of AGI for various income ranges: 373.8% for AGIs below $10k, 82.4% for AGIs $10k-25k, 82.8% for AGIs $25k-50k, 86.8% for AGIs $50k-75k, 82.8% for AGIs $75k-100k, 62.2% for AGIs over 100k)
Taxable interest for individuals: $1,605 (reported on 39.1% of returns)
This zip code:
$1,605
Colorado:
$2,127
(% of AGI for various income ranges: 32.8% for AGIs below $10k, 2.0% for AGIs $10k-25k, 1.8% for AGIs $25k-50k, 1.2% for AGIs $50k-75k, 1.0% for AGIs $75k-100k, 1.7% for AGIs over 100k)
Taxable dividends: $1,779 (reported on 18.3% of returns)
Here:
$1,779
State:
$3,782
(% of AGI for various income ranges: 13.1% for AGIs below $10k, 0.3% for AGIs $10k-25k, 0.5% for AGIs $25k-50k, 0.1% for AGIs $50k-75k, 0.6% for AGIs $75k-100k, 3.0% for AGIs over 100k)
Net capital gain/loss: +$6,684 (reported on 16.0% of returns)
Here:
+$6,684
State:
+$17,882
(% of AGI for various income ranges: 68.3% for AGIs below $10k, 0.0% for AGIs $10k-25k, 2.1% for AGIs $25k-50k, 0.8% for AGIs $50k-75k, 1.5% for AGIs $75k-100k, 8.6% for AGIs over 100k)
Profit/loss from business: +$7,786 (reported on 22.6% of returns)
Here:
+$7,786
State:
+$11,247
(% of AGI for various income ranges: 67.8% for AGIs below $10k, 5.4% for AGIs $10k-25k, 6.9% for AGIs $25k-50k, 5.7% for AGIs $50k-75k, 1.0% for AGIs $75k-100k)
IRA payment deduction: $3,160 (reported on 2.5% of returns)
80459:
$3,160
Colorado:
$2,947
Total itemized deductions: $15,908 (26% of AGI, reported on 31.7% of returns)
Here:
$15,908
State:
$20,560
Here:
25.9% of AGI
State:
21.4% of AGI
(% of AGI for various income ranges: 70.5% for AGIs below $10k, 8.9% for AGIs $10k-25k, 13.1% for AGIs $25k-50k, 13.0% for AGIs $50k-75k, 13.3% for AGIs $75k-100k, 13.7% for AGIs over 100k)
Charity contributions deductions: $2,247 (3% of AGI, reported on 25.0% of returns)
Here:
$2,247
State:
$3,518
Here:
3.5% of AGI
State:
3.4% of AGI
(% of AGI for various income ranges: 0.9% for AGIs $10k-25k, 1.1% for AGIs $25k-50k, 1.1% for AGIs $50k-75k, 1.6% for AGIs $75k-100k, 3.1% for AGIs over 100k)
Total tax: $4,640 (reported on 78.1% of returns)
80459:
$4,640
State:
$9,173
(% of AGI for various income ranges: 15.3% for AGIs below $10k, 5.4% for AGIs $10k-25k, 6.9% for AGIs $25k-50k, 9.2% for AGIs $50k-75k, 9.9% for AGIs $75k-100k, 15.8% for AGIs over 100k)
Earned income credit: $1,795 (reported on 13.3% of returns)
Here:
$1,795
State:
$1,595
Percentage of individuals using paid preparers for their 2004 taxes: 56.8%
Here:
57%
State:
55%
(% for various income ranges: 45.5% for AGIs below $10k, 54.4% for AGIs $10k-25k, 58.1% for AGIs $25k-50k, 60.3% for AGIs $50k-75k, 65.4% for AGIs $75k-100k, 83.8% for AGIs over 100k)
Household received Food Stamps/SNAP in the past 12 months: 45 Household did not receive Food Stamps/SNAP in the past 12 months: 840
Women who had a birth in the past 12 months: 3 (3 now married, 0 unmarried) Women who did not have a birth in the past 12 months: 395 (235 now married, 158 unmarried)
Housing units in zip code 80459 with a mortgage: 410 (20 second mortgage, 21 both second mortgage and home equity loan) Median monthly owner costs for units with a mortgage: $1,720 Median monthly owner costs for units without a mortgage: $475
Residents with income below the poverty level in 2022:
This zip code:
13.9%
Whole state:
9.4%
Residents with income below 50% of the poverty level in 2022:
This zip code:
7.0%
Whole state:
4.6%
Median number of rooms in houses and condos:
Here:
4.3
State:
6.8
Median number of rooms in apartments:
Here:
3.1
State:
4.0
Notable locations in this zip code not listed on our city pages
Lakes and reservoirs: Kids Pond (A), Lake Agnes (B), Lily Lake (C), Ryder Lakes (D), Christenson Reservoir (E), Rock Gap Dam Reservoir (F), Jones Reservoir (G), McElroy Reservoir (H). Display/hide their locations on the map
Streams, rivers, and creeks: Beaver Creek (A), Elliott Creek (B), Charlie Creek (C), Round Creek (D), Black Creek (E), Sheephorn Creek (F), Dry Creek (G), King Creek (H), Spruce Creek (I). Display/hide their locations on the map
In group quarters: 14 (-1 institutionalized population)
Size of family households: 369 2-persons, 108 3-persons, 74 4-persons, 22 5-persons, 31 6-persons, 5 7-or-more-persons
Size of nonfamily households: 257 1-person, 19 2-persons
685 married couples with children.
72 single-parent households (72 women).
84.2% of residents of 80459 zip code speak English at home.
14.5% of residents speak Spanish at home (93% very well, 3% well, 3% not well).
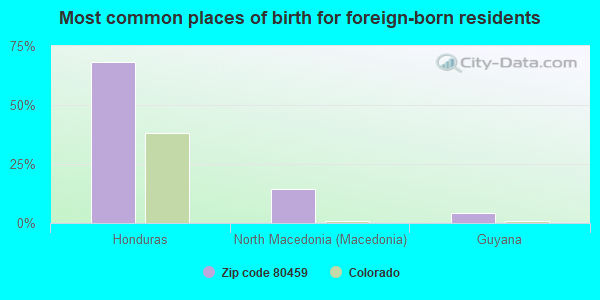
Foreign born population: 68 (2.7%) (34.8% of them are naturalized citizens)
This zip code:
2.7%
Whole state:
9.5%
68%Honduras
14%North Macedonia (Macedonia)
4%Guyana
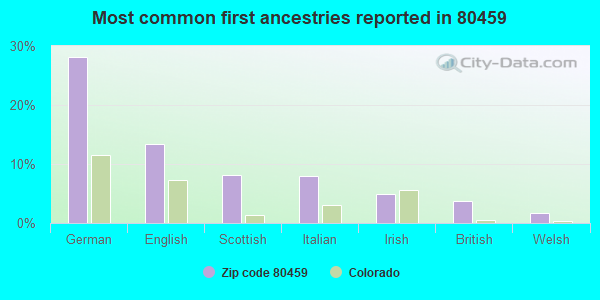
28%German
13%English
8%Scottish
8%Italian
5%Irish
4%British
2%Welsh
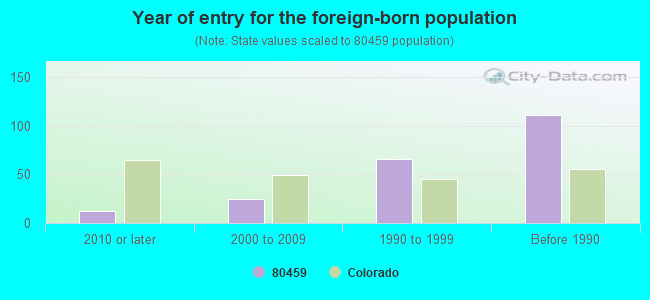
Year of entry for the foreign-born population
122010 or later
252000 to 2009
661990 to 1999
111Before 1990
Facilities with environmental interests located in this zip code:
GRAND ALTERNATIVE SCHOOL (1318 JACKSON AVENUE in KREMMLING, CO)
(National Center for Education Statistics) - STATE ID-3558 Organizations: WEST GRAND 1-JT. (SCHOOL DISTRICT)
CSU COOPERATIVE EXTENSION OFFICE GRAND COUNTY (UNKNOWN in KREMMLING, CO)
COMPLIANCE ACTIVITY (Tracking inspections of insecticide, fungicide, and rodenticide, and toxic substances) Alternative names: CSU COOP GRAND COUNTY
Housing units lacking complete plumbing facilities: 0.7% Housing units lacking complete kitchen facilities: 5.8%
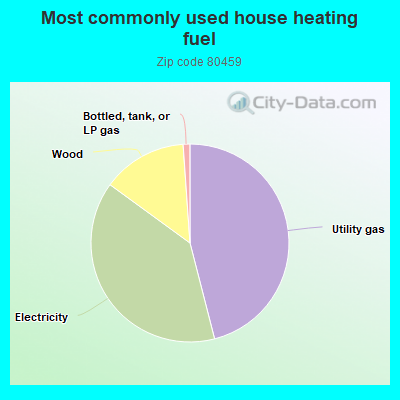
46.1%Utility gas
39.1%Electricity
13.9%Wood
1.1%Bottled, tank, or LP gas
Population in 1990: 1,580. Population change in the 1990s: +669 (+42.3%).
Place of birth for U.S.-born residents:
This state: 1,140
Northeast: 192
Midwest: 357
South: 411
West: 267
51% of the 80459 zip code residents lived in the same house 5 years ago. Out of people who lived in different houses, 37% lived in this county. Out of people who lived in different counties, 50% lived in Colorado.
91% of the 80459 zip code residents lived in the same house 1 year ago. Out of people who lived in different houses, 22% moved from this county. Out of people who lived in different houses, 17% moved from different county within same state. Out of people who lived in different houses, 64% moved from different state.
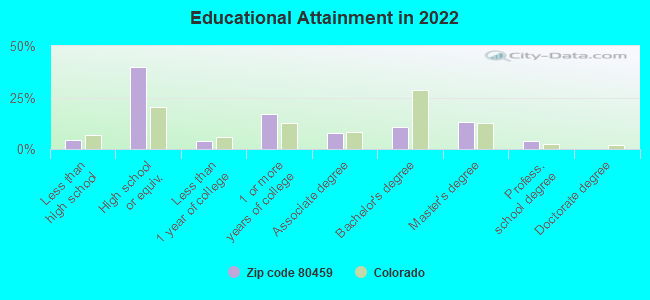
Private vs. public school enrollment:
Students in private schools in grades 1 to 8 (elementary and middle school): 56
Here:
17.5%
Colorado:
11.4%
Students in private schools in grades 9 to 12 (high school): 10
Here:
4.3%
Colorado:
8.5%
Students in private undergraduate colleges: 6
Here:
16.0%
Colorado:
14.0%
Occupation by median earnings in the past 12 months ($)
95,626Architecture and engineering occupations
73,986Installation, maintenance, and repair occupations
70,407Management occupations
69,772Health diagnosing and treating practitioners and other technical occupations
63,400Farming, fishing, and forestry occupations
52,143Production occupations
Companies with federal contracts located in this zip code:
GEORGE CULBREATH (BLUE RIVER RTE in KREMMLING, CO; small business) 4 employees, $250000 revenue. Woman Owned Business: $123,000 in 6 contractsfrom 1999 to 2001
Contracts for Lease or Rental of Facilities -- Office Buildings by Bureau of Land Management Signed by year:2000: $45,000; 2001: $6,000; 2002: $0; 2003: $0; 2004: $0; 2005: $0; 2006: $0.
Biggest contracts:
$59,000 with Bureau of Land Management for Lease or Rental of Facilities -- Office Buildings. Signed on 1999-10-15. Completion date: 1999-11-15.
$34,000, same as above.Signed on 2000-10-15. Completion date: 2001-11-15.
$13,000, same as above.Signed on 1999-11-15. Completion date: 2001-11-15.
$7,000, same as above.Signed on 2000-08-15. Completion date: 2001-11-15.
ALPINE SURVEYORS (490 GRAND COUNTY RD 101 in KREMMLING, CO; small business) 4 employees, $100000 revenue. : $107,188 in 3 contractsfrom 2003 to 2006
$50,560 with Forest Service for Other Architect and Engineering Services. Signed on 2003-08-15. Completion date: 2003-12-15.
$41,433 with Forest Service for Architect - Engineer Services (including landscaping, interior layout, and designing). Signed on 2006-02-28. Completion date: 2008-08-07.
$15,195, same as above.Signed on 2006-02-28. Completion date: 2008-08-07.
GALLAGHER, ELDO (613 CENTRAL AVE in KREMMLING, CO; small business)
$22,000 with Soil Conservation Service (disused code) for Lease or Rental of Facilities -- Office Buildings. Signed on 2002-09-15. Completion date: 2002-09-15.
Top industries in this zip code by the number of employees in 2005:
Health Care and Social Assistance: General Medical and Surgical Hospitals (100-249 employees: 1 establishment)
Construction: New Single-Family Housing Construction (except Operative Builders) (20-49: 1, 1-4: 3)
Accommodation and Food Services: Full-Service Restaurants (10-19: 2, 1-4: 3)
Construction: Site Preparation Contractors (10-19: 1, 5-9: 1, 1-4: 3)
Accommodation and Food Services: Hotels (except Casino Hotels) and Motels (10-19: 1, 5-9: 1, 1-4: 1)
Real Estate and Rental and Leasing: Lessors of Residential Buildings and Dwellings (10-19: 1, 1-4: 1)
Real Estate and Rental and Leasing: Video Tape and Disc Rental (5-9: 2, 1-4: 1)
People in group quarters in 2010:
3 people in hospitals with patients who have no usual home elsewhere
People in group quarters in 2000:
27 people in agriculture workers' dormitories on farms
22 people in other noninstitutional group quarters
12 people in unknown juvenile institutions
11 people in nursing homes
Fatal accident statistics in 2014:
Fatal accident count: 1
Vehicles involved in fatal accidents: 2
Fatal accidents caused by drunken drivers: 1
Fatalities: 1
Persons involved in fatal accidents: 2
Pedestrians involved in fatal accidents: 0
Fatal accident statistics in 2012:
Fatal accident count: 1
Vehicles involved in fatal accidents: 2
Fatal accidents caused by drunken drivers: 1
Fatalities: 2
Persons involved in fatal accidents: 6
Pedestrians involved in fatal accidents: 0
2002 - 2018 National Fire Incident Reporting System (NFIRS) incidents
Based on the data from the years 2002 - 2018 the average number of fire incidents per year is 15. The highest number of reported fires - 38 took place in 2018, and the least - 0 in 2003. The data has a rising trend.
When looking into fire subcategories, the most incidents belonged to: Outside Fires (56.2%), and Structure Fires (26.1%).
Fire incident types reported to NFIRS in Zip Code 80459


 Nearest zip codes: 80423, 80463, 80467, 80479, 80451, 81655.


 Based on the data from the years 2002 - 2018 the average number of fire incidents per year is 15. The highest number of reported fires - 38 took place in 2018, and the least - 0 in 2003. The data has a rising trend.
 When looking into fire subcategories, the most incidents belonged to: Outside Fires (56.2%), and Structure Fires (26.1%).