Estimated zip code population in 2022: 7,207 Zip code population in 2010: 624 Zip code population in 2000: 209
Houses and condos: 2,628 Renter-occupied apartments: 181
% of renters here:
7%
State:
34%
March 2022 cost of living index in zip code 80547: 94.6 (less than average, U.S. average is 100)
Land area: 3.0 sq. mi. Water area: 0.0 sq. mi.
Population density: 2,425 people per square mile
(low).
OSM Map
General Map
Google Map
MSN Map
OSM Map
General Map
Google Map
MSN Map
OSM Map
General Map
Google Map
MSN Map
OSM Map
General Map
Google Map
MSN Map
Please wait while loading the map...
Real estate property taxes paid for housing units in 2022:
This zip code:
0.6% ($4,868)
Colorado:
0.5% ($2,422)
Median real estate property taxes paid for housing units with mortgages in 2022: $4,838 (0.6%) Median real estate property taxes paid for housing units with no mortgage in 2022: $5,055 (0.6%)
Averages for the 2020 tax year for zip code 80547, filed in 2021:
Average Adjusted Gross Income (AGI) in 2020: $188,913 (Individual Income Tax Returns)
Here:
$188,913
State:
$89,260
Salary/wage: $139,617 (reported on 86.5% of returns)
Here:
$139,617
State:
$70,330
(% of AGI for various income ranges: 1078.8% for AGIs below $25k, 3699.6% for AGIs $25k-50k, 6531.0% for AGIs $50k-75k, 9503.9% for AGIs $75k-100k, 20091.8% for AGIs $100k-200k, 91751.1% for AGIs over 200k)
Taxable interest for individuals: $3,067 (reported on 48.4% of returns)
This zip code:
$3,067
Colorado:
$2,176
(% of AGI for various income ranges: 22.6% for AGIs below $25k, 52.1% for AGIs $25k-50k, 38.1% for AGIs $50k-75k, 115.7% for AGIs $75k-100k, 146.2% for AGIs $100k-200k, 1365.2% for AGIs over 200k)
Ordinary dividends: $9,518 (reported on 39.8% of returns)
Here:
$9,518
State:
$8,820
(% of AGI for various income ranges: 44.4% for AGIs below $25k, 76.1% for AGIs $25k-50k, 174.3% for AGIs $50k-75k, 257.4% for AGIs $75k-100k, 416.0% for AGIs $100k-200k, 3435.9% for AGIs over 200k)
Net capital gain/loss in AGI: +$37,148 (reported on 38.6% of returns)
Here:
+$37,148
State:
+$37,276
(% of AGI for various income ranges: 15.3% for AGIs below $25k, 50.4% for AGIs $25k-50k, 118.1% for AGIs $50k-75k, 258.3% for AGIs $75k-100k, 793.5% for AGIs $100k-200k, 16284.4% for AGIs over 200k)
Profit/loss from business: +$22,668 (reported on 20.5% of returns)
Here:
+$22,668
State:
+$15,295
(% of AGI for various income ranges: 72.1% for AGIs below $25k, 156.1% for AGIs $25k-50k, 413.3% for AGIs $50k-75k, 547.8% for AGIs $75k-100k, 619.7% for AGIs $100k-200k, 3518.9% for AGIs over 200k)
Taxable individual retirement arrangement distribution: $34,057 (reported on 10.7% of returns)
80547:
$34,057
Colorado:
$23,785
(% of AGI for various income ranges: 70.9% for AGIs below $25k, 170.0% for AGIs $25k-50k, 271.9% for AGIs $50k-75k, 395.2% for AGIs $75k-100k, 769.2% for AGIs $100k-200k, 2120.4% for AGIs over 200k)
Self-employed (Keogh) retirement plans: $24,450 (reported on 1.7% of returns)
80547:
$24,450
Colorado:
$23,633
(% of AGI for various income ranges: 543.3% for AGIs over 200k)
Total itemized deductions: $37,534 (reported on 29.7% of returns)
Here:
$37,534
State:
$35,141
(% of AGI for various income ranges: 337.5% for AGIs $25k-50k, 797.6% for AGIs $50k-75k, 900.9% for AGIs $75k-100k, 2091.7% for AGIs $100k-200k, 7932.6% for AGIs over 200k)
Charity contributions: $12,206 (reported on 24.5% of returns)
Here:
$12,206
State:
$12,103
(% of AGI for various income ranges: 17.9% for AGIs below $25k, 82.9% for AGIs $50k-75k, 100.4% for AGIs $75k-100k, 359.5% for AGIs $100k-200k, 2865.2% for AGIs over 200k)
Taxes paid: $9,144 (reported on 29.4% of returns)
80547:
$9,144
State:
$7,710
(% of AGI for various income ranges: 62.1% for AGIs $25k-50k, 171.9% for AGIs $50k-75k, 259.1% for AGIs $75k-100k, 605.0% for AGIs $100k-200k, 1691.1% for AGIs over 200k)
Earned income credit: $1,458 (reported on 3.5% of returns)
Here:
$1,458
State:
$2,053
(% of AGI for various income ranges: 24.4% for AGIs below $25k, 25.0% for AGIs $25k-50k)
Percentage of individuals using paid preparers for their 2020 taxes: 94.8%
Here:
95%
State:
93%
(% for various income ranges: 91.9% for AGIs below $25k, 94.4% for AGIs $25k-50k, 93.3% for AGIs $50k-75k, 97.0% for AGIs $75k-100k, 95.3% for AGIs $100k-200k, 96.2% for AGIs over 200k)
Averages for the 2012 tax year for zip code 80547, filed in 2013:
Average Adjusted Gross Income (AGI) in 2012: $153,666 (Individual Income Tax Returns)
Here:
$153,666
State:
$69,103
Salary/wage: $98,239 (reported on 88.8% of returns)
Here:
$98,239
State:
$54,794
(% of AGI for various income ranges: 73.3% for AGIs below $25k, 69.4% for AGIs $25k-50k, 79.1% for AGIs $50k-75k, 87.8% for AGIs $75k-100k, 82.9% for AGIs $100k-200k, 36.4% for AGIs over 200k)
Taxable interest for individuals: $4,995 (reported on 52.5% of returns)
This zip code:
$4,995
Colorado:
$1,971
(% of AGI for various income ranges: 1.6% for AGIs below $25k, 2.4% for AGIs $25k-50k, 0.4% for AGIs $50k-75k, 0.2% for AGIs $75k-100k, 1.5% for AGIs $100k-200k, 2.1% for AGIs over 200k)
Ordinary dividends: $11,765 (reported on 38.8% of returns)
Here:
$11,765
State:
$7,140
(% of AGI for various income ranges: 6.3% for AGIs below $25k, 2.7% for AGIs $25k-50k, 0.4% for AGIs $50k-75k, 0.5% for AGIs $75k-100k, 1.1% for AGIs $100k-200k, 4.4% for AGIs over 200k)
Net capital gain/loss in AGI: +$69,375 (reported on 30.0% of returns)
Here:
+$69,375
State:
+$23,009
(% of AGI for various income ranges: 1.7% for AGIs $100k-200k, 23.6% for AGIs over 200k)
Profit/loss from business: +$15,093 (reported on 18.8% of returns)
Here:
+$15,093
State:
+$13,514
(% of AGI for various income ranges: 14.2% for AGIs below $25k, 5.4% for AGIs $50k-75k, 2.4% for AGIs $100k-200k, 1.3% for AGIs over 200k)
Taxable individual retirement arrangement distribution: $22,789 (reported on 11.2% of returns)
80547:
$22,789
Colorado:
$17,927
(% of AGI for various income ranges: 10.2% for AGIs $25k-50k, 1.5% for AGIs $100k-200k, 1.8% for AGIs over 200k)
Total itemized deductions: $31,343 (15% of AGI, reported on 63.7% of returns)
Here:
$31,343
State:
$24,621
Here:
14.7% of AGI
State:
18.5% of AGI
(% of AGI for various income ranges: 14.6% for AGIs below $25k, 14.8% for AGIs $25k-50k, 15.5% for AGIs $50k-75k, 18.4% for AGIs $75k-100k, 17.2% for AGIs $100k-200k, 9.8% for AGIs over 200k)
Charity contributions: $5,331 (reported on 52.5% of returns)
Here:
$5,331
State:
$4,449
(% of AGI for various income ranges: 3.9% for AGIs below $25k, 1.8% for AGIs $50k-75k, 2.4% for AGIs $75k-100k, 1.9% for AGIs $100k-200k, 1.8% for AGIs over 200k)
Taxes paid: $12,269 (reported on 63.7% of returns)
80547:
$12,269
State:
$7,641
(% of AGI for various income ranges: 3.3% for AGIs below $25k, 3.4% for AGIs $25k-50k, 3.5% for AGIs $50k-75k, 4.9% for AGIs $75k-100k, 5.8% for AGIs $100k-200k, 5.1% for AGIs over 200k)
Earned income credit: $1,333 (reported on 3.8% of returns)
Here:
$1,333
State:
$2,095
(% of AGI for various income ranges: 2.3% for AGIs below $25k)
Percentage of individuals using paid preparers for their 2012 taxes: 56.2%
Here:
56%
State:
49%
(% for various income ranges: 50.0% for AGIs below $25k, 55.6% for AGIs $25k-50k, 50.0% for AGIs $50k-75k, 54.5% for AGIs $75k-100k, 54.2% for AGIs $100k-200k, 80.0% for AGIs over 200k)
Averages for the 2004 tax year for zip code 80547, filed in 2005:
Average Adjusted Gross Income (AGI) in 2004: $55,483 (Individual Income Tax Returns)
Here:
$55,483
State:
$55,014
Salary/wage: $38,097 (reported on 81.5% of returns)
Here:
$38,097
State:
$46,010
(% of AGI for various income ranges: 545.5% for AGIs below $10k, 71.1% for AGIs $10k-25k, 86.3% for AGIs $25k-50k, 78.4% for AGIs $50k-75k, 86.6% for AGIs $75k-100k, 23.6% for AGIs over 100k)
Taxable interest for individuals: $1,077 (reported on 43.8% of returns)
This zip code:
$1,077
Colorado:
$2,127
(% of AGI for various income ranges: 39.4% for AGIs below $10k, 0.4% for AGIs $10k-25k, 0.3% for AGIs $25k-50k, 0.6% for AGIs $50k-75k, 0.3% for AGIs $75k-100k, 1.1% for AGIs over 100k)
Taxable dividends: $810 (reported on 23.6% of returns)
Here:
$810
State:
$3,782
Net capital gain/loss: +$7,756 (reported on 23.0% of returns)
Here:
+$7,756
State:
+$17,882
Profit/loss from business: +$4,536 (reported on 15.7% of returns)
Here:
+$4,536
State:
+$11,247
Total itemized deductions: $16,477 (18% of AGI, reported on 36.5% of returns)
Here:
$16,477
State:
$20,560
Here:
18.4% of AGI
State:
21.4% of AGI
(% of AGI for various income ranges: 18.1% for AGIs $25k-50k, 15.9% for AGIs $50k-75k, 17.8% for AGIs $75k-100k, 6.4% for AGIs over 100k)
Charity contributions deductions: $3,196 (3% of AGI, reported on 28.7% of returns)
Here:
$3,196
State:
$3,518
Here:
3.3% of AGI
State:
3.4% of AGI
Total tax: $5,924 (reported on 81.5% of returns)
80547:
$5,924
State:
$9,173
(% of AGI for various income ranges: 21.2% for AGIs below $10k, 5.5% for AGIs $10k-25k, 7.3% for AGIs $25k-50k, 9.0% for AGIs $50k-75k, 11.0% for AGIs $75k-100k, 8.7% for AGIs over 100k)
Earned income credit: $600 (reported on 8.4% of returns)
Here:
$600
State:
$1,595
Percentage of individuals using paid preparers for their 2004 taxes: 55.6%
Here:
56%
State:
55%
(% for various income ranges: 60.0% for AGIs below $10k, 45.0% for AGIs $10k-25k, 56.1% for AGIs $25k-50k, 88.9% for AGIs $50k-75k, 71.4% for AGIs over 100k)
Likely homosexual households (counted as self-reported same-sex unmarried-partner households)
Lesbian couples: 0.3% of all households
Gay men: 0.0% of all households
Household received Food Stamps/SNAP in the past 12 months: 46 Household did not receive Food Stamps/SNAP in the past 12 months: 2,440
Women who had a birth in the past 12 months: 146 (150 now married, 0 unmarried) Women who did not have a birth in the past 12 months: 1,758 (1,175 now married, 571 unmarried)
Housing units in zip code 80547 with a mortgage: 1,929 (258 second mortgage, 18 home equity loan, 250 both second mortgage and home equity loan) Houses without a mortgage: 35
Median monthly owner costs for units with a mortgage: $2,528 Median monthly owner costs for units without a mortgage: $828
Residents with income below the poverty level in 2022:
This zip code:
3.9%
Whole state:
9.4%
Residents with income below 50% of the poverty level in 2022:
This zip code:
3.0%
Whole state:
4.6%
Median number of rooms in houses and condos:
Here:
7.8
State:
6.8
Median number of rooms in apartments:
Here:
3.8
State:
4.0
Notable locations in this zip code not listed on our city pages
Size of family households: 767 2-persons, 406 3-persons, 586 4-persons, 219 5-persons, 124 6-persons, 4 7-or-more-persons
Size of nonfamily households: 293 1-person, 48 2-persons
2,191 married couples with children.
101 single-parent households (71 men, 30 women).
96.1% of residents of 80547 zip code speak English at home.
0.5% of residents speak Spanish at home (73% very well, 11% not well, 16% not at all).
2.1% of residents speak other Indo-European language at home (100% very well).
0.4% of residents speak Asian or Pacific Island language at home (97% well, 3% not well).
0.6% of residents speak other language at home (100% very well).
Foreign born population: 240 (3.3%) (75.1% of them are naturalized citizens)
This zip code:
3.3%
Whole state:
9.5%
29%France
14%Bhutan
14%Uruguay
12%Georgia
9%United Kingdom, excluding England and Scotland
8%Germany
8%Sweden
28%English
18%German
17%American
8%Irish
4%Swedish
4%European
3%French
Year of entry for the foreign-born population
502010 or later
742000 to 2009
01990 to 1999
125Before 1990
Facilities with environmental interests located in this zip code:
ALPINE CABINET CO (4125 MAIN ST in TIMNATH, CO)
AIR MINOR (AIRS/AFS) CRITERIA AND HAZARDOUS AIR POLLUTANT INVENTORY (Inventory of air pollution sources) TRI REPORTER (Tracking of toxic chemicals releasing facilities) Business SIC classification: WOOD KITCHEN CABINETS Business NAICS classification: WOOD KITCHEN CABINET AND COUNTERTOP MANUFACTURING.
Housing units lacking complete kitchen facilities: 2.1%
87.5%Utility gas
11.6%Electricity
1.0%Bottled, tank, or LP gas
Place of birth for U.S.-born residents:
This state: 3,018
Northeast: 446
Midwest: 1,311
South: 491
West: 1,671
52% of the 80547 zip code residents lived in the same house 5 years ago. Out of people who lived in different houses, 48% lived in this county. Out of people who lived in different counties, 50% lived in Colorado.
95% of the 80547 zip code residents lived in the same house 1 year ago. Out of people who lived in different houses, 93% moved from this county. Out of people who lived in different houses, 12% moved from different state.
Private vs. public school enrollment:
Students in private schools in grades 1 to 8 (elementary and middle school): 78
Here:
7.3%
Colorado:
11.4%
Students in private schools in grades 9 to 12 (high school): 4
Here:
0.9%
Colorado:
8.5%
Students in private undergraduate colleges:
Here:
0.0%
Colorado:
14.0%
Occupation by median earnings in the past 12 months ($)
124,277Management occupations
119,565Transportation occupations
117,856Law enforcement workers including supervisors
111,638Business and financial operations occupations
97,783Installation, maintenance, and repair occupations
96,044Architecture and engineering occupations
Companies with federal contracts located in this zip code:
GRID CONSTRUCTION, INC (4319 DIXON ST in TIMNATH, CO; small business) : $84,000 in 2 contractsin 2000
$84,000 with Air Force for Maintenance, Repair or Alteration of Real Property -- Office Buildings. Taking place in WY. Signed on 2000-09-21. Completion date: 2000-09-21.
$0, same as above.Signed on 2000-09-21. Completion date: 2000-09-21.
Top industries in this zip code by the number of employees in 2005:
Accommodation and Food Services: Full-Service Restaurants (5-9 employees: 1 establishment)
Health Care and Social Assistance: Child Day Care Services (5-9: 1)
Construction: Structural Steel and Precast Concrete Contractors (5-9: 1)
Construction: Other Heavy and Civil Engineering Construction (1-4: 1)
Other Services (except Public Administration): Religious Organizations (1-4: 1)
Construction: New Single-Family Housing Construction (except Operative Builders) (1-4: 1)
Other Services (except Public Administration): Reupholstery and Furniture Repair (1-4: 1)
Fatal accident statistics in 2010:
Fatal accident count: 1
Vehicles involved in fatal accidents: 1
Fatal accidents caused by drunken drivers: 0
Fatalities: 1
Persons involved in fatal accidents: 2
Pedestrians involved in fatal accidents: 0
Home Mortgage Disclosure Act Aggregated Statistics For Year 2009 (Based on 2 partial tracts)
A) FHA, FSA/RHS & VA Home Purchase Loans
B) Conventional Home Purchase Loans
C) Refinancings
F) Non-occupant Loans on < 5 Family Dwellings (A B C & D)
Number
Average Value
Number
Average Value
Number
Average Value
Number
Average Value
LOANS ORIGINATED
2
$175,730
2
$238,990
9
$243,952
1
$101,710
APPLICATIONS APPROVED, NOT ACCEPTED
0
$0
0
$0
1
$198,920
0
$0
APPLICATIONS DENIED
0
$0
0
$0
2
$260,615
0
$0
APPLICATIONS WITHDRAWN
0
$0
0
$0
2
$196,110
0
$0
FILES CLOSED FOR INCOMPLETENESS
0
$0
0
$0
0
$0
0
$0
Aggregated Statistics For Year 2008 (Based on 2 partial tracts)
A) FHA, FSA/RHS & VA Home Purchase Loans
B) Conventional Home Purchase Loans
C) Refinancings
F) Non-occupant Loans on < 5 Family Dwellings (A B C & D)
Number
Average Value
Number
Average Value
Number
Average Value
Number
Average Value
LOANS ORIGINATED
1
$219,320
3
$229,260
4
$241,052
1
$115,440
APPLICATIONS APPROVED, NOT ACCEPTED
0
$0
0
$0
1
$146,070
0
$0
APPLICATIONS DENIED
0
$0
1
$137,350
2
$247,255
0
$0
APPLICATIONS WITHDRAWN
0
$0
0
$0
1
$223,950
0
$0
FILES CLOSED FOR INCOMPLETENESS
0
$0
0
$0
0
$0
0
$0
Aggregated Statistics For Year 2007 (Based on 2 partial tracts)
B) Conventional Home Purchase Loans
C) Refinancings
D) Home Improvement Loans
F) Non-occupant Loans on < 5 Family Dwellings (A B C & D)
Number
Average Value
Number
Average Value
Number
Average Value
Number
Average Value
LOANS ORIGINATED
6
$191,623
4
$234,435
1
$43,440
1
$194,590
APPLICATIONS APPROVED, NOT ACCEPTED
1
$118,020
1
$200,970
0
$0
0
$0
APPLICATIONS DENIED
1
$139,050
4
$177,105
1
$49,260
0
$0
APPLICATIONS WITHDRAWN
0
$0
1
$231,860
0
$0
0
$0
FILES CLOSED FOR INCOMPLETENESS
0
$0
0
$0
0
$0
0
$0
Aggregated Statistics For Year 2006 (Based on 2 partial tracts)
B) Conventional Home Purchase Loans
C) Refinancings
D) Home Improvement Loans
F) Non-occupant Loans on < 5 Family Dwellings (A B C & D)
Number
Average Value
Number
Average Value
Number
Average Value
Number
Average Value
LOANS ORIGINATED
7
$181,159
7
$203,574
1
$40,410
2
$147,025
APPLICATIONS APPROVED, NOT ACCEPTED
1
$113,890
1
$235,500
0
$0
0
$0
APPLICATIONS DENIED
1
$242,410
4
$253,048
1
$75,510
0
$0
APPLICATIONS WITHDRAWN
1
$173,200
2
$255,140
0
$0
0
$0
FILES CLOSED FOR INCOMPLETENESS
0
$0
0
$0
0
$0
0
$0
Aggregated Statistics For Year 2005 (Based on 2 partial tracts)
A) FHA, FSA/RHS & VA Home Purchase Loans
B) Conventional Home Purchase Loans
C) Refinancings
F) Non-occupant Loans on < 5 Family Dwellings (A B C & D)
Number
Average Value
Number
Average Value
Number
Average Value
Number
Average Value
LOANS ORIGINATED
1
$95,900
8
$178,938
6
$238,222
1
$221,400
APPLICATIONS APPROVED, NOT ACCEPTED
0
$0
1
$88,170
1
$233,870
0
$0
APPLICATIONS DENIED
0
$0
1
$225,490
4
$236,840
0
$0
APPLICATIONS WITHDRAWN
0
$0
2
$153,205
3
$201,283
0
$0
FILES CLOSED FOR INCOMPLETENESS
0
$0
0
$0
1
$172,890
0
$0
Aggregated Statistics For Year 2004 (Based on 2 partial tracts)
A) FHA, FSA/RHS & VA Home Purchase Loans
B) Conventional Home Purchase Loans
C) Refinancings
F) Non-occupant Loans on < 5 Family Dwellings (A B C & D)
Number
Average Value
Number
Average Value
Number
Average Value
Number
Average Value
LOANS ORIGINATED
1
$130,280
7
$182,056
7
$214,744
1
$177,870
APPLICATIONS APPROVED, NOT ACCEPTED
0
$0
1
$119,780
1
$225,430
0
$0
APPLICATIONS DENIED
0
$0
1
$214,750
3
$238,827
0
$0
APPLICATIONS WITHDRAWN
0
$0
1
$155,300
2
$251,575
0
$0
FILES CLOSED FOR INCOMPLETENESS
0
$0
0
$0
1
$147,630
0
$0
Aggregated Statistics For Year 2003 (Based on 2 partial tracts)
A) FHA, FSA/RHS & VA Home Purchase Loans
B) Conventional Home Purchase Loans
C) Refinancings
F) Non-occupant Loans on < 5 Family Dwellings (A B C & D)
Number
Average Value
Number
Average Value
Number
Average Value
Number
Average Value
LOANS ORIGINATED
1
$96,090
4
$224,062
15
$205,958
1
$133,520
APPLICATIONS APPROVED, NOT ACCEPTED
0
$0
0
$0
2
$155,845
0
$0
APPLICATIONS DENIED
0
$0
1
$121,030
4
$205,420
0
$0
APPLICATIONS WITHDRAWN
0
$0
1
$112,320
2
$228,285
0
$0
FILES CLOSED FOR INCOMPLETENESS
0
$0
0
$0
0
$0
0
$0
Aggregated Statistics For Year 2002 (Based on 2 partial tracts)
A) FHA, FSA/RHS & VA Home Purchase Loans
B) Conventional Home Purchase Loans
C) Refinancings
D) Home Improvement Loans
F) Non-occupant Loans on < 5 Family Dwellings (A B C & D)
Number
Average Value
Number
Average Value
Number
Average Value
Number
Average Value
Number
Average Value
LOANS ORIGINATED
1
$88,020
5
$182,810
11
$209,780
1
$15,020
1
$99,230
APPLICATIONS APPROVED, NOT ACCEPTED
0
$0
1
$106,920
1
$270,730
0
$0
0
$0
APPLICATIONS DENIED
0
$0
1
$127,840
3
$160,440
0
$0
0
$0
APPLICATIONS WITHDRAWN
0
$0
0
$0
2
$179,190
0
$0
0
$0
FILES CLOSED FOR INCOMPLETENESS
0
$0
0
$0
1
$153,660
0
$0
0
$0
Aggregated Statistics For Year 2001 (Based on 2 partial tracts)
A) FHA, FSA/RHS & VA Home Purchase Loans
B) Conventional Home Purchase Loans
C) Refinancings
D) Home Improvement Loans
F) Non-occupant Loans on < 5 Family Dwellings (A B C & D)
Number
Average Value
Number
Average Value
Number
Average Value
Number
Average Value
Number
Average Value
LOANS ORIGINATED
1
$112,470
5
$177,964
8
$184,854
1
$19,190
1
$81,170
APPLICATIONS APPROVED, NOT ACCEPTED
0
$0
1
$88,750
1
$122,790
0
$0
0
$0
APPLICATIONS DENIED
0
$0
1
$103,870
2
$171,615
0
$0
0
$0
APPLICATIONS WITHDRAWN
0
$0
1
$112,420
1
$248,960
0
$0
0
$0
FILES CLOSED FOR INCOMPLETENESS
0
$0
0
$0
0
$0
0
$0
0
$0
Aggregated Statistics For Year 2000 (Based on 2 partial tracts)
B) Conventional Home Purchase Loans
C) Refinancings
D) Home Improvement Loans
Number
Average Value
Number
Average Value
Number
Average Value
LOANS ORIGINATED
3
$182,863
2
$133,765
1
$19,130
APPLICATIONS APPROVED, NOT ACCEPTED
0
$0
0
$0
0
$0
APPLICATIONS DENIED
2
$63,030
1
$176,500
0
$0
APPLICATIONS WITHDRAWN
0
$0
1
$93,170
0
$0
FILES CLOSED FOR INCOMPLETENESS
0
$0
0
$0
0
$0
Aggregated Statistics For Year 1999 (Based on 1 partial tract)
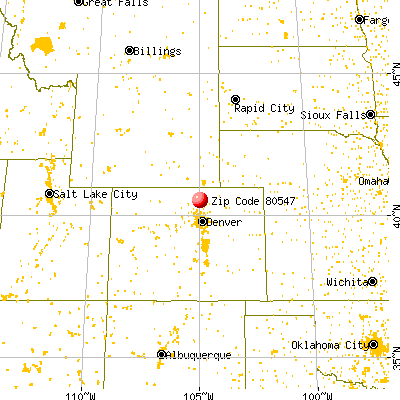


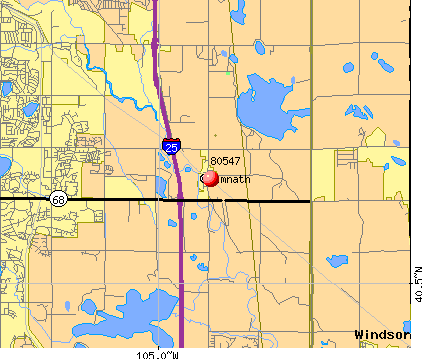 Nearest zip codes: 80528, 80525, 80550, 80538, 80546, 80524.


