Estimated zip code population in 2022: 35
Zip code population in 2010: 31
Zip code population in 2000: 68
March 2022 cost of living index in zip code 80862: 89.9
(less than average, U.S. average is 100)
Land area: 137.5
sq. mi.
Water area: 0.5
sq. mi.
| Population density: 0.255 people per square mile | | (very low). |
![Age and Sex of Residents in zip code 80862]()
- OSM Map
- General Map
- Google Map
- MSN Map
- OSM Map
- General Map
- Google Map
- MSN Map
- OSM Map
- General Map
- Google Map
- MSN Map
- OSM Map
- General Map
- Google Map
- MSN Map
Please wait while loading the map...
Business Search - 14 Million verified businesses
| Males: 21 |  (60.0%) (60.0%) |
| Females: 14 |  (40.0%) (40.0%) |
For population 25 years and over in 80862:
- High school or higher: 99.5%
- Bachelor's degree or higher: 21.2%
- Graduate or professional degree: 0.0%
- Mean travel time to work (commute): 67.8 minutes
For population 15 years and over in 80862:
- Never married: 17.6%
- Now married: 54.7%
- Separated: 0.0%
- Widowed: 27.7%
- Divorced: 0.0%
Zip code 80862 compared to state average:
- Median house value significantly below state average.
- Unemployed percentage significantly below state average.
- Black race population percentage significantly below state average.
- Hispanic race population percentage significantly below state average.
- Median age significantly above state average.
- Foreign-born population percentage significantly below state average.
- Renting percentage significantly below state average.
- Length of stay since moving in significantly above state average.
- Number of college students significantly below state average.
Data:
100%
rural population.
Estimated median house/condo value in 2022: $225,595
| 80862: | $225,595 |
| Colorado: | $531,100 |
Median resident age:| This zip code: | 63.3 years |
| Colorado median age: | 37.7 years |
Average household size:| This zip code: | 1.4 people |
| Colorado: | 2.4 people |
Averages for the 2004 tax year for zip code 80862, filed in 2005:
Average Adjusted Gross Income (AGI) in 2004: $19,000 (Individual Income Tax Returns)
| Here: | $19,000 |
| State: | $55,014 |
Salary/wage: $21,231 (reported on 52.0% of returns)
| Here: | $21,231 |
| State: | $46,010 |
Taxable interest for individuals: $909 (reported on 44.0% of returns)
| This zip code: | $909 |
| Colorado: | $2,127 |
Percentage of individuals using paid preparers for their 2004 taxes: 80.0%
Estimated median household income in 2022: | This zip code: | $67,539 |
| Colorado: | $89,302 |
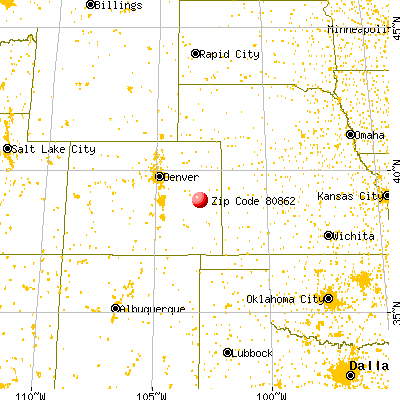
![80862 map]() Nearest zip codes: 80825
Nearest zip codes: 80825,
80821,
81045,
80823,
80834,
80804.
Percentage of family households:| This zip code: | 26.9% |
| Colorado: | 45.0% |
Percentage of households with unmarried partners:| This zip code: | 0.0% |
| Colorado: | 48.0% |
No gay or lesbian households reported
Household received Food Stamps/SNAP in the past 12 months: 3
Household did not receive Food Stamps/SNAP in the past 12 months: 22
Women who did not have a birth in the past 12 months: 1 (0 now married, 0 unmarried)
Residents with income below the poverty level in 2022:
| This zip code: | 13.7% |
| Whole state: | 9.4% |
| This zip code: | 13.7% |
| Whole state: | 4.6% |
Median number of rooms in houses and condos:

- Year house built (houses)
- 02020 or later
- 72010 to 2019
- 02000 to 2009
- 21990 to 1999
- 21980 to 1989
- 71970 to 1979
- 31960 to 1969
- 41950 to 1959
- 51940 to 1949
- 31939 or earlier
![Zip code 80862 satellite photo by USGS]()
- Bedrooms in owner-occupied houses and condos in 80862
- 0no bedroom
- 01 bedroom
- 02 bedrooms
- 143 bedrooms
- 104 bedrooms
- 25+ bedrooms
- Cars and other vehicles available in 80862 in owner-occupied houses/condos
- 0no vehicle
- 51 vehicle
- 62 vehicles
- 113 vehicles
- 04 vehicles
- 35+ vehicles
Zip code 80862 household income distribution in 2022
![Zip code 80862 household income distribution in 2022]()
- 4$10,000 to $14,999
- 3$25,000 to $29,999
- 3$30,000 to $34,999
- 5$60,000 to $74,999
- 2$75,000 to $99,999
- 6$100,000 to $124,999
- 1$200,000 or more
Estimate of home value of owner-occupied houses/condos in 2022 in zip code 80862
![Estimate of home value of owner-occupied houses/condos in 2022 in zip code 80862]()
- 3$15,000 to $19,999
- 1$20,000 to $24,999
- 2$80,000 to $89,999
- 4$175,000 to $199,999
- 1$200,000 to $249,999
- 4$250,000 to $299,999
- 3$500,000 to $749,999
- 1$2,000,000 or more
Estimated median house (or condo) value in 2022 for:
- White Non-Hispanic householders: $225,594
Estimated median house or condo value in 2022: $225,595
| 80862: | $225,595 |
| Colorado: | $531,100 |
Mean price in 2022:
Detached houses: $684,948| Here: | $684,948 |
| State: | $676,667 |
Housing units in structures:
- One, detached: 25
- Mobile homes: 6
Means of transportation to work in zip code 80862
![Means of transportation to work in zip code 80862]()
- 30.6%7Drove a car alone
- 78.8%18Worked at home
Travel time to work (commute) in zip code 80862
![Travel time to work (commute) in zip code 80862]()
- 25 to 9 minutes
- 115 to 19 minutes
- 220 to 24 minutes
Percentage of zip code residents living and working in this county: 104.5%
Household type by relationship:
Households: 35
- Male householders: 19 (11 living alone), Female householders: 7 (6 living alone)
10 spouses (10 opposite-sex spouses), 0 unmarried partners, (0 opposite-sex unmarried partners), 0 children (0 natural, 0 adopted, 0 stepchildren), 0 grandchildren, 0 brothers or sisters, 0 parents, 0 foster children, 0 other relatives, 0 non-relatives
Size of family households: 9 2-persons
Size of nonfamily households: 17 1-person
102.9% of residents of 80862 zip code speak English at home.
Foreign born population: 0 (0.0%)

- 50%German
- 25%American
- 12%European
- 8%Irish
![Zip code 80862 topographic map]()
Facilities with environmental interests located in this zip code:
- ANADARKO E&P CO. - CHRISTOPHER #5 41-1 (NE NE SEC 1 T12S R51W in FLAGLER, 17.2 MI S OF, CO)

CRITERIA AND HAZARDOUS AIR POLLUTANT INVENTORY (Inventory of air pollution sources)
Business SIC classification: CRUDE PETROLEUM AND NATURAL GAS

- 87.9%Bottled, tank, or LP gas
- 8.4%Electricity
- 8.4%Wood
Place of birth for U.S.-born residents:
- This state: 19
- Midwest: 3
- South: 2
- West: 11
84% of the 80862 zip code residents lived in the same house 5 years ago.
Out of people who lived in different houses, 38% lived in this county.
94% of the 80862 zip code residents lived in the same house 1 year ago.
Out of people who lived in different houses, 100% moved from different state.
Fatal accident statistics in 2013:
- Fatal accident count: 2
- Vehicles involved in fatal accidents: 3
- Fatal accidents caused by drunken drivers: 1
- Fatalities: 2
- Persons involved in fatal accidents: 3
- Pedestrians involved in fatal accidents: 1
Fatal accident statistics in 2012:
- Fatal accident count: 1
- Vehicles involved in fatal accidents: 2
- Fatal accidents caused by drunken drivers: 0
- Fatalities: 1
- Persons involved in fatal accidents: 3
- Pedestrians involved in fatal accidents: 0


 Nearest zip codes: 80825, 80821, 81045, 80823, 80834, 80804.


