Estimated zip code population in 2022: 3,317 Zip code population in 2010: 3,231 Zip code population in 2000: 3,437
Houses and condos: 1,797 Renter-occupied apartments: 272
% of renters here:
18%
State:
34%
March 2022 cost of living index in zip code 81132: 91.3 (less than average, U.S. average is 100)
Land area: 676.3 sq. mi. Water area: 0.1 sq. mi.
Population density: 5 people per square mile
(very low).
OSM Map
General Map
Google Map
MSN Map
OSM Map
General Map
Google Map
MSN Map
OSM Map
General Map
Google Map
MSN Map
OSM Map
General Map
Google Map
MSN Map
Please wait while loading the map...
Real estate property taxes paid for housing units in 2022:
This zip code:
0.3% ($563)
Colorado:
0.5% ($2,422)
Median real estate property taxes paid for housing units with mortgages in 2022: $617 (0.3%) Median real estate property taxes paid for housing units with no mortgage in 2022: $501 (0.4%)
Business Search- 14 Million verified businesses
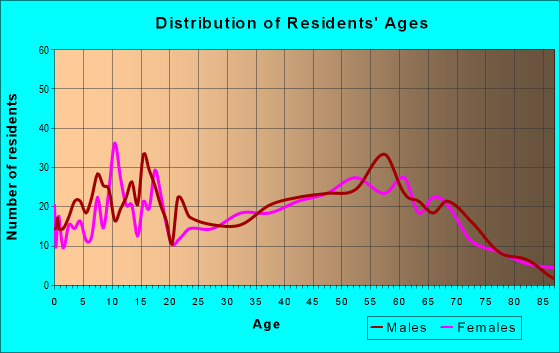
Males: 1,806
(54.5%)
Females: 1,510
(45.5%)
For population 25 years and over in 81132:
High school or higher: 88.1%
Bachelor's degree or higher: 27.5%
Graduate or professional degree: 8.2%
Unemployed: 3.6%
Mean travel time to work (commute): 23.6 minutes
For population 15 years and over in 81132:
Never married: 19.3%
Now married: 52.7%
Separated: 3.3%
Widowed: 6.7%
Divorced: 18.0%
Zip code 81132 compared to state average:
Median household income below state average.
Median house value significantly below state average.
Black race population percentage significantly below state average.
Median age above state average.
Foreign-born population percentage significantly below state average.
Renting percentage below state average.
Length of stay since moving in significantly above state average.
House age above state average.
Percentage of population with a bachelor's degree or higher below state average.
Averages for the 2020 tax year for zip code 81132, filed in 2021:
Average Adjusted Gross Income (AGI) in 2020: $53,388 (Individual Income Tax Returns)
Here:
$53,388
State:
$89,260
Salary/wage: $43,231 (reported on 78.3% of returns)
Here:
$43,231
State:
$70,330
(% of AGI for various income ranges: 1199.7% for AGIs below $25k, 3686.7% for AGIs $25k-50k, 6687.1% for AGIs $50k-75k, 10418.8% for AGIs $75k-100k, 23688.3% for AGIs $100k-200k)
Taxable interest for individuals: $1,206 (reported on 37.0% of returns)
This zip code:
$1,206
Colorado:
$2,176
(% of AGI for various income ranges: 43.2% for AGIs below $25k, 31.3% for AGIs $25k-50k, 31.4% for AGIs $50k-75k, 53.8% for AGIs $75k-100k, 240.0% for AGIs $100k-200k)
Ordinary dividends: $3,482 (reported on 15.9% of returns)
Here:
$3,482
State:
$8,820
(% of AGI for various income ranges: 44.5% for AGIs below $25k, 47.3% for AGIs $25k-50k, 133.6% for AGIs $50k-75k, 87.5% for AGIs $75k-100k, 381.7% for AGIs $100k-200k)
Net capital gain/loss in AGI: +$40,417 (reported on 16.7% of returns)
Here:
+$40,417
State:
+$37,276
(% of AGI for various income ranges: 19.0% for AGIs below $25k, 39.3% for AGIs $25k-50k, 270.0% for AGIs $50k-75k, 290.0% for AGIs $75k-100k, 1031.7% for AGIs $100k-200k)
Profit/loss from business: +$8,478 (reported on 19.6% of returns)
Here:
+$8,478
State:
+$15,295
(% of AGI for various income ranges: 114.8% for AGIs below $25k, 268.7% for AGIs $25k-50k, 329.3% for AGIs $50k-75k, 287.5% for AGIs $75k-100k, 726.7% for AGIs $100k-200k)
Taxable individual retirement arrangement distribution: $15,315 (reported on 9.4% of returns)
81132:
$15,315
Colorado:
$23,785
(% of AGI for various income ranges: 67.1% for AGIs below $25k, 104.3% for AGIs $25k-50k, 393.6% for AGIs $50k-75k, 1531.7% for AGIs $100k-200k)
Total itemized deductions: $36,450 (reported on 2.9% of returns)
Here:
$36,450
State:
$35,141
(% of AGI for various income ranges: 2430.0% for AGIs $100k-200k)
Charity contributions: $20,133 (reported on 2.2% of returns)
Here:
$20,133
State:
$12,103
(% of AGI for various income ranges: 1006.7% for AGIs $100k-200k)
Taxes paid: $5,875 (reported on 2.9% of returns)
81132:
$5,875
State:
$7,710
(% of AGI for various income ranges: 391.7% for AGIs $100k-200k)
Earned income credit: $2,176 (reported on 15.2% of returns)
Here:
$2,176
State:
$2,053
(% of AGI for various income ranges: 73.2% for AGIs below $25k, 76.7% for AGIs $25k-50k)
Percentage of individuals using paid preparers for their 2020 taxes: 85.5%
Here:
86%
State:
93%
(% for various income ranges: 83.3% for AGIs below $25k, 85.4% for AGIs $25k-50k, 85.7% for AGIs $50k-75k, 84.6% for AGIs $75k-100k, 91.7% for AGIs $100k-200k, 100.0% for AGIs over 200k)
Averages for the 2012 tax year for zip code 81132, filed in 2013:
Average Adjusted Gross Income (AGI) in 2012: $38,290 (Individual Income Tax Returns)
Here:
$38,290
State:
$69,103
Salary/wage: $32,497 (reported on 81.6% of returns)
Here:
$32,497
State:
$54,794
(% of AGI for various income ranges: 72.9% for AGIs below $25k, 74.8% for AGIs $25k-50k, 72.4% for AGIs $50k-75k, 72.0% for AGIs $75k-100k, 57.4% for AGIs $100k-200k)
Taxable interest for individuals: $907 (reported on 33.6% of returns)
This zip code:
$907
Colorado:
$1,971
(% of AGI for various income ranges: 0.9% for AGIs below $25k, 0.9% for AGIs $25k-50k, 0.5% for AGIs $50k-75k, 0.2% for AGIs $75k-100k, 1.2% for AGIs $100k-200k)
Ordinary dividends: $3,241 (reported on 13.6% of returns)
Here:
$3,241
State:
$7,140
(% of AGI for various income ranges: 1.4% for AGIs below $25k, 1.2% for AGIs $25k-50k, 1.6% for AGIs $50k-75k, 1.1% for AGIs $100k-200k)
Net capital gain/loss in AGI: +$5,425 (reported on 12.8% of returns)
Here:
+$5,425
State:
+$23,009
(% of AGI for various income ranges: 0.1% for AGIs below $25k, 0.6% for AGIs $25k-50k, 2.1% for AGIs $50k-75k, 4.7% for AGIs $100k-200k)
Profit/loss from business: +$7,067 (reported on 19.2% of returns)
Here:
+$7,067
State:
+$13,514
(% of AGI for various income ranges: 7.6% for AGIs below $25k, 5.0% for AGIs $25k-50k, 2.4% for AGIs $50k-75k, 4.9% for AGIs $75k-100k)
Taxable individual retirement arrangement distribution: $10,427 (reported on 8.8% of returns)
81132:
$10,427
Colorado:
$17,927
(% of AGI for various income ranges: 3.1% for AGIs below $25k, 3.0% for AGIs $25k-50k, 2.2% for AGIs $50k-75k, 5.3% for AGIs $75k-100k)
Total itemized deductions: $19,795 (27% of AGI, reported on 17.6% of returns)
Here:
$19,795
State:
$24,621
Here:
26.7% of AGI
State:
18.5% of AGI
(% of AGI for various income ranges: 7.7% for AGIs below $25k, 7.7% for AGIs $25k-50k, 9.8% for AGIs $50k-75k, 10.1% for AGIs $75k-100k, 10.1% for AGIs $100k-200k)
Charity contributions: $4,667 (reported on 12.0% of returns)
Here:
$4,667
State:
$4,449
(% of AGI for various income ranges: 1.1% for AGIs $25k-50k, 1.0% for AGIs $50k-75k, 1.1% for AGIs $75k-100k, 3.4% for AGIs $100k-200k)
Taxes paid: $3,819 (reported on 16.8% of returns)
81132:
$3,819
State:
$7,641
(% of AGI for various income ranges: 0.8% for AGIs below $25k, 1.1% for AGIs $25k-50k, 1.6% for AGIs $50k-75k, 1.7% for AGIs $75k-100k, 2.8% for AGIs $100k-200k)
Earned income credit: $2,100 (reported on 25.6% of returns)
Here:
$2,100
State:
$2,095
(% of AGI for various income ranges: 7.2% for AGIs below $25k, 1.4% for AGIs $25k-50k)
Percentage of individuals using paid preparers for their 2012 taxes: 47.2%
Here:
47%
State:
49%
(% for various income ranges: 40.7% for AGIs below $25k, 48.5% for AGIs $25k-50k, 52.9% for AGIs $50k-75k, 50.0% for AGIs $75k-100k, 75.0% for AGIs $100k-200k)
Averages for the 2004 tax year for zip code 81132, filed in 2005:
Average Adjusted Gross Income (AGI) in 2004: $27,842 (Individual Income Tax Returns)
Here:
$27,842
State:
$55,014
Salary/wage: $25,909 (reported on 80.9% of returns)
Here:
$25,909
State:
$46,010
(% of AGI for various income ranges: 189.5% for AGIs below $10k, 78.4% for AGIs $10k-25k, 78.5% for AGIs $25k-50k, 69.6% for AGIs $50k-75k, 78.2% for AGIs $75k-100k, 55.8% for AGIs over 100k)
Taxable interest for individuals: $1,285 (reported on 45.1% of returns)
This zip code:
$1,285
Colorado:
$2,127
(% of AGI for various income ranges: 11.7% for AGIs below $10k, 2.0% for AGIs $10k-25k, 1.2% for AGIs $25k-50k, 2.5% for AGIs $50k-75k, 1.0% for AGIs $75k-100k, 2.8% for AGIs over 100k)
Taxable dividends: $2,592 (reported on 16.2% of returns)
Here:
$2,592
State:
$3,782
(% of AGI for various income ranges: 5.4% for AGIs below $10k, 0.6% for AGIs $10k-25k, 1.1% for AGIs $25k-50k, 2.0% for AGIs $50k-75k, 1.2% for AGIs $75k-100k, 2.5% for AGIs over 100k)
Net capital gain/loss: +$5,964 (reported on 15.0% of returns)
Here:
+$5,964
State:
+$17,882
(% of AGI for various income ranges: 1.2% for AGIs below $10k, 0.4% for AGIs $10k-25k, 1.9% for AGIs $25k-50k, 2.9% for AGIs $50k-75k, 0.1% for AGIs $75k-100k, 11.7% for AGIs over 100k)
Profit/loss from business: +$4,987 (reported on 23.0% of returns)
Here:
+$4,987
State:
+$11,247
(% of AGI for various income ranges: 19.0% for AGIs below $10k, 7.6% for AGIs $10k-25k, 3.9% for AGIs $25k-50k, 4.4% for AGIs $50k-75k, 0.8% for AGIs $75k-100k)
IRA payment deduction: $3,029 (reported on 2.7% of returns)
81132:
$3,029
Colorado:
$2,947
Total itemized deductions: $16,257 (28% of AGI, reported on 17.2% of returns)
Here:
$16,257
State:
$20,560
Here:
27.8% of AGI
State:
21.4% of AGI
(% of AGI for various income ranges: 18.1% for AGIs below $10k, 6.1% for AGIs $10k-25k, 8.4% for AGIs $25k-50k, 12.0% for AGIs $50k-75k, 12.8% for AGIs $75k-100k, 12.3% for AGIs over 100k)
Charity contributions deductions: $3,439 (6% of AGI, reported on 13.0% of returns)
Here:
$3,439
State:
$3,518
Here:
5.5% of AGI
State:
3.4% of AGI
(% of AGI for various income ranges: 0.9% for AGIs $10k-25k, 1.2% for AGIs $25k-50k, 1.4% for AGIs $50k-75k, 1.7% for AGIs $75k-100k, 3.7% for AGIs over 100k)
Total tax: $3,404 (reported on 66.6% of returns)
81132:
$3,404
State:
$9,173
(% of AGI for various income ranges: 7.6% for AGIs below $10k, 4.3% for AGIs $10k-25k, 6.3% for AGIs $25k-50k, 8.6% for AGIs $50k-75k, 9.8% for AGIs $75k-100k, 14.8% for AGIs over 100k)
Earned income credit: $1,761 (reported on 26.4% of returns)
Here:
$1,761
State:
$1,595
Percentage of individuals using paid preparers for their 2004 taxes: 58.0%
Here:
58%
State:
55%
(% for various income ranges: 52.7% for AGIs below $10k, 58.6% for AGIs $10k-25k, 57.5% for AGIs $25k-50k, 61.6% for AGIs $50k-75k, 74.4% for AGIs $75k-100k, 75.0% for AGIs over 100k)
Household received Food Stamps/SNAP in the past 12 months: 245 Household did not receive Food Stamps/SNAP in the past 12 months: 1,307
Women who had a birth in the past 12 months: 61 (46 now married, 14 unmarried) Women who did not have a birth in the past 12 months: 468 (256 now married, 210 unmarried)
Housing units in zip code 81132 with a mortgage: 632 (13 second mortgage, 4 home equity loan, 7 both second mortgage and home equity loan) Houses without a mortgage: 5
Median monthly owner costs for units with a mortgage: $1,117 Median monthly owner costs for units without a mortgage: $325
Residents with income below the poverty level in 2022:
This zip code:
10.6%
Whole state:
9.4%
Residents with income below 50% of the poverty level in 2022:
This zip code:
4.9%
Whole state:
4.6%
Median number of rooms in houses and condos:
Here:
5.5
State:
6.8
Median number of rooms in apartments:
Here:
4.7
State:
4.0
Notable locations in this zip code not listed on our city pages
Notable locations in zip code 81132: La Garita Corral (A), Camp Val Verde (B), Rock Creek Campground (C), Comstock Campground (D), Fitton Guard Station (E), La Garita Cow Camp (F), Fremonts Camp (G), Lost Treasure Diggings (H), Embargo (I), Hutchison Corral (J), Elwood Guard Station (K), Cathedral Campground (L), La Garita Cow Camp (M), Poso Campground (N), Storm King Campground (O), Carnero Guard Station (P), Dry Creek Corral (Q), Del Norte Community Ambulance (R), Del Norte Emergency Medical Services (S), Del Norte Police Department (T). Display/hide their locations on the map
Churches in zip code 81132 include: Church of Jesus Christ of Latter - day Saints (A), Pioneer United Church (B), New Life Fellowship (C), Gateway Baptist Church (D), Del Norte Baptist Fellowship (E), Catholic Church (F), Saint John Church (G). Display/hide their locations on the map
Lakes and reservoirs: San Francisco Lakes (A), Beaver Park Reservoir (B), Poage Reservoir (C), Paradise Reservoir (D), Fuchs Reservoir (E). Display/hide their locations on the map
Streams, rivers, and creeks: Willow Creek (A), North Fork Cat Creek (B), South Fork Cat Creek (C), Spring Creek (D), Fern Creek (E), Burnt Creek (F), Wightman Fork (G), Toll Gate Creek (H), Jasper Creek (I). Display/hide their locations on the map
In group quarters: 93 (-1 institutionalized population)
Size of family households: 349 2-persons, 151 3-persons, 113 4-persons, 114 5-persons, 33 6-persons
Size of nonfamily households: 696 1-person, 77 2-persons, 3 3-persons
564 married couples with children.
65 single-parent households (31 men, 34 women).
85.0% of residents of 81132 zip code speak English at home.
15.3% of residents speak Spanish at home (83% very well, 16% well, 2% not well).
0.1% of residents speak other Indo-European language at home (100% very well).
0.2% of residents speak Asian or Pacific Island language at home (100% very well).
0.1% of residents speak other language at home (100% very well).
Foreign born population: 23 (0.7%) (18.0% of them are naturalized citizens)
This zip code:
0.7%
Whole state:
9.5%
91%Honduras
9%France
21%German
9%American
6%English
2%European
2%Scottish
2%Norwegian
2%Scotch-Irish
Year of entry for the foreign-born population
02010 or later
62000 to 2009
151990 to 1999
18Before 1990
Facilities with environmental interests located in this zip code:
AIR MINOR (AIRS/AFS) SUPERFUND NPL (Superfund database) (Integrated Compliance Information System) - ICIS-08-1998-0015, FORMAL ENFORCEMENT ACTION, ICIS-08-1998-0016, ICIS-08-1998-0088, ICIS-08-1996-0126, ICIS-08-1996-0135, ICIS-08-1993-0142, ICIS-08-1993-0143, CRITERIA AND HAZARDOUS AIR POLLUTANT INVENTORY (Inventory of air pollution sources) Business SIC classification: GOLD ORES Business NAICS classification: GOLD ORE MINING. Alternative names: SUMMITVILLE CONSOLIDATED MINE, SUMMITVILLE MINE
BILL KEELING OIL CO INC (475 GRAND in DEL NORTE, CO)
AIR MINOR (AIRS/AFS) CRITERIA AND HAZARDOUS AIR POLLUTANT INVENTORY (Inventory of air pollution sources) Business SIC classification: GASOLINE SERVICE STATIONS
CRYSTAL HILL MINE (BIEDELL CREEK RD in DEL NORTE, CO)
Housing units lacking complete plumbing facilities: 5.8% Housing units lacking complete kitchen facilities: 3.8%
37.5%Utility gas
24.4%Bottled, tank, or LP gas
21.2%Wood
7.4%Electricity
4.4%Solar energy
4.2%Other fuel
1.0%Fuel oil, kerosene, etc.
Population in 1990: 2,791. Population change in the 1990s: +646 (+23.1%).
Place of birth for U.S.-born residents:
This state: 2,215
Northeast: 87
Midwest: 262
South: 311
West: 391
62% of the 81132 zip code residents lived in the same house 5 years ago. Out of people who lived in different houses, 46% lived in this county. Out of people who lived in different counties, 50% lived in Colorado.
91% of the 81132 zip code residents lived in the same house 1 year ago. Out of people who lived in different houses, 33% moved from this county. Out of people who lived in different houses, 57% moved from different county within same state. Out of people who lived in different houses, 9% moved from different state. Out of people who lived in different houses, 7% moved from abroad.
Private vs. public school enrollment:
Students in private schools in grades 1 to 8 (elementary and middle school): 21
Here:
6.5%
Colorado:
11.4%
Students in private schools in grades 9 to 12 (high school):
Here:
0.0%
Colorado:
8.5%
Students in private undergraduate colleges:
Here:
0.0%
Colorado:
14.0%
Occupation by median earnings in the past 12 months ($)
88,666Sales and related occupations
83,573Transportation occupations
80,498Health diagnosing and treating practitioners and other technical occupations
74,272Farming, fishing, and forestry occupations
72,057Arts, design, entertainment, sports, and media occupations
71,137Life, physical, and social science occupations
Top industries in this zip code by the number of employees in 2005:
Health Care and Social Assistance: Specialty (except Psychiatric and Substance Abuse) Hospitals (100-249 employees: 1 establishment)
Health Care and Social Assistance: Nursing Care Facilities (50-99: 1, 1-4: 1)
Administrative and Support and Waste Management and Remediation Services: Janitorial Services (20-49: 1)
Wholesale Trade: Fresh Fruit and Vegetable Merchant Wholesalers (20-49: 1)
Health Care and Social Assistance: Ambulance Services (10-19: 1)
Accommodation and Food Services: Limited-Service Restaurants (10-19: 1)
43 people in nursing facilities/skilled-nursing facilities
31 people in local jails and other municipal confinement facilities
10 people in other noninstitutional facilities
2 people in emergency and transitional shelters (with sleeping facilities) for people experiencing homelessness
People in group quarters in 2000:
29 people in nursing homes
17 people in local jails and other confinement facilities (including police lockups)
9 people in wards in general hospitals for patients who have no usual home elsewhere
Fatal accident statistics in 2013:
Fatal accident count: 1
Vehicles involved in fatal accidents: 2
Fatal accidents caused by drunken drivers: 0
Fatalities: 3
Persons involved in fatal accidents: 4
Pedestrians involved in fatal accidents: 0
Fatal accident statistics in 2010:
Fatal accident count: 1
Vehicles involved in fatal accidents: 1
Fatal accidents caused by drunken drivers: 0
Fatalities: 1
Persons involved in fatal accidents: 1
Pedestrians involved in fatal accidents: 0
2006 - 2013 National Fire Incident Reporting System (NFIRS) incidents
According to the data from the years 2006 - 2013 the average number of fires per year is 15. The highest number of reported fires - 40 took place in 2010, and the least - 0 in 2008. The data has a declining trend.
When looking into fire subcategories, the most incidents belonged to: Outside Fires (57.7%), and Structure Fires (30.9%).
Fire incident types reported to NFIRS in Zip Code 81132
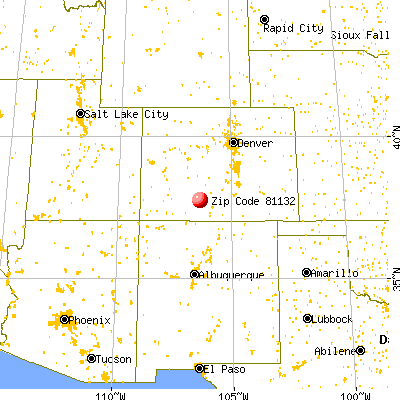


 Nearest zip codes: 81154, 81144, 81125, 81149, 81124, 81120.


 According to the data from the years 2006 - 2013 the average number of fires per year is 15. The highest number of reported fires - 40 took place in 2010, and the least - 0 in 2008. The data has a declining trend.
 When looking into fire subcategories, the most incidents belonged to: Outside Fires (57.7%), and Structure Fires (30.9%).