Estimated zip code population in 2022: 1,122 Zip code population in 2010: 840 Zip code population in 2000: 806
Houses and condos: 736 Renter-occupied apartments: 100
% of renters here:
21%
State:
34%
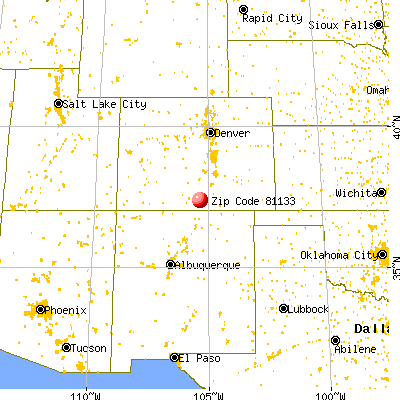
March 2022 cost of living index in zip code 81133: 93.7 (less than average, U.S. average is 100)
Land area: 372.9 sq. mi. Water area: 0.3 sq. mi.
Population density: 3 people per square mile
(very low).
OSM Map
General Map
Google Map
MSN Map
OSM Map
General Map
Google Map
MSN Map
OSM Map
General Map
Google Map
MSN Map
OSM Map
General Map
Google Map
MSN Map
Please wait while loading the map...
Real estate property taxes paid for housing units in 2022:
This zip code:
0.3% ($729)
Colorado:
0.5% ($2,422)
Median real estate property taxes paid for housing units with mortgages in 2022: $865 (0.3%) Median real estate property taxes paid for housing units with no mortgage in 2022: $642 (0.3%)
Averages for the 2020 tax year for zip code 81133, filed in 2021:
Average Adjusted Gross Income (AGI) in 2020: $46,814 (Individual Income Tax Returns)
Here:
$46,814
State:
$89,260
Salary/wage: $35,781 (reported on 73.5% of returns)
Here:
$35,781
State:
$70,330
(% of AGI for various income ranges: 724.3% for AGIs below $25k, 3234.5% for AGIs $25k-50k, 6420.0% for AGIs $50k-75k, 8350.0% for AGIs $75k-100k, 13570.0% for AGIs $100k-200k)
Taxable interest for individuals: $306 (reported on 32.7% of returns)
This zip code:
$306
Colorado:
$2,176
(% of AGI for various income ranges: 11.4% for AGIs below $25k, 14.5% for AGIs $25k-50k, 20.0% for AGIs $50k-75k, 30.0% for AGIs $100k-200k)
Ordinary dividends: $957 (reported on 14.3% of returns)
Here:
$957
State:
$8,820
(% of AGI for various income ranges: 30.0% for AGIs below $25k, 7.5% for AGIs $50k-75k, 73.3% for AGIs $100k-200k)
Net capital gain/loss in AGI: +$7,867 (reported on 12.2% of returns)
Here:
+$7,867
State:
+$37,276
(% of AGI for various income ranges: 12.7% for AGIs $25k-50k, 1526.7% for AGIs $100k-200k)
Profit/loss from business: +$12,220 (reported on 20.4% of returns)
Here:
+$12,220
State:
+$15,295
(% of AGI for various income ranges: 207.1% for AGIs below $25k, 192.7% for AGIs $25k-50k, 1800.0% for AGIs $50k-75k)
Taxable individual retirement arrangement distribution: $23,100 (reported on 10.2% of returns)
81133:
$23,100
Colorado:
$23,785
(% of AGI for various income ranges: 156.4% for AGIs below $25k, 2340.0% for AGIs $50k-75k)
Earned income credit: $1,975 (reported on 24.5% of returns)
Here:
$1,975
State:
$2,053
(% of AGI for various income ranges: 95.7% for AGIs below $25k, 93.6% for AGIs $25k-50k)
Percentage of individuals using paid preparers for their 2020 taxes: 91.8%
Here:
92%
State:
93%
(% for various income ranges: 89.5% for AGIs below $25k, 92.9% for AGIs $25k-50k, 85.7% for AGIs $50k-75k, 100.0% for AGIs $75k-100k, 100.0% for AGIs $100k-200k)
Averages for the 2012 tax year for zip code 81133, filed in 2013:
Average Adjusted Gross Income (AGI) in 2012: $42,956 (Individual Income Tax Returns)
Here:
$42,956
State:
$69,103
Salary/wage: $33,674 (reported on 72.1% of returns)
Here:
$33,674
State:
$54,794
(% of AGI for various income ranges: 62.0% for AGIs below $25k, 65.0% for AGIs $25k-50k, 48.0% for AGIs $50k-75k, 55.4% for AGIs $75k-100k, 55.9% for AGIs $100k-200k)
Taxable interest for individuals: $373 (reported on 34.9% of returns)
This zip code:
$373
Colorado:
$1,971
(% of AGI for various income ranges: 0.8% for AGIs below $25k, 0.6% for AGIs $50k-75k, 0.1% for AGIs $100k-200k)
Ordinary dividends: $2,614 (reported on 16.3% of returns)
Here:
$2,614
State:
$7,140
(% of AGI for various income ranges: 0.5% for AGIs below $25k, 2.8% for AGIs $25k-50k, 1.3% for AGIs $100k-200k)
Net capital gain/loss in AGI: +$580 (reported on 11.6% of returns)
Here:
+$580
State:
+$23,009
Profit/loss from business: +$2,783 (reported on 14.0% of returns)
Here:
+$2,783
State:
+$13,514
Taxable individual retirement arrangement distribution: $21,083 (reported on 14.0% of returns)
81133:
$21,083
Colorado:
$17,927
Total itemized deductions: $22,429 (22% of AGI, reported on 16.3% of returns)
Here:
$22,429
State:
$24,621
Here:
22.4% of AGI
State:
18.5% of AGI
(% of AGI for various income ranges: 17.8% for AGIs below $25k, 11.6% for AGIs $50k-75k, 10.8% for AGIs $100k-200k)
Charity contributions: $2,680 (reported on 11.6% of returns)
Here:
$2,680
State:
$4,449
Taxes paid: $5,100 (reported on 16.3% of returns)
81133:
$5,100
State:
$7,641
(% of AGI for various income ranges: 1.5% for AGIs below $25k, 2.1% for AGIs $50k-75k, 3.8% for AGIs $100k-200k)
Earned income credit: $2,290 (reported on 23.3% of returns)
Here:
$2,290
State:
$2,095
(% of AGI for various income ranges: 7.0% for AGIs below $25k, 1.8% for AGIs $25k-50k)
Percentage of individuals using paid preparers for their 2012 taxes: 48.8%
Here:
49%
State:
49%
(% for various income ranges: 42.1% for AGIs below $25k, 50.0% for AGIs $25k-50k, 71.4% for AGIs $50k-75k, 75.0% for AGIs $100k-200k)
Averages for the 2004 tax year for zip code 81133, filed in 2005:
Average Adjusted Gross Income (AGI) in 2004: $35,292 (Individual Income Tax Returns)
Here:
$35,292
State:
$55,014
Salary/wage: $27,865 (reported on 72.8% of returns)
Here:
$27,865
State:
$46,010
(% of AGI for various income ranges: 106.8% for AGIs below $10k, 68.9% for AGIs $10k-25k, 58.4% for AGIs $25k-50k, 64.3% for AGIs $50k-75k, 69.4% for AGIs $75k-100k, 31.7% for AGIs over 100k)
Taxable interest for individuals: $864 (reported on 47.5% of returns)
This zip code:
$864
Colorado:
$2,127
(% of AGI for various income ranges: 5.1% for AGIs below $10k, 1.9% for AGIs $10k-25k, 1.0% for AGIs $25k-50k, 0.8% for AGIs $50k-75k, 0.1% for AGIs $75k-100k, 1.4% for AGIs over 100k)
Taxable dividends: $1,342 (reported on 21.3% of returns)
Here:
$1,342
State:
$3,782
(% of AGI for various income ranges: 0.9% for AGIs $10k-25k, 1.4% for AGIs $25k-50k, 0.2% for AGIs $50k-75k, 1.1% for AGIs over 100k)
Net capital gain/loss: +$6,279 (reported on 19.1% of returns)
Here:
+$6,279
State:
+$17,882
(% of AGI for various income ranges: 0.1% for AGIs $10k-25k, 0.7% for AGIs $25k-50k, 1.1% for AGIs $50k-75k, 13.2% for AGIs over 100k)
Profit/loss from business: +$1,313 (reported on 18.8% of returns)
Here:
+$1,313
State:
+$11,247
(% of AGI for various income ranges: 13.6% for AGIs below $10k, 3.0% for AGIs $10k-25k, -0.1% for AGIs $25k-50k, 0.1% for AGIs $75k-100k)
Total itemized deductions: $15,000 (22% of AGI, reported on 24.7% of returns)
Here:
$15,000
State:
$20,560
Here:
22.2% of AGI
State:
21.4% of AGI
(% of AGI for various income ranges: 10.0% for AGIs $10k-25k, 12.3% for AGIs $25k-50k, 11.2% for AGIs $50k-75k, 15.5% for AGIs $75k-100k, 6.4% for AGIs over 100k)
Charity contributions deductions: $2,243 (3% of AGI, reported on 19.7% of returns)
Here:
$2,243
State:
$3,518
Here:
3.4% of AGI
State:
3.4% of AGI
(% of AGI for various income ranges: 0.7% for AGIs $10k-25k, 1.8% for AGIs $25k-50k, 1.3% for AGIs $50k-75k, 3.2% for AGIs $75k-100k)
Total tax: $4,750 (reported on 69.7% of returns)
81133:
$4,750
State:
$9,173
(% of AGI for various income ranges: 2.1% for AGIs below $10k, 3.7% for AGIs $10k-25k, 5.9% for AGIs $25k-50k, 9.2% for AGIs $50k-75k, 11.5% for AGIs $75k-100k, 17.3% for AGIs over 100k)
Earned income credit: $1,780 (reported on 23.0% of returns)
Here:
$1,780
State:
$1,595
Percentage of individuals using paid preparers for their 2004 taxes: 55.6%
Here:
56%
State:
55%
(% for various income ranges: 49.3% for AGIs below $10k, 54.8% for AGIs $10k-25k, 58.3% for AGIs $25k-50k, 62.8% for AGIs $50k-75k, 105.9% for AGIs $75k-100k)
Household received Food Stamps/SNAP in the past 12 months: 205 Household did not receive Food Stamps/SNAP in the past 12 months: 294
Women who had a birth in the past 12 months: 15 (15 now married, 0 unmarried) Women who did not have a birth in the past 12 months: 181 (51 now married, 130 unmarried)
Housing units in zip code 81133 with a mortgage: 171 Houses without a mortgage: 61
Median monthly owner costs for units with a mortgage: $1,032 Median monthly owner costs for units without a mortgage: $295
Residents with income below the poverty level in 2022:
This zip code:
30.9%
Whole state:
9.4%
Residents with income below 50% of the poverty level in 2022:
This zip code:
13.9%
Whole state:
4.6%
Median number of rooms in houses and condos:
Here:
5.2
State:
6.8
Median number of rooms in apartments:
Here:
4.6
State:
4.0
Notable locations in this zip code not listed on our city pages
Notable locations in zip code 81133: Sierra (A), Mallet Vega Camp (B), Mortimer (C), Trinchera Ranch (D), Red Gate Corral (E), McCarty Cow Camp (F), Costilla County Fire Protection District Fort Garland Fire Department (G). Display/hide their locations on the map
Creeks: Grayback Creek (A), Placer Creek (B), Ojito Creek (C), West Indian Creek (D), Bear Creek (E), North Fork Trinchera Creek (F), Vega Creek (G), Missouri Creek (H), Wagon Creek (I). Display/hide their locations on the map
Size of family households: 231 2-persons, 70 3-persons, 22 4-persons, 23 5-persons, 29 6-persons
Size of nonfamily households: 86 1-person, 18 2-persons
134 married couples with children.
80 single-parent households (1 men, 79 women).
73.9% of residents of 81133 zip code speak English at home.
25.4% of residents speak Spanish at home (85% very well, 12% well, 3% not well).
0.7% of residents speak other Indo-European language at home (100% very well).
Foreign born population: 70 (6.3%) (48.9% of them are naturalized citizens)
This zip code:
6.3%
Whole state:
9.5%
63%Honduras
6%France
3%Japan
9%German
7%European
6%Scotch-Irish
5%American
5%Irish
1%Scandinavian
1%English
Year of entry for the foreign-born population
162010 or later
02000 to 2009
211990 to 1999
47Before 1990
Housing units lacking complete plumbing facilities: 11.3% Housing units lacking complete kitchen facilities: 11.9%
44.9%Wood
33.7%Bottled, tank, or LP gas
13.4%Electricity
3.7%Fuel oil, kerosene, etc.
3.3%Other fuel
1.8%Solar energy
Population in 1990: 725. Population change in the 1990s: +81 (+11.2%).
Place of birth for U.S.-born residents:
This state: 470
Northeast: 50
Midwest: 164
South: 211
West: 140
57% of the 81133 zip code residents lived in the same house 5 years ago. Out of people who lived in different houses, 33% lived in this county. Out of people who lived in different counties, 50% lived in Colorado.
91% of the 81133 zip code residents lived in the same house 1 year ago. Out of people who lived in different houses, 22% moved from different county within same state. Out of people who lived in different houses, 85% moved from different state.
Private vs. public school enrollment:
Students in private schools in grades 1 to 8 (elementary and middle school):
Here:
0.0%
Colorado:
11.4%
Students in private schools in grades 9 to 12 (high school): 23
Here:
80.3%
Colorado:
8.5%
Occupation by median earnings in the past 12 months ($)
40,115Management occupations
34,177Construction and extraction occupations
21,647Farming, fishing, and forestry occupations
2,580Office and administrative support occupations
Companies with federal contracts located in this zip code:
MUNDORF, LLC (18727 COUNTY RD GG 5 in FORT GARLAND, CO; small business) 30 employees, $928765 revenue. : $1,182,100 in 93 contractsfrom 2002 to 2006
Contracts for Lease or Rental of Facilities -- Office Buildings by Public Buildings Service Signed by year:2000: $0; 2001: $0; 2002: $185,464; 2003: $577,654; 2004: $62,121; 2005: $233,479; 2006: $123,382.
Biggest contracts:
$32,401 with Public Buildings Service for Lease or Rental of Facilities -- Office Buildings. Signed on 2003-06-15. Completion date: 2003-06-15.
$32,401, same as above.Signed on 2003-09-15. Completion date: 2003-09-15.
$32,222, same as above.Signed on 2002-12-15. Completion date: 2002-12-15.
$32,222, same as above.Signed on 2003-09-15. Completion date: 2003-09-15.
Top industries in this zip code by the number of employees in 2005:
Wholesale Trade: Fresh Fruit and Vegetable Merchant Wholesalers (20-49 employees: 1 establishment)
Accommodation and Food Services: Full-Service Restaurants (5-9: 1, 1-4: 2)
Other Services (except Public Administration): Other Similar Organizations (except Business, Professional, Labor, and Political Organizations) (1-4: 1)
Professional, Scientific, and Technical Services: Offices of Lawyers (1-4: 1)
Administrative and Support and Waste Management and Remediation Services: Janitorial Services (1-4: 1)
Other Services (except Public Administration): Religious Organizations (1-4: 1)
Professional, Scientific, and Technical Services: Other Scientific and Technical Consulting Services (1-4: 1)
Fatal accident statistics in 2014:
Fatal accident count: 2
Vehicles involved in fatal accidents: 4
Fatal accidents caused by drunken drivers: 1
Fatalities: 2
Persons involved in fatal accidents: 4
Pedestrians involved in fatal accidents: 0
Fatal accident statistics in 2012:
Fatal accident count: 1
Vehicles involved in fatal accidents: 2
Fatal accidents caused by drunken drivers: 0
Fatalities: 1
Persons involved in fatal accidents: 7
Pedestrians involved in fatal accidents: 0
Most common first names in zip code 81133 among deceased individuals
Name
Count
Lived (average)
John
6
76.2 years
Joe
6
72.0 years
David
5
74.2 years
Jose
5
78.6 years
Maria
5
87.2 years
Edward
4
75.3 years
George
3
64.0 years
Juan
3
76.3 years
Alfonso
2
83.0 years
Claudina
2
78.5 years
Most common last names in zip code 81133 among deceased individuals
Last name
Count
Lived (average)
Martinez
10
77.0 years
Medina
6
73.3 years
Gonzales
5
82.0 years
Cordova
4
62.2 years
Archuleta
4
74.8 years
Montoya
4
78.0 years
Romero
4
85.0 years
Atencio
3
78.7 years
Lucero
3
80.3 years
Sandoval
3
73.0 years
Businesses in zip code 81133
FedEx: 1
Discuss Fort Garland, Colorado (CO) on our hugely popular Colorado forum.


 Nearest zip codes: 81055, 81123, 81126, 81152, 81040, 81146.


