Averages for the 2020 tax year for zip code 81624, filed in 2021:
Average Adjusted Gross Income (AGI) in 2020: $67,346 (Individual Income Tax Returns)
Here:
$67,346
State:
$89,260
Salary/wage: $51,100 (reported on 71.2% of returns)
Here:
$51,100
State:
$70,330
(% of AGI for various income ranges: 1017.8% for AGIs below $25k, 4318.8% for AGIs $25k-50k, 7022.5% for AGIs $50k-75k, 7940.0% for AGIs $75k-100k, 21377.5% for AGIs $100k-200k)
Taxable interest for individuals: $832 (reported on 36.5% of returns)
This zip code:
$832
Colorado:
$2,176
(% of AGI for various income ranges: 34.4% for AGIs below $25k, 17.5% for AGIs $25k-50k, 50.0% for AGIs $50k-75k, 55.0% for AGIs $75k-100k, 177.5% for AGIs $100k-200k)
Ordinary dividends: $3,680 (reported on 19.2% of returns)
Here:
$3,680
State:
$8,820
(% of AGI for various income ranges: 76.7% for AGIs below $25k, 48.8% for AGIs $25k-50k, 350.0% for AGIs $50k-75k, 300.0% for AGIs $100k-200k)
Net capital gain/loss in AGI: +$30,400 (reported on 21.2% of returns)
Here:
+$30,400
State:
+$37,276
(% of AGI for various income ranges: 33.3% for AGIs below $25k, 157.5% for AGIs $25k-50k, 220.0% for AGIs $50k-75k, 7750.0% for AGIs $100k-200k)
Profit/loss from business: +$10,845 (reported on 21.2% of returns)
Here:
+$10,845
State:
+$15,295
(% of AGI for various income ranges: 440.0% for AGIs below $25k, 371.2% for AGIs $25k-50k, 1107.5% for AGIs $50k-75k, 142.5% for AGIs $100k-200k)
Taxable individual retirement arrangement distribution: $18,980 (reported on 9.6% of returns)
81624:
$18,980
Colorado:
$23,785
(% of AGI for various income ranges: 321.1% for AGIs below $25k, 1650.0% for AGIs $75k-100k)
Total itemized deductions: $30,500 (reported on 7.7% of returns)
Here:
$30,500
State:
$35,141
(% of AGI for various income ranges: 3050.0% for AGIs $100k-200k)
Charity contributions: $13,550 (reported on 3.8% of returns)
Here:
$13,550
State:
$12,103
(% of AGI for various income ranges: 677.5% for AGIs $75k-100k)
Taxes paid: $6,050 (reported on 7.7% of returns)
81624:
$6,050
State:
$7,710
(% of AGI for various income ranges: 605.0% for AGIs $100k-200k)
Earned income credit: $2,433 (reported on 11.5% of returns)
Here:
$2,433
State:
$2,053
(% of AGI for various income ranges: 94.4% for AGIs below $25k, 76.2% for AGIs $25k-50k)
Percentage of individuals using paid preparers for their 2020 taxes: 88.5%
Here:
88%
State:
93%
(% for various income ranges: 87.5% for AGIs below $25k, 84.6% for AGIs $25k-50k, 100.0% for AGIs $50k-75k, 83.3% for AGIs $75k-100k, 90.0% for AGIs $100k-200k)
Averages for the 2012 tax year for zip code 81624, filed in 2013:
Average Adjusted Gross Income (AGI) in 2012: $55,466 (Individual Income Tax Returns)
Here:
$55,466
State:
$69,103
Salary/wage: $41,205 (reported on 76.0% of returns)
Here:
$41,205
State:
$54,794
(% of AGI for various income ranges: 57.3% for AGIs below $25k, 72.6% for AGIs $25k-50k, 66.5% for AGIs $50k-75k, 61.0% for AGIs $75k-100k, 44.6% for AGIs $100k-200k)
Taxable interest for individuals: $767 (reported on 42.0% of returns)
This zip code:
$767
Colorado:
$1,971
(% of AGI for various income ranges: 2.4% for AGIs below $25k, 0.3% for AGIs $25k-50k, 0.8% for AGIs $50k-75k, 0.3% for AGIs $75k-100k, 0.4% for AGIs $100k-200k)
Ordinary dividends: $3,078 (reported on 18.0% of returns)
Here:
$3,078
State:
$7,140
(% of AGI for various income ranges: 2.2% for AGIs below $25k, 0.5% for AGIs $25k-50k, 1.1% for AGIs $50k-75k, 1.3% for AGIs $100k-200k)
Net capital gain/loss in AGI: +$5,512 (reported on 16.0% of returns)
Here:
+$5,512
State:
+$23,009
(% of AGI for various income ranges: 0.7% for AGIs $25k-50k, 0.2% for AGIs $50k-75k, 3.4% for AGIs $100k-200k)
Profit/loss from business: +$14,182 (reported on 22.0% of returns)
Here:
+$14,182
State:
+$13,514
(% of AGI for various income ranges: 11.0% for AGIs below $25k, 8.8% for AGIs $25k-50k, 19.5% for AGIs $75k-100k)
Taxable individual retirement arrangement distribution: $14,750 (reported on 8.0% of returns)
81624:
$14,750
Colorado:
$17,927
Total itemized deductions: $20,912 (22% of AGI, reported on 34.0% of returns)
Here:
$20,912
State:
$24,621
Here:
21.6% of AGI
State:
18.5% of AGI
(% of AGI for various income ranges: 17.6% for AGIs $25k-50k, 12.2% for AGIs $50k-75k, 14.7% for AGIs $75k-100k, 12.9% for AGIs $100k-200k)
Charity contributions: $4,509 (reported on 22.0% of returns)
Here:
$4,509
State:
$4,449
(% of AGI for various income ranges: 3.1% for AGIs $25k-50k, 3.3% for AGIs $75k-100k, 1.7% for AGIs $100k-200k)
Taxes paid: $5,594 (reported on 34.0% of returns)
81624:
$5,594
State:
$7,641
(% of AGI for various income ranges: 2.9% for AGIs $25k-50k, 2.0% for AGIs $50k-75k, 3.1% for AGIs $75k-100k, 4.9% for AGIs $100k-200k)
Earned income credit: $2,125 (reported on 16.0% of returns)
Here:
$2,125
State:
$2,095
(% of AGI for various income ranges: 5.5% for AGIs below $25k, 1.1% for AGIs $25k-50k)
Percentage of individuals using paid preparers for their 2012 taxes: 64.0%
Here:
64%
State:
49%
(% for various income ranges: 50.0% for AGIs below $25k, 66.7% for AGIs $25k-50k, 62.5% for AGIs $50k-75k, 80.0% for AGIs $75k-100k, 85.7% for AGIs $100k-200k)
Averages for the 2004 tax year for zip code 81624, filed in 2005:
Average Adjusted Gross Income (AGI) in 2004: $34,636 (Individual Income Tax Returns)
Here:
$34,636
State:
$55,014
Salary/wage: $30,236 (reported on 77.5% of returns)
Here:
$30,236
State:
$46,010
(% of AGI for various income ranges: 63.7% for AGIs $10k-25k, 77.9% for AGIs $25k-50k, 74.1% for AGIs $50k-75k, 72.6% for AGIs $75k-100k, 31.8% for AGIs over 100k)
Taxable interest for individuals: $1,440 (reported on 47.6% of returns)
This zip code:
$1,440
Colorado:
$2,127
(% of AGI for various income ranges: 4.5% for AGIs $10k-25k, 1.8% for AGIs $25k-50k, 1.7% for AGIs $50k-75k, 0.5% for AGIs $75k-100k, 1.1% for AGIs over 100k)
Taxable dividends: $1,748 (reported on 22.7% of returns)
Here:
$1,748
State:
$3,782
(% of AGI for various income ranges: 0.6% for AGIs $10k-25k, 0.5% for AGIs $25k-50k, 0.3% for AGIs $50k-75k, 2.1% for AGIs over 100k)
Net capital gain/loss: +$11,468 (reported on 24.0% of returns)
Here:
+$11,468
State:
+$17,882
(% of AGI for various income ranges: 0.1% for AGIs $10k-25k, 4.6% for AGIs $25k-50k, 7.9% for AGIs $50k-75k, 15.8% for AGIs over 100k)
Profit/loss from business: +$4,670 (reported on 20.8% of returns)
Here:
+$4,670
State:
+$11,247
(% of AGI for various income ranges: 8.8% for AGIs $10k-25k, 6.0% for AGIs $25k-50k, 0.2% for AGIs $50k-75k)
IRA payment deduction: $2,417 (reported on 2.3% of returns)
81624:
$2,417
Colorado:
$2,947
Total itemized deductions: $18,052 (28% of AGI, reported on 29.1% of returns)
Here:
$18,052
State:
$20,560
Here:
27.9% of AGI
State:
21.4% of AGI
(% of AGI for various income ranges: 16.6% for AGIs $10k-25k, 13.9% for AGIs $25k-50k, 15.3% for AGIs $50k-75k, 14.8% for AGIs $75k-100k, 14.9% for AGIs over 100k)
Charity contributions deductions: $2,839 (4% of AGI, reported on 21.3% of returns)
Here:
$2,839
State:
$3,518
Here:
4.3% of AGI
State:
3.4% of AGI
(% of AGI for various income ranges: 1.6% for AGIs $10k-25k, 1.4% for AGIs $25k-50k, 2.6% for AGIs $50k-75k, 1.2% for AGIs $75k-100k, 1.5% for AGIs over 100k)
Total tax: $4,623 (reported on 71.8% of returns)
81624:
$4,623
State:
$9,173
(% of AGI for various income ranges: 4.2% for AGIs $10k-25k, 5.9% for AGIs $25k-50k, 8.1% for AGIs $50k-75k, 10.4% for AGIs $75k-100k, 16.9% for AGIs over 100k)
Earned income credit: $1,521 (reported on 17.9% of returns)
Here:
$1,521
State:
$1,595
Percentage of individuals using paid preparers for their 2004 taxes: 67.4%
Here:
67%
State:
55%
(% for various income ranges: 62.8% for AGIs below $10k, 61.2% for AGIs $10k-25k, 71.1% for AGIs $25k-50k, 78.8% for AGIs $50k-75k, 60.0% for AGIs $75k-100k, 76.0% for AGIs over 100k)
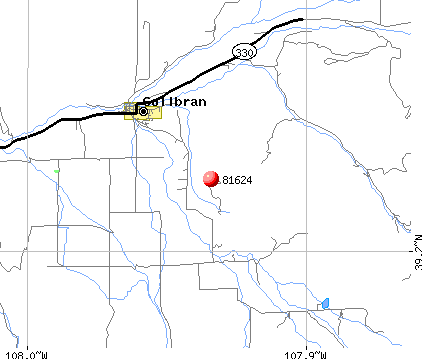
Notable locations in zip code 81624: Big Creek Leon Drift Fence (A), Eagalite School (B), Mormon Mesa School (C), Fuller Hill (D), Hawxhurst Cow Camp (E), Kennon Cow Camp (F), Buzzard Campground (G), Hightower Guard Station (H), Cayton Guard Station (I), Leon Cow Camp (J), Vega State Recreation Area (K), Vega Lodge (L), Power and Water Resources Office (M), Department of Parks and Outdoor Recreation Office (N), Aspen Grove Campground (O), Brush Creek Cow Camp (P), Owens Creek Corral (Q), Collbran Job Corps (R), Oil Well Camp (S), Buzzard Cow Camp (T). Display/hide their locations on the map
Lakes and reservoirs: Elk Lake (A), Gander Pond (B), Mosquito Lake (C), Vega Reservoir (D), Kendall Reservoir (E), Dawson Reservoir (F), Big Creek Reservoir Number 3 (G), Anderson Brothers Reservoir Number 1 (H). Display/hide their locations on the map
Creeks: Pretty Creek (A), Boxelder Creek (B), Snowslide Creek (C), Big Creek (D), Kenney Creek (E), Monument Creek (F), Michaelsen Creek (G), Gas Creek (H), Crane Creek (I). Display/hide their locations on the map
In group quarters: 355 (-1 institutionalized population)
Size of family households: 284 2-persons, 46 3-persons, 46 4-persons, 51 5-persons, 1 6-persons
Size of nonfamily households: 113 1-person, 7 2-persons
181 married couples with children.
58 single-parent households (10 men, 48 women).
95.5% of residents of 81624 zip code speak English at home.
3.2% of residents speak Spanish at home (100% very well).
0.7% of residents speak Asian or Pacific Island language at home (100% well).
Foreign born population: 22 (1.4%) (18.9% of them are naturalized citizens)
This zip code:
1.4%
Whole state:
9.5%
64%Malaysia
18%Honduras
36%German
11%English
9%American
5%Irish
5%European
5%Scottish
3%Norwegian
Year of entry for the foreign-born population
02010 or later
132000 to 2009
01990 to 1999
9Before 1990
Facilities with environmental interests located in this zip code:
CALLEYWIDE SEWERAGE SYSTEM (1.5 MI W/TOWN ON PUPE LAGOON in COLLBRAN, CO)
National Pollutant Discharge Elimination System NON-MAJOR (Tracking pollutant discharge elimination systems) - permit COMMUNITY WATER SYSTEM (SDWIS) - SDWIS-CO0139185 7, WATER TREATMENT PLANT Business SIC classification: SEWERAGE SYSTEMS Alternative names: COLLBRAN, TOWN OF
GRAND MESA HIGH SCHOOL (56600 HIGHWAY 330 in COLLBRAN, CO)
(National Center for Education Statistics) - STATE ID-3582 Organizations: PLATEAU VALLEY 50 (SCHOOL DISTRICT)
BLACK MOUNTAIN DISPOSAL FACILITY (45.5 RD AND HWY 65 in COLLBRAN, CO)
(Resource Conservation and Recovery Act (tracking hazardous waste))
Housing units lacking complete plumbing facilities: 3.3% Housing units lacking complete kitchen facilities: 3.8%
36.3%Utility gas
34.2%Bottled, tank, or LP gas
11.8%Wood
10.4%Electricity
8.0%Other fuel
Population in 1990: 1,043. Population change in the 1990s: +393 (+37.7%).
Place of birth for U.S.-born residents:
This state: 816
Northeast: 102
Midwest: 181
South: 162
West: 340
54% of the 81624 zip code residents lived in the same house 5 years ago. Out of people who lived in different houses, 44% lived in this county. Out of people who lived in different counties, 50% lived in Colorado.
88% of the 81624 zip code residents lived in the same house 1 year ago. Out of people who lived in different houses, 32% moved from this county. Out of people who lived in different houses, 53% moved from different county within same state. Out of people who lived in different houses, 16% moved from different state.
Private vs. public school enrollment:
Students in private schools in grades 1 to 8 (elementary and middle school): 24
Here:
20.9%
Colorado:
11.4%
Students in private schools in grades 9 to 12 (high school): 49
Here:
21.9%
Colorado:
8.5%
Students in private undergraduate colleges: 34
Here:
54.0%
Colorado:
14.0%
Occupation by median earnings in the past 12 months ($)
108,238Computer and mathematical occupations
101,029Management occupations
82,845Construction and extraction occupations
80,867Transportation occupations
73,076Installation, maintenance, and repair occupations
63,958Production occupations
Top industries in this zip code by the number of employees in 2005:
Health Care and Social Assistance: Services for the Elderly and Persons with Disabilities (20-49 employees: 1 establishment)
Accommodation and Food Services: Full-Service Restaurants (5-9: 1, 1-4: 2)
Health Care and Social Assistance: Home Health Care Services (5-9: 1)
Construction: New Single-Family Housing Construction (except Operative Builders) (1-4: 3)
Other Services (except Public Administration): Religious Organizations (1-4: 2)
Construction: Masonry Contractors (1-4: 2)
People in group quarters in 2010:
235 people in workers' group living quarters and job corps centers
People in group quarters in 2000:
148 people in job corps and vocational training facilities
25 people in nursing homes
Home Mortgage Disclosure Act Aggregated Statistics For Year 2009 (Based on 2 partial tracts)
A) FHA, FSA/RHS & VA Home Purchase Loans
B) Conventional Home Purchase Loans
C) Refinancings
D) Home Improvement Loans
F) Non-occupant Loans on < 5 Family Dwellings (A B C & D)
G) Loans On Manufactured Home Dwelling (A B C & D)
Number
Average Value
Number
Average Value
Number
Average Value
Number
Average Value
Number
Average Value
Number
Average Value
LOANS ORIGINATED
12
$194,268
6
$343,992
100
$235,131
6
$153,205
11
$268,382
17
$162,471
APPLICATIONS APPROVED, NOT ACCEPTED
1
$125,350
1
$113,100
9
$196,109
0
$0
2
$172,895
1
$56,910
APPLICATIONS DENIED
5
$245,368
6
$170,015
41
$229,105
5
$103,594
5
$154,166
9
$145,121
APPLICATIONS WITHDRAWN
1
$172,900
1
$505,000
22
$229,710
2
$133,635
1
$409,910
3
$158,967
FILES CLOSED FOR INCOMPLETENESS
0
$0
0
$0
4
$255,742
0
$0
0
$0
0
$0
Aggregated Statistics For Year 2008 (Based on 2 partial tracts)
A) FHA, FSA/RHS & VA Home Purchase Loans
B) Conventional Home Purchase Loans
C) Refinancings
D) Home Improvement Loans
F) Non-occupant Loans on < 5 Family Dwellings (A B C & D)
G) Loans On Manufactured Home Dwelling (A B C & D)
Number
Average Value
Number
Average Value
Number
Average Value
Number
Average Value
Number
Average Value
Number
Average Value
LOANS ORIGINATED
18
$211,237
14
$217,664
62
$221,639
5
$122,468
17
$195,652
19
$185,371
APPLICATIONS APPROVED, NOT ACCEPTED
3
$253,580
2
$238,090
7
$229,396
2
$11,885
3
$130,873
4
$182,260
APPLICATIONS DENIED
4
$258,082
8
$131,292
35
$242,939
7
$112,589
6
$283,357
10
$112,094
APPLICATIONS WITHDRAWN
2
$179,740
8
$219,181
14
$333,339
3
$151,283
1
$114,540
1
$208,920
FILES CLOSED FOR INCOMPLETENESS
0
$0
1
$210,360
2
$183,700
0
$0
0
$0
0
$0
Aggregated Statistics For Year 2007 (Based on 2 partial tracts)
A) FHA, FSA/RHS & VA Home Purchase Loans
B) Conventional Home Purchase Loans
C) Refinancings
D) Home Improvement Loans
F) Non-occupant Loans on < 5 Family Dwellings (A B C & D)
G) Loans On Manufactured Home Dwelling (A B C & D)
Number
Average Value
Number
Average Value
Number
Average Value
Number
Average Value
Number
Average Value
Number
Average Value
LOANS ORIGINATED
11
$166,282
44
$230,757
64
$209,850
7
$52,899
14
$173,616
23
$152,318
APPLICATIONS APPROVED, NOT ACCEPTED
0
$0
15
$176,834
8
$261,235
1
$216,120
1
$196,670
4
$152,365
APPLICATIONS DENIED
2
$165,330
14
$177,990
42
$189,774
9
$88,929
6
$178,660
12
$120,967
APPLICATIONS WITHDRAWN
3
$190,427
4
$247,818
14
$233,513
2
$27,015
1
$146,960
2
$225,845
FILES CLOSED FOR INCOMPLETENESS
0
$0
3
$180,580
3
$140,717
1
$14,410
1
$180,100
0
$0
Aggregated Statistics For Year 2006 (Based on 2 partial tracts)
A) FHA, FSA/RHS & VA Home Purchase Loans
B) Conventional Home Purchase Loans
C) Refinancings
D) Home Improvement Loans
F) Non-occupant Loans on < 5 Family Dwellings (A B C & D)
G) Loans On Manufactured Home Dwelling (A B C & D)
Number
Average Value
Number
Average Value
Number
Average Value
Number
Average Value
Number
Average Value
Number
Average Value
LOANS ORIGINATED
13
$170,070
68
$190,080
62
$177,544
6
$54,390
22
$135,239
20
$147,070
APPLICATIONS APPROVED, NOT ACCEPTED
1
$82,850
12
$134,715
11
$196,342
2
$94,010
2
$122,110
4
$104,458
APPLICATIONS DENIED
4
$116,345
29
$250,525
41
$189,500
4
$48,268
9
$344,351
17
$146,199
APPLICATIONS WITHDRAWN
3
$135,917
12
$305,389
24
$197,420
1
$10,810
1
$516,530
3
$160,170
FILES CLOSED FOR INCOMPLETENESS
0
$0
1
$82,130
4
$178,480
0
$0
0
$0
0
$0
Aggregated Statistics For Year 2005 (Based on 2 partial tracts)
A) FHA, FSA/RHS & VA Home Purchase Loans
B) Conventional Home Purchase Loans
C) Refinancings
D) Home Improvement Loans
F) Non-occupant Loans on < 5 Family Dwellings (A B C & D)
G) Loans On Manufactured Home Dwelling (A B C & D)
Number
Average Value
Number
Average Value
Number
Average Value
Number
Average Value
Number
Average Value
Number
Average Value
LOANS ORIGINATED
10
$127,727
60
$124,281
64
$166,784
3
$39,383
21
$112,005
12
$112,442
APPLICATIONS APPROVED, NOT ACCEPTED
1
$124,630
7
$198,521
17
$152,598
1
$21,610
3
$131,353
1
$18,010
APPLICATIONS DENIED
1
$198,830
25
$168,170
44
$180,591
12
$102,717
6
$174,217
7
$107,443
APPLICATIONS WITHDRAWN
2
$160,650
13
$102,740
35
$161,514
1
$257,900
7
$135,744
4
$118,145
FILES CLOSED FOR INCOMPLETENESS
1
$89,330
0
$0
12
$153,265
0
$0
0
$0
1
$43,940
Aggregated Statistics For Year 2004 (Based on 2 partial tracts)
A) FHA, FSA/RHS & VA Home Purchase Loans
B) Conventional Home Purchase Loans
C) Refinancings
D) Home Improvement Loans
F) Non-occupant Loans on < 5 Family Dwellings (A B C & D)
G) Loans On Manufactured Home Dwelling (A B C & D)
Number
Average Value
Number
Average Value
Number
Average Value
Number
Average Value
Number
Average Value
Number
Average Value
LOANS ORIGINATED
8
$114,184
43
$122,820
66
$152,408
5
$55,758
17
$127,256
20
$105,935
APPLICATIONS APPROVED, NOT ACCEPTED
0
$0
7
$156,327
15
$167,037
1
$32,420
1
$170,010
3
$130,873
APPLICATIONS DENIED
5
$143,504
14
$182,364
39
$157,638
4
$81,765
4
$140,118
14
$125,659
APPLICATIONS WITHDRAWN
0
$0
5
$214,392
22
$140,773
2
$113,465
3
$207,237
0
$0
FILES CLOSED FOR INCOMPLETENESS
0
$0
1
$31,700
4
$268,350
1
$79,240
0
$0
1
$31,700
Aggregated Statistics For Year 2003 (Based on 2 partial tracts)
A) FHA, FSA/RHS & VA Home Purchase Loans
B) Conventional Home Purchase Loans
C) Refinancings
D) Home Improvement Loans
F) Non-occupant Loans on < 5 Family Dwellings (A B C & D)
Number
Average Value
Number
Average Value
Number
Average Value
Number
Average Value
Number
Average Value
LOANS ORIGINATED
8
$117,065
45
$150,820
140
$151,032
5
$42,216
24
$140,838
APPLICATIONS APPROVED, NOT ACCEPTED
0
$0
5
$138,604
14
$160,701
0
$0
1
$131,110
APPLICATIONS DENIED
1
$87,170
17
$152,089
62
$169,178
4
$43,765
6
$150,803
APPLICATIONS WITHDRAWN
0
$0
5
$121,892
35
$332,269
0
$0
3
$77,563
FILES CLOSED FOR INCOMPLETENESS
0
$0
1
$97,250
6
$167,613
0
$0
1
$50,430
Aggregated Statistics For Year 2002 (Based on 2 partial tracts)
A) FHA, FSA/RHS & VA Home Purchase Loans
B) Conventional Home Purchase Loans
C) Refinancings
D) Home Improvement Loans
F) Non-occupant Loans on < 5 Family Dwellings (A B C & D)
Number
Average Value
Number
Average Value
Number
Average Value
Number
Average Value
Number
Average Value
LOANS ORIGINATED
5
$123,188
30
$150,900
94
$136,163
10
$36,452
12
$123,548
APPLICATIONS APPROVED, NOT ACCEPTED
0
$0
5
$122,756
17
$131,028
1
$20,890
1
$117,430
APPLICATIONS DENIED
1
$103,740
10
$83,783
43
$134,983
5
$50,284
1
$51,870
APPLICATIONS WITHDRAWN
0
$0
5
$162,810
29
$140,652
3
$58,593
0
$0
FILES CLOSED FOR INCOMPLETENESS
0
$0
1
$144,800
5
$114,544
0
$0
1
$144,800
Aggregated Statistics For Year 2001 (Based on 2 partial tracts)
A) FHA, FSA/RHS & VA Home Purchase Loans
B) Conventional Home Purchase Loans
C) Refinancings
D) Home Improvement Loans
F) Non-occupant Loans on < 5 Family Dwellings (A B C & D)
Number
Average Value
Number
Average Value
Number
Average Value
Number
Average Value
Number
Average Value
LOANS ORIGINATED
6
$100,015
27
$119,800
87
$131,386
2
$43,585
11
$156,851
APPLICATIONS APPROVED, NOT ACCEPTED
0
$0
4
$164,612
9
$106,059
0
$0
1
$90,770
APPLICATIONS DENIED
1
$67,000
12
$89,209
43
$111,109
6
$26,535
3
$153,207
APPLICATIONS WITHDRAWN
2
$118,505
4
$100,135
27
$113,290
0
$0
1
$43,220
FILES CLOSED FOR INCOMPLETENESS
0
$0
0
$0
6
$114,423
0
$0
0
$0
Aggregated Statistics For Year 2000 (Based on 2 partial tracts)
A) FHA, FSA/RHS & VA Home Purchase Loans
B) Conventional Home Purchase Loans
C) Refinancings
D) Home Improvement Loans
F) Non-occupant Loans on < 5 Family Dwellings (A B C & D)
Number
Average Value
Number
Average Value
Number
Average Value
Number
Average Value
Number
Average Value
LOANS ORIGINATED
6
$89,690
35
$120,225
35
$103,470
10
$37,893
8
$77,262
APPLICATIONS APPROVED, NOT ACCEPTED
1
$35,300
5
$154,742
10
$103,738
4
$26,475
1
$252,140
APPLICATIONS DENIED
1
$108,780
12
$90,170
35
$91,614
5
$30,256
2
$69,160
APPLICATIONS WITHDRAWN
1
$69,880
3
$86,447
13
$80,020
2
$30,615
1
$51,150
FILES CLOSED FOR INCOMPLETENESS
0
$0
1
$209,640
6
$143,840
0
$0
0
$0
Aggregated Statistics For Year 1999 (Based on 1 partial tract)
A) FHA, FSA/RHS & VA Home Purchase Loans
B) Conventional Home Purchase Loans
C) Refinancings
D) Home Improvement Loans
F) Non-occupant Loans on < 5 Family Dwellings (A B C & D)

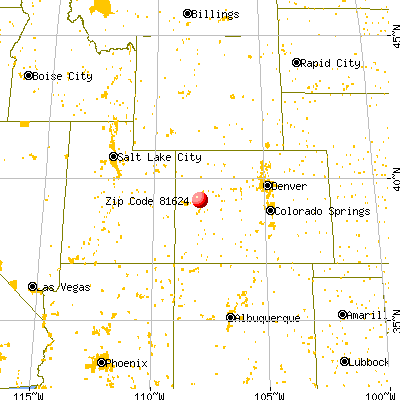


 Nearest zip codes: 81428, 81652, 81646, 81419, 81413, 81434.


