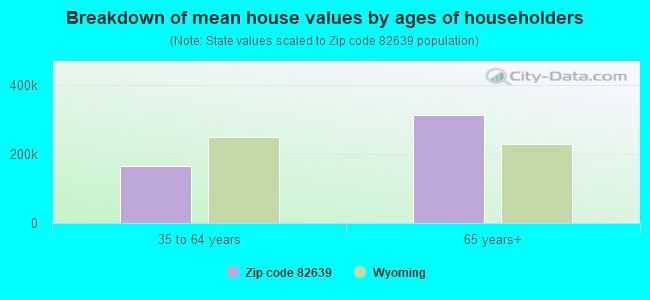
Estimated median house/condo value in 2022: $290,892
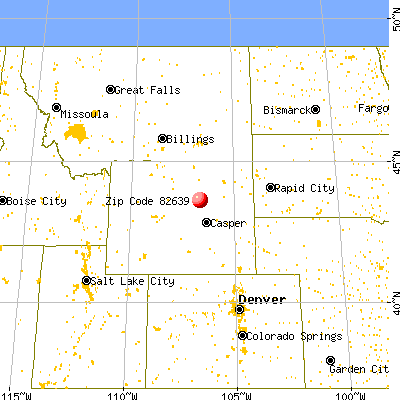
82639:
$290,892
Wyoming:
$292,300
According to our research of Wyoming and other state lists, there were 2 registered sex offenders living in 82639 zip code as of May 19, 2024. The ratio of all residents to sex offenders in zip code 82639 is 386 to 1. The ratio of registered sex offenders to all residents in this zip code is lower than the state average.
Median resident age:
This zip code:
49.6 years
Wyoming median age:
39.1 years
Average household size:
This zip code:
2.1 people
Wyoming:
2.3 people
Averages for the 2020 tax year for zip code 82639, filed in 2021:
Average Adjusted Gross Income (AGI) in 2020: $54,949 (Individual Income Tax Returns)
Here:
$54,949
State:
$93,756
Salary/wage: $44,557 (reported on 80.0% of returns)
Here:
$44,557
State:
$58,022
(% of AGI for various income ranges: 1661.4% for AGIs below $25k, 3760.0% for AGIs $25k-50k, 5762.0% for AGIs $50k-75k, 21025.0% for AGIs $100k-200k)
Taxable interest for individuals: $750 (reported on 40.0% of returns)
This zip code:
$750
Wyoming:
$3,185
(% of AGI for various income ranges: 14.3% for AGIs below $25k, 48.6% for AGIs $25k-50k, 14.0% for AGIs $50k-75k, 270.0% for AGIs $100k-200k)
Ordinary dividends: $4,267 (reported on 17.1% of returns)
Here:
$4,267
State:
$18,054
(% of AGI for various income ranges: 164.3% for AGIs $25k-50k, 705.0% for AGIs $100k-200k)
Net capital gain/loss in AGI: +$15,133 (reported on 25.7% of returns)
Here:
+$15,133
State:
+$61,860
(% of AGI for various income ranges: 728.6% for AGIs $25k-50k, 240.0% for AGIs $50k-75k, 3660.0% for AGIs $100k-200k)
Profit/loss from business: +$2,589 (reported on 25.7% of returns)
Here:
+$2,589
State:
+$12,816
(% of AGI for various income ranges: 61.4% for AGIs below $25k, 330.0% for AGIs $25k-50k)
Taxable individual retirement arrangement distribution: $12,000 (reported on 5.7% of returns)
82639:
$12,000
Wyoming:
$22,959
(% of AGI for various income ranges: 342.9% for AGIs below $25k)
Earned income credit: $2,620 (reported on 14.3% of returns)
Here:
$2,620
State:
$2,106
(% of AGI for various income ranges: 88.6% for AGIs below $25k, 98.6% for AGIs $25k-50k)
Percentage of individuals using paid preparers for their 2020 taxes: 97.1%
Here:
97%
State:
94%
(% for various income ranges: 92.3% for AGIs below $25k, 100.0% for AGIs $25k-50k, 100.0% for AGIs $50k-75k, 100.0% for AGIs $75k-100k, 100.0% for AGIs $100k-200k)
Averages for the 2012 tax year for zip code 82639, filed in 2013:
Average Adjusted Gross Income (AGI) in 2012: $63,939 (Individual Income Tax Returns)
Here:
$63,939
State:
$69,135
Salary/wage: $39,781 (reported on 75.6% of returns)
Here:
$39,781
State:
$48,877
(% of AGI for various income ranges: 70.5% for AGIs below $25k, 66.8% for AGIs $25k-50k, 79.1% for AGIs $50k-75k, 69.7% for AGIs $75k-100k, 26.4% for AGIs $100k-200k)
Taxable interest for individuals: $917 (reported on 43.9% of returns)
This zip code:
$917
Wyoming:
$3,063
(% of AGI for various income ranges: 1.7% for AGIs below $25k, 0.8% for AGIs $25k-50k, 0.1% for AGIs $50k-75k, 0.4% for AGIs $75k-100k, 0.7% for AGIs $100k-200k)
Ordinary dividends: $3,829 (reported on 17.1% of returns)
Here:
$3,829
State:
$14,293
(% of AGI for various income ranges: 1.1% for AGIs below $25k, 1.3% for AGIs $25k-50k, 1.5% for AGIs $100k-200k)
Net capital gain/loss in AGI: +$59,000 (reported on 24.4% of returns)
Here:
+$59,000
State:
+$37,851
(% of AGI for various income ranges: 8.9% for AGIs below $25k, 4.8% for AGIs $50k-75k, 38.4% for AGIs $100k-200k)
Profit/loss from business: +$7,920 (reported on 24.4% of returns)
Here:
+$7,920
State:
+$13,804
(% of AGI for various income ranges: 32.1% for AGIs below $25k, 1.9% for AGIs $50k-75k, 6.2% for AGIs $75k-100k)
Total itemized deductions: $23,200 (11% of AGI, reported on 12.2% of returns)
Here:
$23,200
State:
$25,377
Here:
11.5% of AGI
State:
15.6% of AGI
Charity contributions: $5,367 (reported on 7.3% of returns)
Here:
$5,367
State:
$7,424
Taxes paid: $2,680 (reported on 12.2% of returns)
82639:
$2,680
State:
$4,979
Earned income credit: $2,100 (reported on 12.2% of returns)
Here:
$2,100
State:
$1,989
(% of AGI for various income ranges: 6.4% for AGIs below $25k)
Percentage of individuals using paid preparers for their 2012 taxes: 75.6%
Here:
76%
State:
50%
(% for various income ranges: 68.8% for AGIs below $25k, 75.0% for AGIs $25k-50k, 71.4% for AGIs $50k-75k, 75.0% for AGIs $75k-100k, 100.0% for AGIs $100k-200k)
Averages for the 2004 tax year for zip code 82639, filed in 2005:
Average Adjusted Gross Income (AGI) in 2004: $27,225 (Individual Income Tax Returns)
Here:
$27,225
State:
$50,131
Salary/wage: $27,538 (reported on 76.7% of returns)
Here:
$27,538
State:
$37,659
(% of AGI for various income ranges: 73.0% for AGIs $10k-25k, 75.4% for AGIs $25k-50k, 59.1% for AGIs $50k-75k, 75.5% for AGIs $75k-100k, 41.2% for AGIs over 100k)
Taxable interest for individuals: $1,425 (reported on 61.1% of returns)
This zip code:
$1,425
Wyoming:
$2,408
(% of AGI for various income ranges: 2.8% for AGIs $10k-25k, 2.0% for AGIs $25k-50k, 2.6% for AGIs $50k-75k, 0.4% for AGIs $75k-100k, 1.6% for AGIs over 100k)
Taxable dividends: $937 (reported on 21.2% of returns)
Here:
$937
State:
$6,819
(% of AGI for various income ranges: 1.1% for AGIs $10k-25k, 0.3% for AGIs $25k-50k, 0.5% for AGIs $50k-75k, 2.0% for AGIs $75k-100k)
Net capital gain/loss: +$10,448 (reported on 28.2% of returns)
Here:
+$10,448
State:
+$23,705
(% of AGI for various income ranges: 3.3% for AGIs $10k-25k, 7.1% for AGIs $25k-50k, 14.6% for AGIs $50k-75k, 16.7% for AGIs $75k-100k)
Profit/loss from business: +$3,364 (reported on 29.5% of returns)
Here:
+$3,364
State:
+$10,523
(% of AGI for various income ranges: 8.8% for AGIs $10k-25k, 1.6% for AGIs $25k-50k, 4.3% for AGIs $50k-75k)
Total itemized deductions: $13,969 (24% of AGI, reported on 8.6% of returns)
Here:
$13,969
State:
$18,912
Here:
23.8% of AGI
State:
17.8% of AGI
Charity contributions deductions: $1,214 (2% of AGI, reported on 3.8% of returns)
Here:
$1,214
State:
$5,489
Here:
1.6% of AGI
State:
4.7% of AGI
Total tax: $3,755 (reported on 72.1% of returns)
82639:
$3,755
State:
$8,551
(% of AGI for various income ranges: 4.5% for AGIs $10k-25k, 6.2% for AGIs $25k-50k, 7.9% for AGIs $50k-75k, 9.5% for AGIs $75k-100k, 12.4% for AGIs over 100k)
Earned income credit: $1,206 (reported on 16.9% of returns)
Here:
$1,206
State:
$1,544
Percentage of individuals using paid preparers for their 2004 taxes: 78.3%
Here:
78%
State:
59%
(% for various income ranges: 83.1% for AGIs below $10k, 74.4% for AGIs $10k-25k, 75.3% for AGIs $25k-50k, 76.0% for AGIs $50k-75k, 73.7% for AGIs $75k-100k, 93.3% for AGIs over 100k)
Lakes and reservoirs: Hole-in-the-Wall Lake (A), Kaycee Lagoon (B), Artesian Upper Reservoir (C), Four Mile Reservoir (D), Streeter Reservoir (E), Big Red Reservoir (F), Branch Reservoir (G), Ellis Reservoir (H). Display/hide their locations on the map
Streams, rivers, and creeks: Antelope Creek (A), Arch Creek (B), Bachaus Creek (C), Baldwin Creek (D), Hot Water Creek (E), Hodge Creek (F), Johnson Creek (G), Gordon Creek (H), Turkey Springs Creek (I). Display/hide their locations on the map
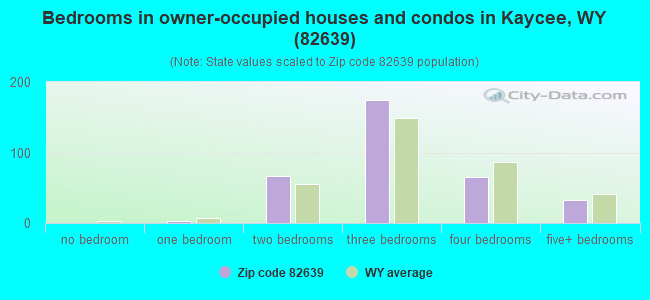
Size of family households: 122 2-persons, 13 3-persons, 62 4-persons, 9 5-persons, 4 6-persons, 11 7-or-more-persons
Size of nonfamily households: 109 1-person, 50 2-persons
187 married couples with children.
33 single-parent households (33 women).
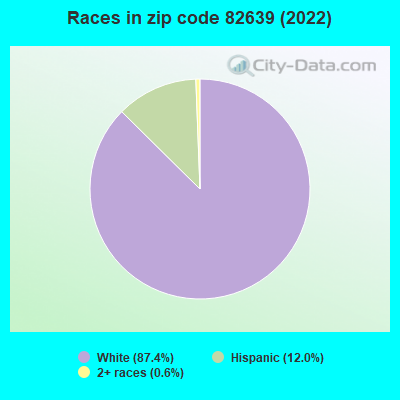
89.3% of residents of 82639 zip code speak English at home.
5.6% of residents speak Spanish at home (100% very well).
5.7% of residents speak other language at home (100% very well).
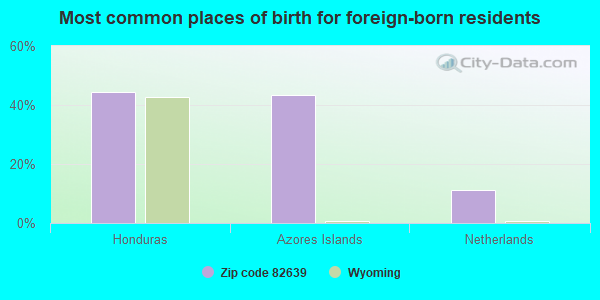
Foreign born population: 106 (12.8%) (100.0% of them are naturalized citizens)
This zip code:
12.8%
Whole state:
3.1%
44%Honduras
43%Azores Islands
11%Netherlands
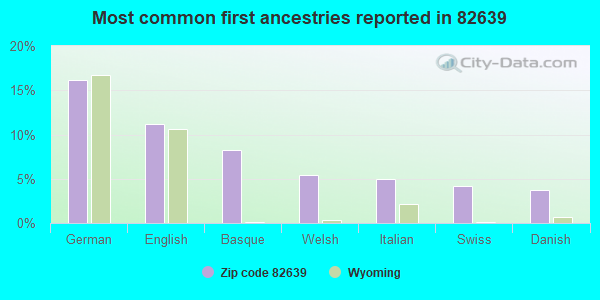
16%German
11%English
8%Basque
5%Welsh
5%Italian
4%Swiss
4%Danish
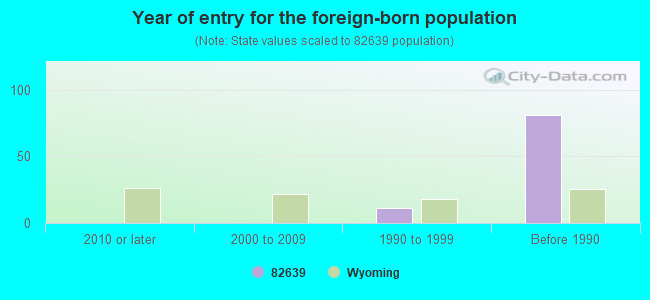
Year of entry for the foreign-born population
02010 or later
02000 to 2009
111990 to 1999
81Before 1990
Facilities with environmental interests located in this zip code:
KAYCEE HIGH SCHOOL (115 HOLT in KAYCEE, WY)
(Geographic Names Information System) (National Center for Education Statistics) - STATE ID-1001056 Organizations: JOHNSON #1 (SCHOOL DISTRICT)
KAYCEE JUNIOR HIGH SCHOOL (115 HOLT in KAYCEE, WY)
(Geographic Names Information System) (National Center for Education Statistics) - STATE ID-1001051 Organizations: JOHNSON #1 (SCHOOL DISTRICT)
KAYCEE ELEMENTARY (214 CENTER in KAYCEE, WY)
(National Center for Education Statistics) - STATE ID-1001003 Organizations: JOHNSON #1 (SCHOOL DISTRICT)
KAYCEE TEXACO (125 NOLAN in KAYCEE, WY)
(Integrated Compliance Information System) - ICIS-08-1994-0344, FORMAL ENFORCEMENT ACTION
KAYCEE WASTEWATER TREATMENT (CITY OF KAYCEE in KAYCEE, WY)
(Integrated Compliance Information System) - ICIS-08-1989-0092, FORMAL ENFORCEMENT ACTION
AT&T MAYOWORTH (7.5 MILES NE OF in MAYOWORTH, WY)
(Resource Conservation and Recovery Act (tracking hazardous waste)) Organizations: AMERICAN TELEPHONE AND TELEGRAPH COMPANY (CONTACT/OWNER)
HIGH PLAINS RESOURCES-PARKMAN RESERVOIR (33 MILES N/E OF KAYCEE in KAYCEE, WY)
ENFORCEMENT/COMPLIANCE ACTIVITY (Integrated Compliance Information System)
Housing units lacking complete plumbing facilities: 14.4% Housing units lacking complete kitchen facilities: 14.1%
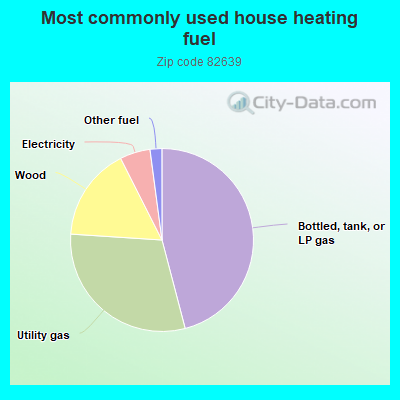
46.2%Bottled, tank, or LP gas
30.3%Utility gas
16.6%Wood
5.4%Electricity
2.1%Other fuel
Population in 1990: 876.
Place of birth for U.S.-born residents:
This state: 531
Northeast: 18
Midwest: 77
South: 25
West: 77
59% of the 82639 zip code residents lived in the same house 5 years ago. Out of people who lived in different houses, 48% lived in this county. Out of people who lived in different counties, 50% lived in Wyoming.
96% of the 82639 zip code residents lived in the same house 1 year ago. Out of people who lived in different houses, 104% moved from different state.
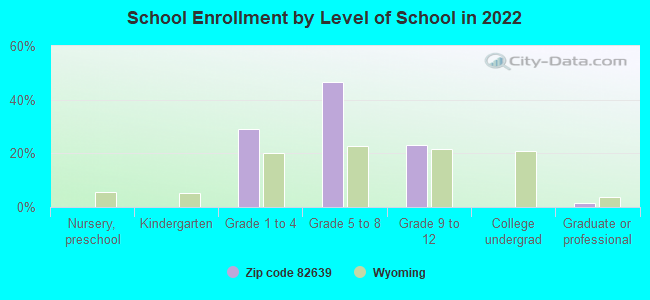
Private vs. public school enrollment:
Students in private schools in grades 1 to 8 (elementary and middle school): 26
Here:
16.0%
Wyoming:
7.3%
Students in private schools in grades 9 to 12 (high school): 20
Here:
42.5%
Wyoming:
6.0%
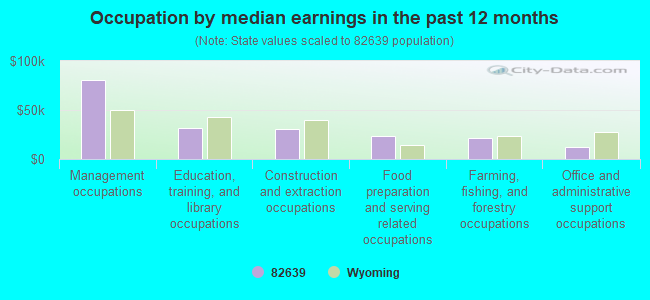
Occupation by median earnings in the past 12 months ($)
80,805Management occupations
31,279Education, training, and library occupations
30,374Construction and extraction occupations
23,223Food preparation and serving related occupations
21,272Farming, fishing, and forestry occupations
12,204Office and administrative support occupations
Top industries in this zip code by the number of employees in 2005:
Mining: Support Activities for Oil and Gas Operations (10-19 employees: 1 establishment)
Accommodation and Food Services: Drinking Places (Alcoholic Beverages) (10-19: 1)
Accommodation and Food Services: Hotels (except Casino Hotels) and Motels (10-19: 1)
Arts, Entertainment, and Recreation: Musical Groups and Artists (5-9: 1)
Mining: Crude Petroleum and Natural Gas Extraction (1-4: 2)
Construction: All Other Specialty Trade Contractors (1-4: 2)
Mining: Construction Sand and Gravel Mining (1-4: 1)
Fatal accident statistics in 2014:
Fatal accident count: 1
Vehicles involved in fatal accidents: 1
Fatal accidents caused by drunken drivers: 1
Fatalities: 1
Persons involved in fatal accidents: 1
Pedestrians involved in fatal accidents: 0
Fatal accident statistics in 2013:
Fatal accident count: 1
Vehicles involved in fatal accidents: 1
Fatal accidents caused by drunken drivers: 1
Fatalities: 1
Persons involved in fatal accidents: 2
Pedestrians involved in fatal accidents: 0
Home Mortgage Disclosure Act Aggregated Statistics For Year 2009 (Based on 4 partial tracts)
A) FHA, FSA/RHS & VA Home Purchase Loans
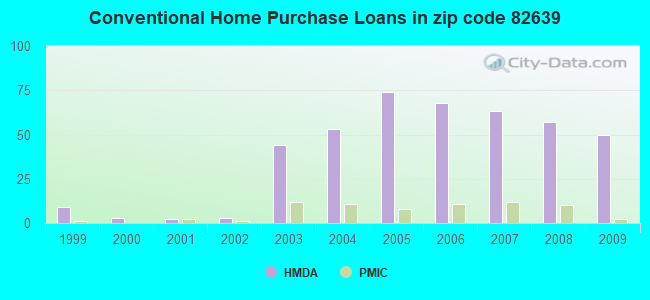
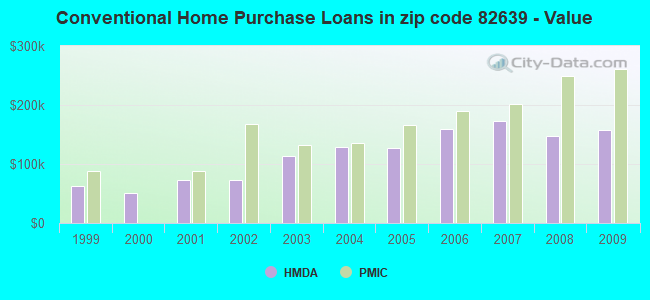
B) Conventional Home Purchase Loans
C) Refinancings
D) Home Improvement Loans
F) Non-occupant Loans on < 5 Family Dwellings (A B C & D)
G) Loans On Manufactured Home Dwelling (A B C & D)
Number
Average Value
Number
Average Value
Number
Average Value
Number
Average Value
Number
Average Value
Number
Average Value
LOANS ORIGINATED
41
$181,896
50
$157,530
97
$188,664
12
$112,202
8
$136,319
9
$127,909
APPLICATIONS APPROVED, NOT ACCEPTED
0
$0
1
$109,780
10
$225,905
0
$0
0
$0
2
$177,145
APPLICATIONS DENIED
4
$175,908
4
$98,178
24
$213,415
4
$36,375
2
$50,265
8
$116,784
APPLICATIONS WITHDRAWN
3
$165,823
3
$170,133
23
$206,545
2
$50,610
2
$107,005
5
$131,660
FILES CLOSED FOR INCOMPLETENESS
1
$114,350
0
$0
2
$156,655
0
$0
0
$0
0
$0
Aggregated Statistics For Year 2008 (Based on 4 partial tracts)
A) FHA, FSA/RHS & VA Home Purchase Loans
B) Conventional Home Purchase Loans
C) Refinancings
D) Home Improvement Loans
F) Non-occupant Loans on < 5 Family Dwellings (A B C & D)
G) Loans On Manufactured Home Dwelling (A B C & D)
Number
Average Value
Number
Average Value
Number
Average Value
Number
Average Value
Number
Average Value
Number
Average Value
LOANS ORIGINATED
24
$172,602
57
$146,672
62
$181,418
14
$112,423
8
$165,692
15
$116,279
APPLICATIONS APPROVED, NOT ACCEPTED
1
$154,600
7
$214,533
5
$145,432
2
$57,065
1
$340,200
3
$74,743
APPLICATIONS DENIED
3
$196,957
10
$221,138
32
$216,201
13
$115,471
2
$365,395
11
$116,576
APPLICATIONS WITHDRAWN
2
$143,780
2
$138,595
13
$214,747
2
$112,510
1
$102,560
2
$122,925
FILES CLOSED FOR INCOMPLETENESS
0
$0
0
$0
3
$225,250
0
$0
0
$0
0
$0
Aggregated Statistics For Year 2007 (Based on 4 partial tracts)
A) FHA, FSA/RHS & VA Home Purchase Loans
B) Conventional Home Purchase Loans
C) Refinancings
D) Home Improvement Loans
F) Non-occupant Loans on < 5 Family Dwellings (A B C & D)
G) Loans On Manufactured Home Dwelling (A B C & D)
Number
Average Value
Number
Average Value
Number
Average Value
Number
Average Value
Number
Average Value
Number
Average Value
LOANS ORIGINATED
5
$190,456
63
$173,508
52
$159,243
19
$77,933
4
$145,950
18
$98,984
APPLICATIONS APPROVED, NOT ACCEPTED
1
$195,090
10
$136,487
8
$127,344
3
$86,307
0
$0
3
$113,730
APPLICATIONS DENIED
2
$136,220
21
$137,478
36
$137,570
18
$89,372
6
$110,880
12
$94,347
APPLICATIONS WITHDRAWN
1
$110,420
13
$168,672
15
$146,877
6
$58,518
1
$124,670
3
$159,007
FILES CLOSED FOR INCOMPLETENESS
0
$0
0
$0
2
$248,005
1
$27,170
0
$0
1
$102,800
Aggregated Statistics For Year 2006 (Based on 4 partial tracts)
A) FHA, FSA/RHS & VA Home Purchase Loans
B) Conventional Home Purchase Loans
C) Refinancings
D) Home Improvement Loans
F) Non-occupant Loans on < 5 Family Dwellings (A B C & D)
G) Loans On Manufactured Home Dwelling (A B C & D)
Number
Average Value
Number
Average Value
Number
Average Value
Number
Average Value
Number
Average Value
Number
Average Value
LOANS ORIGINATED
6
$139,727
68
$159,477
55
$154,592
15
$43,838
15
$165,393
14
$121,592
APPLICATIONS APPROVED, NOT ACCEPTED
1
$90,770
10
$131,267
9
$117,570
3
$45,003
2
$32,565
3
$78,353
APPLICATIONS DENIED
0
$0
20
$154,068
31
$124,007
13
$68,608
2
$65,255
11
$87,116
APPLICATIONS WITHDRAWN
1
$86,160
10
$177,912
19
$142,981
3
$137,487
2
$280,490
1
$153,220
FILES CLOSED FOR INCOMPLETENESS
0
$0
2
$131,560
3
$158,853
1
$37,480
0
$0
0
$0
Aggregated Statistics For Year 2005 (Based on 4 partial tracts)
A) FHA, FSA/RHS & VA Home Purchase Loans
B) Conventional Home Purchase Loans
C) Refinancings
D) Home Improvement Loans
F) Non-occupant Loans on < 5 Family Dwellings (A B C & D)
G) Loans On Manufactured Home Dwelling (A B C & D)
Number
Average Value
Number
Average Value
Number
Average Value
Number
Average Value
Number
Average Value
Number
Average Value
LOANS ORIGINATED
4
$134,432
74
$127,656
60
$144,006
10
$45,709
9
$84,659
18
$106,107
APPLICATIONS APPROVED, NOT ACCEPTED
1
$116,600
12
$113,123
10
$117,816
1
$14,760
2
$93,270
2
$79,070
APPLICATIONS DENIED
0
$0
18
$113,629
48
$136,916
11
$38,127
1
$197,740
10
$85,224
APPLICATIONS WITHDRAWN
1
$160,020
12
$128,277
21
$135,546
2
$109,035
1
$64,610
4
$116,422
FILES CLOSED FOR INCOMPLETENESS
0
$0
4
$120,225
2
$226,140
1
$15,380
0
$0
0
$0
Aggregated Statistics For Year 2004 (Based on 4 partial tracts)
A) FHA, FSA/RHS & VA Home Purchase Loans
B) Conventional Home Purchase Loans
C) Refinancings
D) Home Improvement Loans
F) Non-occupant Loans on < 5 Family Dwellings (A B C & D)
G) Loans On Manufactured Home Dwelling (A B C & D)
Number
Average Value
Number
Average Value
Number
Average Value
Number
Average Value
Number
Average Value
Number
Average Value
LOANS ORIGINATED
3
$135,193
53
$128,948
61
$113,454
11
$53,793
10
$90,392
13
$97,459
APPLICATIONS APPROVED, NOT ACCEPTED
0
$0
6
$117,857
12
$113,623
4
$43,858
0
$0
3
$84,950
APPLICATIONS DENIED
1
$74,870
13
$101,990
44
$108,985
5
$44,276
1
$137,160
14
$87,504
APPLICATIONS WITHDRAWN
0
$0
9
$104,422
25
$112,079
2
$55,490
2
$69,485
3
$112,467
FILES CLOSED FOR INCOMPLETENESS
0
$0
1
$163,230
6
$144,648
1
$114,400
1
$75,790
1
$100,000
Aggregated Statistics For Year 2003 (Based on 4 partial tracts)
A) FHA, FSA/RHS & VA Home Purchase Loans
B) Conventional Home Purchase Loans
C) Refinancings
D) Home Improvement Loans
F) Non-occupant Loans on < 5 Family Dwellings (A B C & D)
Number
Average Value
Number
Average Value
Number
Average Value
Number
Average Value
Number
Average Value
LOANS ORIGINATED
6
$113,552
44
$113,355
92
$115,678
9
$22,539
4
$110,642
APPLICATIONS APPROVED, NOT ACCEPTED
0
$0
4
$91,810
11
$108,535
2
$33,415
0
$0
APPLICATIONS DENIED
0
$0
10
$82,095
38
$97,609
4
$10,872
1
$101,330
APPLICATIONS WITHDRAWN
1
$126,680
2
$116,075
30
$106,130
0
$0
1
$32,820
FILES CLOSED FOR INCOMPLETENESS
0
$0
0
$0
3
$108,267
0
$0
0
$0
Aggregated Statistics For Year 2002 (Based on 2 partial tracts)
A) FHA, FSA/RHS & VA Home Purchase Loans
B) Conventional Home Purchase Loans
C) Refinancings
D) Home Improvement Loans
F) Non-occupant Loans on < 5 Family Dwellings (A B C & D)
Number
Average Value
Number
Average Value
Number
Average Value
Number
Average Value
Number
Average Value
LOANS ORIGINATED
1
$74,880
3
$72,647
9
$89,348
1
$1,610
1
$55,830
APPLICATIONS APPROVED, NOT ACCEPTED
0
$0
1
$113,260
3
$68,980
1
$5,900
0
$0
APPLICATIONS DENIED
0
$0
3
$47,060
4
$74,750
0
$0
0
$0
APPLICATIONS WITHDRAWN
0
$0
0
$0
4
$81,258
0
$0
0
$0
FILES CLOSED FOR INCOMPLETENESS
0
$0
0
$0
1
$43,480
0
$0
0
$0
Aggregated Statistics For Year 2001 (Based on 2 partial tracts)
B) Conventional Home Purchase Loans
C) Refinancings
D) Home Improvement Loans
Number
Average Value
Number
Average Value
Number
Average Value
LOANS ORIGINATED
2
$72,200
7
$68,787
1
$17,980
APPLICATIONS APPROVED, NOT ACCEPTED
1
$41,070
2
$90,720
0
$0
APPLICATIONS DENIED
2
$55,560
7
$94,247
0
$0
APPLICATIONS WITHDRAWN
1
$46,430
4
$64,685
0
$0
FILES CLOSED FOR INCOMPLETENESS
0
$0
1
$66,030
0
$0
Aggregated Statistics For Year 2000 (Based on 2 partial tracts)
B) Conventional Home Purchase Loans
C) Refinancings
D) Home Improvement Loans
F) Non-occupant Loans on < 5 Family Dwellings (A B C & D)
Number
Average Value
Number
Average Value
Number
Average Value
Number
Average Value
LOANS ORIGINATED
3
$51,623
3
$140,373
1
$10,740
0
$0
APPLICATIONS APPROVED, NOT ACCEPTED
1
$52,870
0
$0
1
$13,420
0
$0
APPLICATIONS DENIED
3
$54,127
3
$63,073
1
$17,180
1
$44,550
APPLICATIONS WITHDRAWN
1
$87,770
2
$40,665
0
$0
0
$0
FILES CLOSED FOR INCOMPLETENESS
0
$0
0
$0
0
$0
0
$0
Aggregated Statistics For Year 1999 (Based on 2 partial tracts)
Detailed PMIC statistics for the following Tracts:0014.01
, 0018.00
2002 - 2017 National Fire Incident Reporting System (NFIRS) incidents
Based on the data from the years 2002 - 2017 the average number of fires per year is 7. The highest number of reported fire incidents - 33 took place in 2002, and the least - 0 in 2004. The data has a declining trend.
When looking into fire subcategories, the most incidents belonged to: Outside Fires (61.0%), and Mobile Property/Vehicle Fires (18.6%).
Fire incident types reported to NFIRS in Zip Code 82639


 Nearest zip codes: 82640, 82643, 82635, 82834, 82601, 82648.


 Based on the data from the years 2002 - 2017 the average number of fires per year is 7. The highest number of reported fire incidents - 33 took place in 2002, and the least - 0 in 2004. The data has a declining trend.
 When looking into fire subcategories, the most incidents belonged to: Outside Fires (61.0%), and Mobile Property/Vehicle Fires (18.6%).