Estimated zip code population in 2022: 2,521 Zip code population in 2010: 2,257 Zip code population in 2000: 1,436
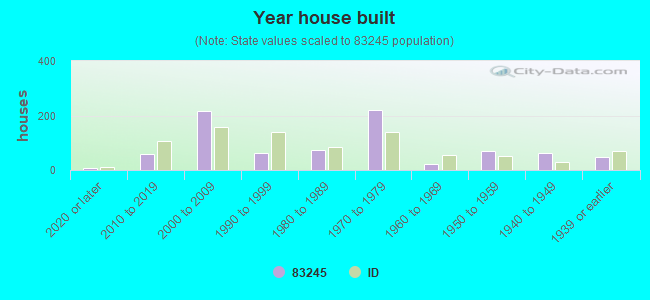
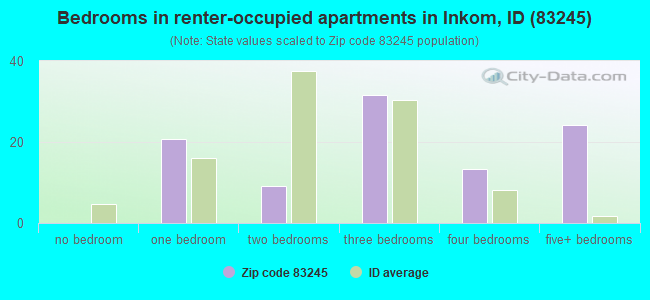
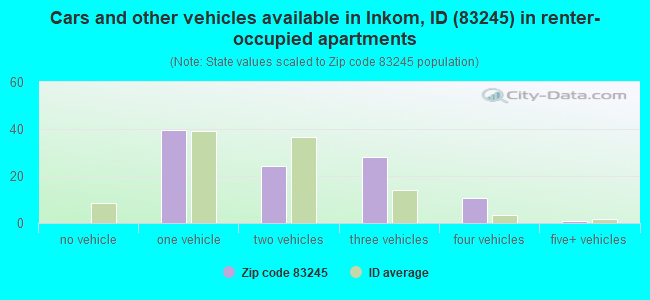
Houses and condos: 860 Renter-occupied apartments: 101
% of renters here:
12%
State:
28%
March 2022 cost of living index in zip code 83245: 87.4 (less than average, U.S. average is 100)
Land area: 105.1 sq. mi. Water area: 0.2 sq. mi.
Population density: 24 people per square mile
(very low).
OSM Map
General Map
Google Map
MSN Map
OSM Map
General Map
Google Map
MSN Map
OSM Map
General Map
Google Map
MSN Map
OSM Map
General Map
Google Map
MSN Map
Please wait while loading the map...
Real estate property taxes paid for housing units in 2022:
This zip code:
0.4% ($1,465)
Idaho:
0.5% ($1,995)
Median real estate property taxes paid for housing units with mortgages in 2022: $2,185 (0.5%) Median real estate property taxes paid for housing units with no mortgage in 2022: $1,115 (0.3%)
Business Search- 14 Million verified businesses
Males: 1,310
(52.0%)
Females: 1,210
(48.0%)
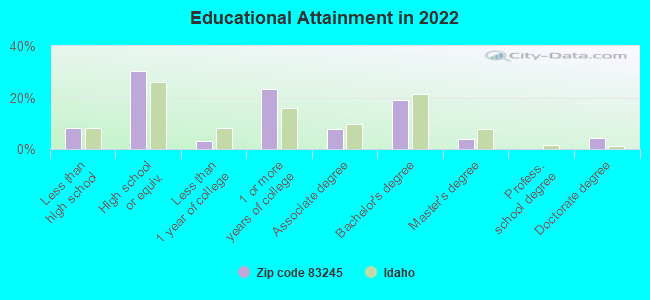
For population 25 years and over in 83245:
High school or higher: 91.8%
Bachelor's degree or higher: 27.3%
Graduate or professional degree: 8.2%
Unemployed: 1.9%
Mean travel time to work (commute): 34.6 minutes
For population 15 years and over in 83245:
Never married: 15.5%
Now married: 68.5%
Separated: 1.0%
Widowed: 4.4%
Divorced: 10.6%
Zip code 83245 compared to state average:
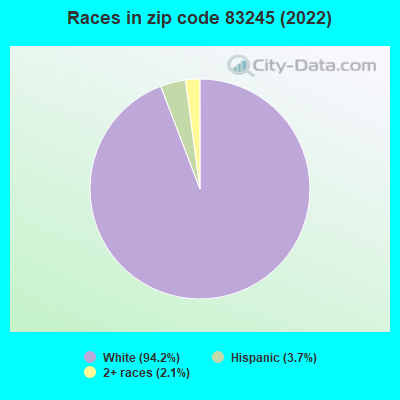
Black race population percentage significantly below state average.
Hispanic race population percentage significantly below state average.
Median age above state average.
Foreign-born population percentage significantly below state average.
Renting percentage significantly below state average.
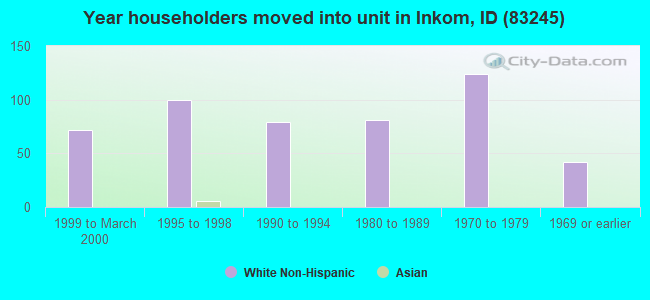
Length of stay since moving in significantly above state average.
Estimated median house/condo value in 2022: $356,721
83245:
$356,721
Idaho:
$432,500
Median resident age:
This zip code:
41.6 years
Idaho median age:
37.5 years
Average household size:
This zip code:
3.0 people
Idaho:
2.6 people
Averages for the 2020 tax year for zip code 83245, filed in 2021:
Average Adjusted Gross Income (AGI) in 2020: $67,875 (Individual Income Tax Returns)
Here:
$67,875
State:
$73,627
Salary/wage: $59,383 (reported on 75.7% of returns)
Here:
$59,383
State:
$55,245
(% of AGI for various income ranges: 1036.8% for AGIs below $25k, 3302.5% for AGIs $25k-50k, 6231.1% for AGIs $50k-75k, 10153.3% for AGIs $75k-100k, 15544.5% for AGIs $100k-200k)
Taxable interest for individuals: $1,324 (reported on 35.9% of returns)
This zip code:
$1,324
Idaho:
$2,230
(% of AGI for various income ranges: 17.3% for AGIs below $25k, 29.4% for AGIs $25k-50k, 90.0% for AGIs $50k-75k, 148.9% for AGIs $75k-100k, 102.7% for AGIs $100k-200k)
Ordinary dividends: $1,847 (reported on 18.4% of returns)
Here:
$1,847
State:
$7,088
(% of AGI for various income ranges: 18.6% for AGIs below $25k, 67.5% for AGIs $25k-50k, 52.2% for AGIs $50k-75k, 38.9% for AGIs $75k-100k, 40.0% for AGIs $100k-200k)
Net capital gain/loss in AGI: +$12,295 (reported on 19.4% of returns)
Here:
+$12,295
State:
+$37,284
(% of AGI for various income ranges: 6.4% for AGIs below $25k, 17.5% for AGIs $25k-50k, 105.6% for AGIs $50k-75k, 433.3% for AGIs $75k-100k, 522.7% for AGIs $100k-200k)
Profit/loss from business: +$8,120 (reported on 19.4% of returns)
Here:
+$8,120
State:
+$12,955
(% of AGI for various income ranges: 110.9% for AGIs below $25k, 193.1% for AGIs $25k-50k, 285.6% for AGIs $50k-75k, 223.3% for AGIs $75k-100k, 557.3% for AGIs $100k-200k)
Taxable individual retirement arrangement distribution: $15,685 (reported on 12.6% of returns)
83245:
$15,685
Idaho:
$20,110
(% of AGI for various income ranges: 94.1% for AGIs below $25k, 192.5% for AGIs $25k-50k, 814.4% for AGIs $50k-75k, 719.1% for AGIs $100k-200k)
Total itemized deductions: $36,322 (reported on 8.7% of returns)
Here:
$36,322
State:
$38,402
(% of AGI for various income ranges: 1278.9% for AGIs $50k-75k, 860.0% for AGIs $100k-200k)
Charity contributions: $14,850 (reported on 7.8% of returns)
Here:
$14,850
State:
$18,314
(% of AGI for various income ranges: 117.5% for AGIs $25k-50k, 334.5% for AGIs $100k-200k)
Taxes paid: $7,378 (reported on 8.7% of returns)
83245:
$7,378
State:
$7,596
(% of AGI for various income ranges: 192.2% for AGIs $50k-75k, 230.0% for AGIs $100k-200k)
Earned income credit: $1,783 (reported on 11.7% of returns)
Here:
$1,783
State:
$2,195
(% of AGI for various income ranges: 61.8% for AGIs below $25k, 48.8% for AGIs $25k-50k)
Percentage of individuals using paid preparers for their 2020 taxes: 96.1%
Here:
96%
State:
94%
(% for various income ranges: 96.8% for AGIs below $25k, 95.5% for AGIs $25k-50k, 93.3% for AGIs $50k-75k, 92.9% for AGIs $75k-100k, 100.0% for AGIs $100k-200k, 100.0% for AGIs over 200k)
Averages for the 2012 tax year for zip code 83245, filed in 2013:
Average Adjusted Gross Income (AGI) in 2012: $55,193 (Individual Income Tax Returns)
Here:
$55,193
State:
$52,536
Salary/wage: $45,869 (reported on 81.3% of returns)
Here:
$45,869
State:
$41,938
(% of AGI for various income ranges: 59.9% for AGIs below $25k, 72.4% for AGIs $25k-50k, 72.9% for AGIs $50k-75k, 83.7% for AGIs $75k-100k, 56.9% for AGIs $100k-200k)
Taxable interest for individuals: $867 (reported on 39.6% of returns)
This zip code:
$867
Idaho:
$1,874
(% of AGI for various income ranges: 1.8% for AGIs below $25k, 0.5% for AGIs $25k-50k, 1.3% for AGIs $50k-75k, 0.3% for AGIs $75k-100k, 0.2% for AGIs $100k-200k)
Ordinary dividends: $1,294 (reported on 17.6% of returns)
Here:
$1,294
State:
$5,706
(% of AGI for various income ranges: 1.2% for AGIs below $25k, 0.3% for AGIs $25k-50k, 0.7% for AGIs $50k-75k, 0.3% for AGIs $100k-200k)
Net capital gain/loss in AGI: +$1,250 (reported on 13.2% of returns)
Here:
+$1,250
State:
+$14,571
(% of AGI for various income ranges: 0.3% for AGIs below $25k, 1.2% for AGIs $50k-75k, 0.2% for AGIs $100k-200k)
Profit/loss from business: +$9,383 (reported on 19.8% of returns)
Here:
+$9,383
State:
+$10,113
(% of AGI for various income ranges: 9.5% for AGIs below $25k, 2.6% for AGIs $25k-50k, 0.2% for AGIs $50k-75k, 1.0% for AGIs $75k-100k, 5.2% for AGIs $100k-200k)
Taxable individual retirement arrangement distribution: $10,510 (reported on 11.0% of returns)
83245:
$10,510
Idaho:
$14,642
(% of AGI for various income ranges: 2.7% for AGIs below $25k, 5.6% for AGIs $25k-50k, 5.8% for AGIs $75k-100k)
Total itemized deductions: $20,792 (24% of AGI, reported on 39.6% of returns)
Here:
$20,792
State:
$22,697
Here:
23.6% of AGI
State:
22.0% of AGI
(% of AGI for various income ranges: 15.0% for AGIs below $25k, 13.1% for AGIs $25k-50k, 13.7% for AGIs $50k-75k, 16.3% for AGIs $75k-100k, 15.5% for AGIs $100k-200k)
Charity contributions: $5,874 (reported on 34.1% of returns)
Here:
$5,874
State:
$5,246
(% of AGI for various income ranges: 2.3% for AGIs below $25k, 2.5% for AGIs $25k-50k, 3.5% for AGIs $50k-75k, 4.5% for AGIs $75k-100k, 3.9% for AGIs $100k-200k)
Taxes paid: $5,766 (reported on 38.5% of returns)
83245:
$5,766
State:
$7,139
(% of AGI for various income ranges: 1.4% for AGIs below $25k, 1.9% for AGIs $25k-50k, 2.9% for AGIs $50k-75k, 4.0% for AGIs $75k-100k, 5.8% for AGIs $100k-200k)
Earned income credit: $2,153 (reported on 16.5% of returns)
Here:
$2,153
State:
$2,213
(% of AGI for various income ranges: 5.9% for AGIs below $25k, 1.4% for AGIs $25k-50k)
Percentage of individuals using paid preparers for their 2012 taxes: 59.3%
Here:
59%
State:
52%
(% for various income ranges: 53.1% for AGIs below $25k, 57.1% for AGIs $25k-50k, 62.5% for AGIs $50k-75k, 63.6% for AGIs $75k-100k, 72.7% for AGIs $100k-200k)
Averages for the 2004 tax year for zip code 83245, filed in 2005:
Average Adjusted Gross Income (AGI) in 2004: $41,310 (Individual Income Tax Returns)
Here:
$41,310
State:
$42,679
Salary/wage: $38,067 (reported on 83.9% of returns)
Here:
$38,067
State:
$35,636
(% of AGI for various income ranges: 115.6% for AGIs below $10k, 72.0% for AGIs $10k-25k, 78.1% for AGIs $25k-50k, 85.0% for AGIs $50k-75k, 78.6% for AGIs $75k-100k, 65.1% for AGIs over 100k)
Taxable interest for individuals: $890 (reported on 49.4% of returns)
This zip code:
$890
Idaho:
$2,024
(% of AGI for various income ranges: 2.0% for AGIs below $10k, 2.7% for AGIs $10k-25k, 1.2% for AGIs $25k-50k, 1.1% for AGIs $50k-75k, 0.5% for AGIs $75k-100k, 0.6% for AGIs over 100k)
Taxable dividends: $775 (reported on 18.4% of returns)
Here:
$775
State:
$2,917
(% of AGI for various income ranges: 4.2% for AGIs below $10k, 0.4% for AGIs $10k-25k, 0.4% for AGIs $25k-50k, 0.2% for AGIs $50k-75k, 0.2% for AGIs $75k-100k, 0.3% for AGIs over 100k)
Net capital gain/loss: +$2,113 (reported on 17.3% of returns)
Here:
+$2,113
State:
+$13,146
(% of AGI for various income ranges: -6.4% for AGIs below $10k, 0.9% for AGIs $10k-25k, 0.5% for AGIs $25k-50k, 0.8% for AGIs $50k-75k, 0.2% for AGIs $75k-100k, 2.6% for AGIs over 100k)
Profit/loss from business: +$4,419 (reported on 19.8% of returns)
Here:
+$4,419
State:
+$8,765
(% of AGI for various income ranges: 18.3% for AGIs below $10k, 5.8% for AGIs $10k-25k, 3.5% for AGIs $25k-50k, -0.8% for AGIs $50k-75k, 0.2% for AGIs $75k-100k, 3.1% for AGIs over 100k)
IRA payment deduction: $3,400 (reported on 2.3% of returns)
83245:
$3,400
Idaho:
$3,020
Total itemized deductions: $18,414 (26% of AGI, reported on 37.0% of returns)
Here:
$18,414
State:
$18,385
Here:
25.8% of AGI
State:
23.1% of AGI
(% of AGI for various income ranges: 10.6% for AGIs $10k-25k, 14.9% for AGIs $25k-50k, 16.9% for AGIs $50k-75k, 17.8% for AGIs $75k-100k, 20.3% for AGIs over 100k)
Charity contributions deductions: $5,420 (7% of AGI, reported on 32.9% of returns)
Here:
$5,420
State:
$3,875
Here:
7.3% of AGI
State:
4.6% of AGI
(% of AGI for various income ranges: 1.5% for AGIs $10k-25k, 2.9% for AGIs $25k-50k, 3.9% for AGIs $50k-75k, 3.6% for AGIs $75k-100k, 8.4% for AGIs over 100k)
Total tax: $5,097 (reported on 73.3% of returns)
83245:
$5,097
State:
$6,282
(% of AGI for various income ranges: 4.2% for AGIs below $10k, 3.8% for AGIs $10k-25k, 5.9% for AGIs $25k-50k, 7.6% for AGIs $50k-75k, 9.3% for AGIs $75k-100k, 16.4% for AGIs over 100k)
Earned income credit: $1,386 (reported on 14.6% of returns)
Here:
$1,386
State:
$1,660
Percentage of individuals using paid preparers for their 2004 taxes: 61.1%
Here:
61%
State:
59%
(% for various income ranges: 55.5% for AGIs below $10k, 56.7% for AGIs $10k-25k, 63.9% for AGIs $25k-50k, 62.9% for AGIs $50k-75k, 61.7% for AGIs $75k-100k, 80.4% for AGIs over 100k)
Household received Food Stamps/SNAP in the past 12 months: 64 Household did not receive Food Stamps/SNAP in the past 12 months: 789
Women who had a birth in the past 12 months: 12 (11 now married, 0 unmarried) Women who did not have a birth in the past 12 months: 421 (255 now married, 168 unmarried)
Housing units in zip code 83245 with a mortgage: 389 (53 second mortgage, 50 both second mortgage and home equity loan) Houses without a mortgage: 7
Median monthly owner costs for units with a mortgage: $1,447 Median monthly owner costs for units without a mortgage: $365
Residents with income below the poverty level in 2022:
This zip code:
3.6%
Whole state:
10.7%
Residents with income below 50% of the poverty level in 2022:
This zip code:
0.9%
Whole state:
6.1%
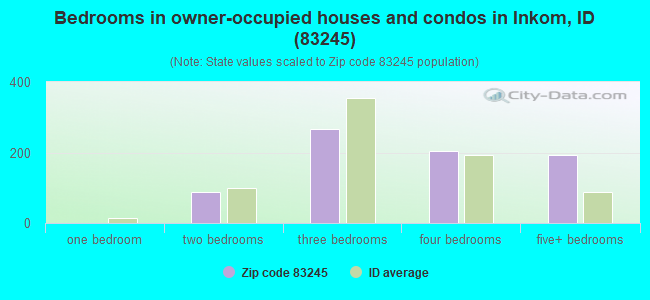
Median number of rooms in houses and condos:
Here:
7.3
State:
6.5
Median number of rooms in apartments:
Here:
5.6
State:
4.4
Notable locations in this zip code not listed on our city pages
Notable locations in zip code 83245: Pebble Creek Ski Area (A), Onyx (B), Inkom Fire Department (C), Pocatello Valley Fire Department Station 1 (D). Display/hide their locations on the map
Creeks: Rapid Creek (A), Sawmill Creek (B), Moonlight Creek (C), Spider Creek (D), McNabb Creek (E), Marsh Creek (F), Upper Rock Creek (G), Webb Creek (H), Lower Rock Creek (I). Display/hide their locations on the map
Size of family households: 385 2-persons, 114 3-persons, 79 4-persons, 53 5-persons, 31 6-persons, 41 7-or-more-persons
Size of nonfamily households: 130 1-person, 14 2-persons
478 married couples with children.
117 single-parent households (29 men, 88 women).
98.7% of residents of 83245 zip code speak English at home.
0.8% of residents speak Spanish at home (85% very well, 15% well).
0.4% of residents speak other Indo-European language at home (100% very well).
Foreign born population: 13 (0.5%) (100.0% of them are naturalized citizens)
This zip code:
0.5%
Whole state:
6.0%
92%France
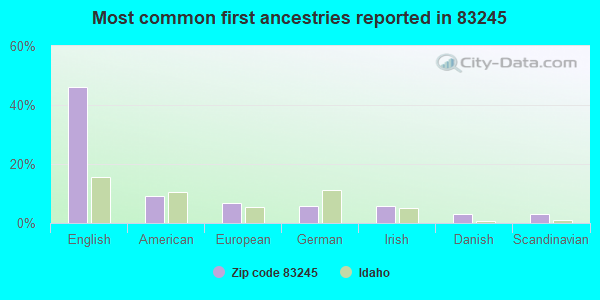
46%English
9%American
7%European
6%German
6%Irish
3%Danish
3%Scandinavian
Year of entry for the foreign-born population
02010 or later
02000 to 2009
01990 to 1999
22Before 1990
Facilities with environmental interests located in this zip code:
INKOM ELEMENTARY SCHOOL (521 HOLSTEIN in INKOM, ID)
(Geographic Names Information System) (National Center for Education Statistics) - STATE ID-021 102 Organizations: MARSH VALLEY JOINT SCHOOL DISTRICT 21 (SCHOOL DISTRICT)
ASH GROVE CEMENT - INKOM IDAHO (230 CEMENT ROAD in INKOM, ID)
AIR MAJOR (AIRS/AFS) COMPLIANCE ACTIVITY (Tracking inspections of insecticide, fungicide, and rodenticide, and toxic substances) CRITERIA AND HAZARDOUS AIR POLLUTANT INVENTORY (Inventory of air pollution sources) Conditionally Exempt Small Quantity Generators, less than 100 kg/month of hazardous waste (Resource Conservation and Recovery Act (tracking hazardous waste)) - notification USED OIL PROGRAM (Resource Conservation and Recovery Act (tracking hazardous waste)) TRI REPORTER (Tracking of toxic chemicals releasing facilities) Business SIC classification: CRUSHED AND BROKEN LIMESTONE; CEMENT, HYDRAULIC Organizations: ASH GROVE CEMENT COMPANY (CONTACT/OWNER)
Alternative names: ASH GROVE CEMENT COMPANY PLANT, ASH GROVE CEMENT INKOM IDAHO 83245
ATT INKOM (5 MI E SE OF INKOM in INKOM, ID)
(Resource Conservation and Recovery Act (tracking hazardous waste)) Organizations: AMERICAN TELEPHONE AND TELEGRA (CONTACT/OWNER)
EGBERT LINDA & JAMES (GREEN CANYON RD & INKOM RD in INKOM, ID)
(Resource Conservation and Recovery Act (tracking hazardous waste)) Organizations: JAMES EGBERT (CONTACT/OWNER)
MINEREC MINING CHEMICALS (PORT OF ENTRY I-15 in INKOM, ID)
(Resource Conservation and Recovery Act (tracking hazardous waste)) Organizations: WALT EDWARDS (CONTACT/OWNER)
NORTHWEST PIPELINE CORP PORTLAND (T7S R36E S21 SE SW in INKOM, ID)
(Resource Conservation and Recovery Act (tracking hazardous waste)) Alternative names: NORTHWEST PIPELINE PORTLAND
INKOM, CITY OF (WWTP) (365 N RAPID CREEK ROAD in INKOM, ID)
National Pollutant Discharge Elimination System NON-MAJOR (Tracking pollutant discharge elimination systems) - permit Business SIC classification: SEWERAGE SYSTEMS
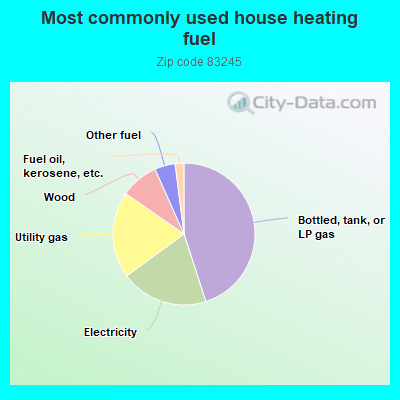
45.2%Bottled, tank, or LP gas
20.0%Electricity
19.8%Utility gas
8.7%Wood
4.7%Other fuel
2.0%Fuel oil, kerosene, etc.
Population in 1990: 823. Population change in the 1990s: +613 (+74.5%).
Place of birth for U.S.-born residents:
This state: 1,429
Northeast: 84
Midwest: 160
South: 124
West: 674
65% of the 83245 zip code residents lived in the same house 5 years ago. Out of people who lived in different houses, 55% lived in this county. Out of people who lived in different counties, 50% lived in Idaho.
82% of the 83245 zip code residents lived in the same house 1 year ago. Out of people who lived in different houses, 77% moved from this county. Out of people who lived in different houses, 11% moved from different state. Out of people who lived in different houses, 7% moved from abroad.
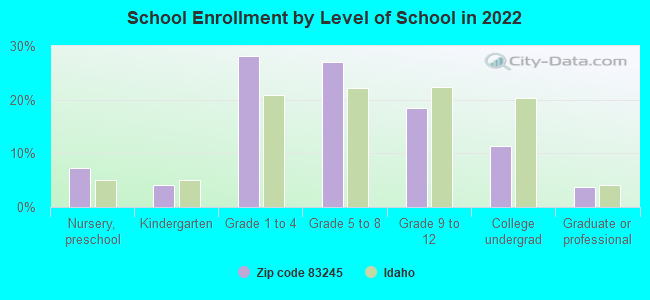
Private vs. public school enrollment:
Students in private schools in grades 1 to 8 (elementary and middle school): 24
Here:
6.7%
Idaho:
13.5%
Students in private schools in grades 9 to 12 (high school): 4
Here:
3.6%
Idaho:
8.5%
Students in private undergraduate colleges: 26
Here:
35.7%
Idaho:
30.0%
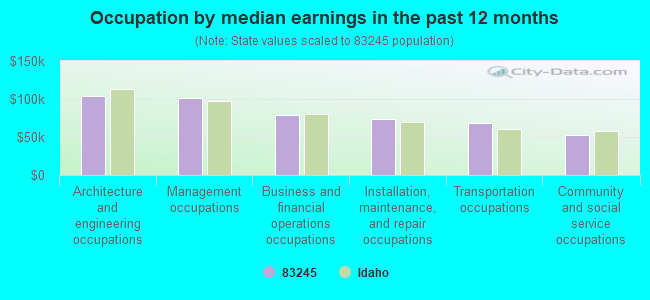
Occupation by median earnings in the past 12 months ($)
104,261Architecture and engineering occupations
101,280Management occupations
78,723Business and financial operations occupations
73,513Installation, maintenance, and repair occupations
68,916Transportation occupations
52,304Community and social service occupations
Companies with federal contracts located in this zip code:
WELLNAM INC (1922 W PORTNEUF RD in INKOM, ID; small business)
$36,519 with Air Force for Water Purification Equipment. Signed on 2005-09-09. Completion date: 2005-11-18.
Top industries in this zip code by the number of employees in 2005:
Arts, Entertainment, and Recreation: Skiing Facilities (50-99 employees: 1 establishment)
Construction: All Other Specialty Trade Contractors (20-49: 1, 5-9: 1, 1-4: 3)
Construction: New Single-Family Housing Construction (except Operative Builders) (20-49: 1, 1-4: 4)
Construction: Plumbing, Heating, and Air-Conditioning Contractors (5-9: 1, 1-4: 1)
Other Services (except Public Administration): Civic and Social Organizations (5-9: 1)
Wholesale Trade: Grain and Field Bean Merchant Wholesalers (1-4: 1)
Construction: Residential Remodelers (1-4: 1)
Fatal accident statistics in 2013:
Fatal accident count: 2
Vehicles involved in fatal accidents: 3
Fatal accidents caused by drunken drivers: 1
Fatalities: 3
Persons involved in fatal accidents: 12
Pedestrians involved in fatal accidents: 0
Fatal accident statistics in 2012:
Fatal accident count: 1
Vehicles involved in fatal accidents: 1
Fatal accidents caused by drunken drivers: 1
Fatalities: 1
Persons involved in fatal accidents: 2
Pedestrians involved in fatal accidents: 0
Home Mortgage Disclosure Act Aggregated Statistics For Year 2009 (Based on 2 partial tracts)
A) FHA, FSA/RHS & VA Home Purchase Loans
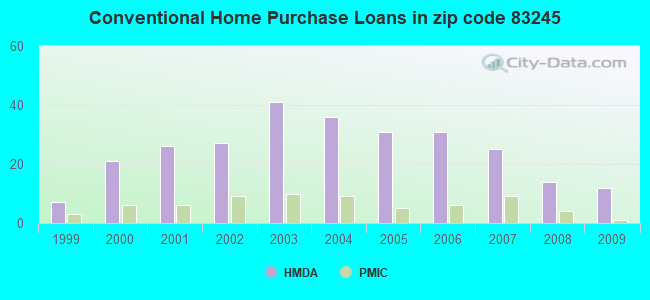
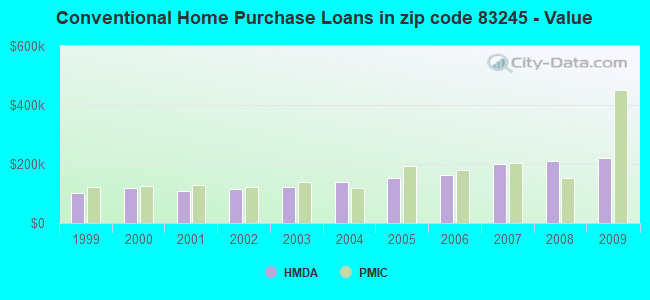
B) Conventional Home Purchase Loans
C) Refinancings
D) Home Improvement Loans
F) Non-occupant Loans on < 5 Family Dwellings (A B C & D)
G) Loans On Manufactured Home Dwelling (A B C & D)
Number
Average Value
Number
Average Value
Number
Average Value
Number
Average Value
Number
Average Value
Number
Average Value
LOANS ORIGINATED
9
$183,133
12
$218,735
81
$195,269
4
$115,498
2
$149,815
2
$136,775
APPLICATIONS APPROVED, NOT ACCEPTED
0
$0
1
$535,790
11
$171,529
0
$0
0
$0
1
$92,990
APPLICATIONS DENIED
3
$155,143
1
$107,260
26
$249,614
4
$94,955
1
$653,870
2
$87,820
APPLICATIONS WITHDRAWN
0
$0
1
$200,240
12
$173,922
0
$0
2
$167,035
0
$0
FILES CLOSED FOR INCOMPLETENESS
0
$0
0
$0
1
$190,400
0
$0
0
$0
0
$0
Aggregated Statistics For Year 2008 (Based on 2 partial tracts)
A) FHA, FSA/RHS & VA Home Purchase Loans
B) Conventional Home Purchase Loans
C) Refinancings
D) Home Improvement Loans
F) Non-occupant Loans on < 5 Family Dwellings (A B C & D)
G) Loans On Manufactured Home Dwelling (A B C & D)
Number
Average Value
Number
Average Value
Number
Average Value
Number
Average Value
Number
Average Value
Number
Average Value
LOANS ORIGINATED
2
$254,855
14
$210,365
41
$236,904
7
$93,550
3
$561,207
1
$107,260
APPLICATIONS APPROVED, NOT ACCEPTED
0
$0
2
$205,165
7
$159,127
0
$0
0
$0
0
$0
APPLICATIONS DENIED
1
$242,560
0
$0
28
$176,259
4
$127,798
0
$0
5
$100,368
APPLICATIONS WITHDRAWN
0
$0
2
$234,440
8
$168,264
1
$221,890
0
$0
1
$168,760
FILES CLOSED FOR INCOMPLETENESS
0
$0
0
$0
4
$341,448
0
$0
0
$0
0
$0
Aggregated Statistics For Year 2007 (Based on 2 partial tracts)
A) FHA, FSA/RHS & VA Home Purchase Loans
B) Conventional Home Purchase Loans
C) Refinancings
D) Home Improvement Loans
F) Non-occupant Loans on < 5 Family Dwellings (A B C & D)
G) Loans On Manufactured Home Dwelling (A B C & D)
Number
Average Value
Number
Average Value
Number
Average Value
Number
Average Value
Number
Average Value
Number
Average Value
LOANS ORIGINATED
1
$174,660
25
$201,287
46
$185,099
8
$81,302
5
$287,328
2
$111,930
APPLICATIONS APPROVED, NOT ACCEPTED
0
$0
4
$162,605
6
$156,128
1
$17,220
0
$0
0
$0
APPLICATIONS DENIED
0
$0
7
$195,886
24
$153,402
7
$76,681
1
$117,590
3
$102,173
APPLICATIONS WITHDRAWN
0
$0
1
$188,440
11
$172,871
2
$85,360
0
$0
0
$0
FILES CLOSED FOR INCOMPLETENESS
0
$0
0
$0
2
$145,140
0
$0
0
$0
0
$0
Aggregated Statistics For Year 2006 (Based on 2 partial tracts)
A) FHA, FSA/RHS & VA Home Purchase Loans
B) Conventional Home Purchase Loans
C) Refinancings
D) Home Improvement Loans
F) Non-occupant Loans on < 5 Family Dwellings (A B C & D)
G) Loans On Manufactured Home Dwelling (A B C & D)
Number
Average Value
Number
Average Value
Number
Average Value
Number
Average Value
Number
Average Value
Number
Average Value
LOANS ORIGINATED
1
$194,830
31
$162,360
43
$147,051
5
$100,466
4
$310,205
3
$76,753
APPLICATIONS APPROVED, NOT ACCEPTED
0
$0
4
$227,058
10
$272,125
2
$123,490
1
$766,040
0
$0
APPLICATIONS DENIED
0
$0
6
$185,730
18
$123,820
5
$92,200
0
$0
4
$82,288
APPLICATIONS WITHDRAWN
0
$0
0
$0
14
$136,776
1
$46,740
0
$0
1
$83,640
FILES CLOSED FOR INCOMPLETENESS
0
$0
1
$134,320
2
$131,365
1
$55,100
0
$0
0
$0
Aggregated Statistics For Year 2005 (Based on 2 partial tracts)
B) Conventional Home Purchase Loans
C) Refinancings
D) Home Improvement Loans
F) Non-occupant Loans on < 5 Family Dwellings (A B C & D)
G) Loans On Manufactured Home Dwelling (A B C & D)
Number
Average Value
Number
Average Value
Number
Average Value
Number
Average Value
Number
Average Value
LOANS ORIGINATED
31
$151,488
44
$140,310
4
$54,490
4
$144,648
3
$94,957
APPLICATIONS APPROVED, NOT ACCEPTED
5
$132,348
6
$217,053
0
$0
1
$128,900
0
$0
APPLICATIONS DENIED
6
$227,550
26
$102,998
7
$81,180
2
$430,990
2
$74,290
APPLICATIONS WITHDRAWN
3
$184,827
17
$143,895
2
$92,990
1
$57,560
1
$123,490
FILES CLOSED FOR INCOMPLETENESS
3
$65,927
5
$172,496
1
$102,340
0
$0
0
$0
Aggregated Statistics For Year 2004 (Based on 2 partial tracts)
A) FHA, FSA/RHS & VA Home Purchase Loans
B) Conventional Home Purchase Loans
C) Refinancings
D) Home Improvement Loans
F) Non-occupant Loans on < 5 Family Dwellings (A B C & D)
G) Loans On Manufactured Home Dwelling (A B C & D)
Number
Average Value
Number
Average Value
Number
Average Value
Number
Average Value
Number
Average Value
Number
Average Value
LOANS ORIGINATED
1
$115,130
36
$138,006
44
$120,171
4
$79,950
4
$123,245
2
$24,110
APPLICATIONS APPROVED, NOT ACCEPTED
0
$0
6
$104,713
8
$87,452
1
$35,420
0
$0
2
$65,190
APPLICATIONS DENIED
1
$105,290
5
$146,714
26
$164,366
2
$82,410
2
$162,360
2
$88,070
APPLICATIONS WITHDRAWN
0
$0
1
$52,150
17
$136,718
0
$0
2
$109,470
1
$94,960
FILES CLOSED FOR INCOMPLETENESS
0
$0
1
$119,560
4
$112,300
1
$290,280
0
$0
0
$0
Aggregated Statistics For Year 2003 (Based on 2 partial tracts)
A) FHA, FSA/RHS & VA Home Purchase Loans
B) Conventional Home Purchase Loans
C) Refinancings
D) Home Improvement Loans
F) Non-occupant Loans on < 5 Family Dwellings (A B C & D)
Number
Average Value
Number
Average Value
Number
Average Value
Number
Average Value
Number
Average Value
LOANS ORIGINATED
4
$84,992
41
$122,808
106
$125,390
3
$66,747
8
$92,742
APPLICATIONS APPROVED, NOT ACCEPTED
1
$97,910
4
$130,750
16
$100,860
1
$43,790
0
$0
APPLICATIONS DENIED
1
$91,020
6
$62,157
34
$144,402
0
$0
0
$0
APPLICATIONS WITHDRAWN
0
$0
4
$144,155
20
$126,592
0
$0
1
$97,420
FILES CLOSED FOR INCOMPLETENESS
0
$0
2
$144,155
1
$151,040
0
$0
1
$224,350
Aggregated Statistics For Year 2002 (Based on 2 partial tracts)
A) FHA, FSA/RHS & VA Home Purchase Loans
B) Conventional Home Purchase Loans
C) Refinancings
D) Home Improvement Loans
F) Non-occupant Loans on < 5 Family Dwellings (A B C & D)
Number
Average Value
Number
Average Value
Number
Average Value
Number
Average Value
Number
Average Value
LOANS ORIGINATED
3
$93,973
27
$115,802
76
$124,690
1
$45,260
6
$99,467
APPLICATIONS APPROVED, NOT ACCEPTED
0
$0
3
$144,483
15
$142,417
0
$0
0
$0
APPLICATIONS DENIED
0
$0
3
$73,473
18
$164,383
3
$19,353
0
$0
APPLICATIONS WITHDRAWN
0
$0
2
$133,580
19
$108,706
1
$27,550
0
$0
FILES CLOSED FOR INCOMPLETENESS
0
$0
1
$74,780
4
$94,710
1
$39,360
0
$0
Aggregated Statistics For Year 2001 (Based on 2 partial tracts)
A) FHA, FSA/RHS & VA Home Purchase Loans
B) Conventional Home Purchase Loans
C) Refinancings
D) Home Improvement Loans
F) Non-occupant Loans on < 5 Family Dwellings (A B C & D)
Number
Average Value
Number
Average Value
Number
Average Value
Number
Average Value
Number
Average Value
LOANS ORIGINATED
1
$169,250
26
$109,054
60
$115,595
4
$17,958
2
$48,215
APPLICATIONS APPROVED, NOT ACCEPTED
0
$0
3
$84,460
7
$159,057
0
$0
0
$0
APPLICATIONS DENIED
0
$0
3
$93,973
24
$110,823
4
$25,830
0
$0
APPLICATIONS WITHDRAWN
0
$0
1
$90,040
13
$121,638
2
$20,665
0
$0
FILES CLOSED FOR INCOMPLETENESS
0
$0
0
$0
4
$99,630
0
$0
0
$0
Aggregated Statistics For Year 2000 (Based on 2 partial tracts)
A) FHA, FSA/RHS & VA Home Purchase Loans
B) Conventional Home Purchase Loans
C) Refinancings
D) Home Improvement Loans
F) Non-occupant Loans on < 5 Family Dwellings (A B C & D)
Number
Average Value
Number
Average Value
Number
Average Value
Number
Average Value
Number
Average Value
LOANS ORIGINATED
2
$106,270
21
$119,415
12
$104,058
3
$14,923
1
$59,530
APPLICATIONS APPROVED, NOT ACCEPTED
0
$0
2
$73,060
4
$118,572
0
$0
0
$0
APPLICATIONS DENIED
0
$0
5
$66,124
9
$66,693
0
$0
0
$0
APPLICATIONS WITHDRAWN
0
$0
2
$70,850
3
$91,513
2
$39,605
0
$0
FILES CLOSED FOR INCOMPLETENESS
0
$0
0
$0
3
$87,577
0
$0
0
$0
Aggregated Statistics For Year 1999 (Based on 1 partial tract)
A) FHA, FSA/RHS & VA Home Purchase Loans
B) Conventional Home Purchase Loans
C) Refinancings
D) Home Improvement Loans
F) Non-occupant Loans on < 5 Family Dwellings (A B C & D)


 Nearest zip codes: 83202, 83250, 83201, 83209, 83217, 83246.