Estimated zip code population in 2022: 2,776 Zip code population in 2010: 1,372 Zip code population in 2000: 651
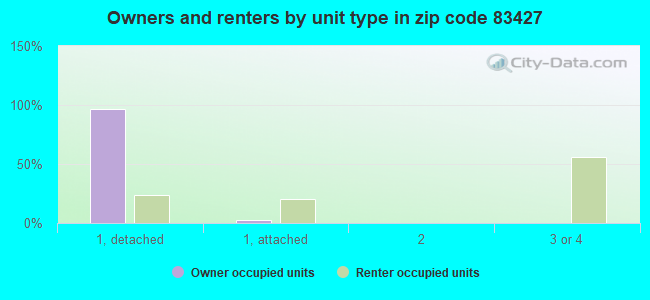
Houses and condos: 988 Renter-occupied apartments: 35
% of renters here:
4%
State:
28%
March 2022 cost of living index in zip code 83427: 91.5 (less than average, U.S. average is 100)
Land area: 0.7 sq. mi. Water area: 0.0 sq. mi.
Population density: 3,714 people per square mile
(average).
OSM Map
General Map
Google Map
MSN Map
OSM Map
General Map
Google Map
MSN Map
OSM Map
General Map
Google Map
MSN Map
OSM Map
General Map
Google Map
MSN Map
Please wait while loading the map...
Real estate property taxes paid for housing units in 2022:
This zip code:
0.4% ($1,743)
Idaho:
0.5% ($1,995)
Median real estate property taxes paid for housing units with mortgages in 2022: $1,834 (0.5%) Median real estate property taxes paid for housing units with no mortgage in 2022: $1,459 (0.3%)
Business Search- 14 Million verified businesses
Males: 1,340
(48.3%)
Females: 1,436
(51.7%)
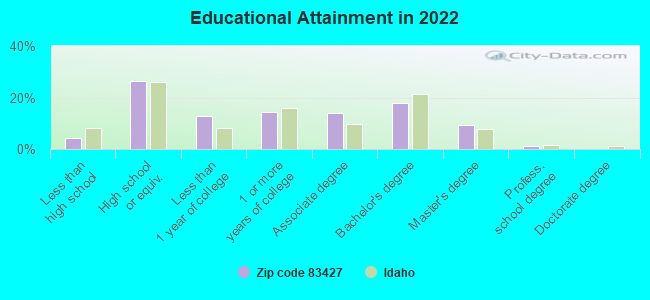
For population 25 years and over in 83427:
High school or higher: 95.0%
Bachelor's degree or higher: 28.1%
Graduate or professional degree: 10.3%
Unemployed: 2.1%
Mean travel time to work (commute): 21.3 minutes
For population 15 years and over in 83427:
Never married: 22.5%
Now married: 66.5%
Separated: 0.7%
Widowed: 5.6%
Divorced: 4.7%
Zip code 83427 compared to state average:
Black race population percentage significantly below state average.
Hispanic race population percentage below state average.
Median age significantly below state average.
Foreign-born population percentage significantly below state average.
Renting percentage significantly below state average.
Length of stay since moving in significantly above state average.
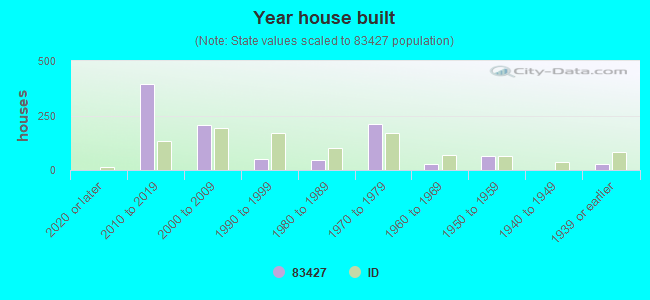
House age below state average.
Number of college students significantly below state average.
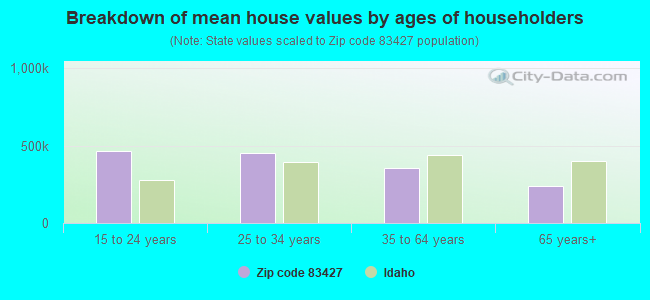
Estimated median house/condo value in 2022: $408,240
83427:
$408,240
Idaho:
$432,500
Median resident age:
This zip code:
26.9 years
Idaho median age:
37.5 years
Average household size:
This zip code:
3.4 people
Idaho:
2.6 people
Averages for the 2020 tax year for zip code 83427, filed in 2021:
Average Adjusted Gross Income (AGI) in 2020: $65,319 (Individual Income Tax Returns)
Here:
$65,319
State:
$73,627
Salary/wage: $59,114 (reported on 83.0% of returns)
Here:
$59,114
State:
$55,245
(% of AGI for various income ranges: 1186.7% for AGIs below $25k, 3564.4% for AGIs $25k-50k, 6796.2% for AGIs $50k-75k, 10028.3% for AGIs $75k-100k, 20544.5% for AGIs $100k-200k)
Taxable interest for individuals: $611 (reported on 25.5% of returns)
This zip code:
$611
Idaho:
$2,230
(% of AGI for various income ranges: 37.2% for AGIs below $25k, 15.0% for AGIs $25k-50k, 23.1% for AGIs $50k-75k, 8.3% for AGIs $75k-100k, 28.2% for AGIs $100k-200k)
Ordinary dividends: $1,764 (reported on 13.2% of returns)
Here:
$1,764
State:
$7,088
(% of AGI for various income ranges: 22.8% for AGIs below $25k, 11.5% for AGIs $50k-75k, 40.8% for AGIs $75k-100k, 129.1% for AGIs $100k-200k)
Net capital gain/loss in AGI: +$9,269 (reported on 12.3% of returns)
Here:
+$9,269
State:
+$37,284
(% of AGI for various income ranges: 17.8% for AGIs below $25k, 111.5% for AGIs $50k-75k, 122.5% for AGIs $75k-100k, 800.9% for AGIs $100k-200k)
Profit/loss from business: +$7,355 (reported on 18.9% of returns)
Here:
+$7,355
State:
+$12,955
(% of AGI for various income ranges: 161.7% for AGIs below $25k, 143.9% for AGIs $25k-50k, 109.2% for AGIs $50k-75k, 356.7% for AGIs $75k-100k, 319.1% for AGIs $100k-200k)
Taxable individual retirement arrangement distribution: $15,900 (reported on 8.5% of returns)
83427:
$15,900
Idaho:
$20,110
(% of AGI for various income ranges: 97.2% for AGIs below $25k, 166.7% for AGIs $25k-50k, 796.7% for AGIs $75k-100k)
Total itemized deductions: $32,025 (reported on 7.5% of returns)
Here:
$32,025
State:
$38,402
(% of AGI for various income ranges: 520.8% for AGIs $50k-75k, 1713.6% for AGIs $100k-200k)
Charity contributions: $13,675 (reported on 7.5% of returns)
Here:
$13,675
State:
$18,314
(% of AGI for various income ranges: 126.2% for AGIs $50k-75k, 845.5% for AGIs $100k-200k)
Taxes paid: $7,575 (reported on 7.5% of returns)
83427:
$7,575
State:
$7,596
(% of AGI for various income ranges: 113.1% for AGIs $50k-75k, 417.3% for AGIs $100k-200k)
Earned income credit: $2,507 (reported on 13.2% of returns)
Here:
$2,507
State:
$2,195
(% of AGI for various income ranges: 80.0% for AGIs below $25k, 115.0% for AGIs $25k-50k)
Percentage of individuals using paid preparers for their 2020 taxes: 95.3%
Here:
95%
State:
94%
(% for various income ranges: 96.3% for AGIs below $25k, 91.7% for AGIs $25k-50k, 94.4% for AGIs $50k-75k, 94.1% for AGIs $75k-100k, 100.0% for AGIs $100k-200k, 100.0% for AGIs over 200k)
Averages for the 2012 tax year for zip code 83427, filed in 2013:
Average Adjusted Gross Income (AGI) in 2012: $47,793 (Individual Income Tax Returns)
Here:
$47,793
State:
$52,536
Salary/wage: $43,841 (reported on 86.3% of returns)
Here:
$43,841
State:
$41,938
(% of AGI for various income ranges: 70.3% for AGIs below $25k, 80.4% for AGIs $25k-50k, 82.0% for AGIs $50k-75k, 84.9% for AGIs $75k-100k, 73.8% for AGIs $100k-200k)
Taxable interest for individuals: $382 (reported on 30.1% of returns)
This zip code:
$382
Idaho:
$1,874
(% of AGI for various income ranges: 0.5% for AGIs below $25k, 0.4% for AGIs $25k-50k, 0.2% for AGIs $50k-75k, 0.1% for AGIs $75k-100k, 0.2% for AGIs $100k-200k)
Ordinary dividends: $888 (reported on 11.0% of returns)
Here:
$888
State:
$5,706
Profit/loss from business: +$5,021 (reported on 19.2% of returns)
Here:
+$5,021
State:
+$10,113
(% of AGI for various income ranges: 6.4% for AGIs below $25k, 2.5% for AGIs $25k-50k, 1.5% for AGIs $50k-75k, 3.2% for AGIs $75k-100k)
Taxable individual retirement arrangement distribution: $9,160 (reported on 6.8% of returns)
83427:
$9,160
Idaho:
$14,642
Total itemized deductions: $19,337 (26% of AGI, reported on 41.1% of returns)
Here:
$19,337
State:
$22,697
Here:
25.8% of AGI
State:
22.0% of AGI
(% of AGI for various income ranges: 16.3% for AGIs $25k-50k, 18.7% for AGIs $50k-75k, 17.0% for AGIs $75k-100k, 19.6% for AGIs $100k-200k)
Charity contributions: $5,938 (reported on 35.6% of returns)
Here:
$5,938
State:
$5,246
(% of AGI for various income ranges: 4.1% for AGIs $25k-50k, 4.8% for AGIs $50k-75k, 4.1% for AGIs $75k-100k, 5.9% for AGIs $100k-200k)
Taxes paid: $4,680 (reported on 41.1% of returns)
83427:
$4,680
State:
$7,139
(% of AGI for various income ranges: 2.6% for AGIs $25k-50k, 4.1% for AGIs $50k-75k, 4.9% for AGIs $75k-100k, 5.8% for AGIs $100k-200k)
Earned income credit: $2,392 (reported on 17.8% of returns)
Here:
$2,392
State:
$2,213
(% of AGI for various income ranges: 6.4% for AGIs below $25k, 1.9% for AGIs $25k-50k)
Percentage of individuals using paid preparers for their 2012 taxes: 53.4%
Here:
53%
State:
52%
(% for various income ranges: 45.8% for AGIs below $25k, 55.6% for AGIs $25k-50k, 52.9% for AGIs $50k-75k, 57.1% for AGIs $75k-100k, 71.4% for AGIs $100k-200k)
Averages for the 2004 tax year for zip code 83427, filed in 2005:
Average Adjusted Gross Income (AGI) in 2004: $35,048 (Individual Income Tax Returns)
Here:
$35,048
State:
$42,679
Salary/wage: $33,585 (reported on 85.9% of returns)
Here:
$33,585
State:
$35,636
(% of AGI for various income ranges: 143.5% for AGIs below $10k, 75.9% for AGIs $10k-25k, 81.0% for AGIs $25k-50k, 89.0% for AGIs $50k-75k, 81.6% for AGIs $75k-100k, 65.3% for AGIs over 100k)
Taxable interest for individuals: $667 (reported on 40.2% of returns)
This zip code:
$667
Idaho:
$2,024
(% of AGI for various income ranges: 6.6% for AGIs below $10k, 1.6% for AGIs $10k-25k, 1.2% for AGIs $25k-50k, 0.1% for AGIs $50k-75k, 0.2% for AGIs $75k-100k, 0.4% for AGIs over 100k)
Taxable dividends: $438 (reported on 11.7% of returns)
Here:
$438
State:
$2,917
(% of AGI for various income ranges: 0.2% for AGIs $10k-25k, 0.1% for AGIs $25k-50k, 0.3% for AGIs $50k-75k, 0.2% for AGIs $75k-100k)
Net capital gain/loss: +$3,677 (reported on 11.9% of returns)
Here:
+$3,677
State:
+$13,146
(% of AGI for various income ranges: 4.5% for AGIs below $10k, 3.0% for AGIs $25k-50k, 0.2% for AGIs $50k-75k, 1.0% for AGIs $75k-100k)
Profit/loss from business: +$1,992 (reported on 23.9% of returns)
Here:
+$1,992
State:
+$8,765
(% of AGI for various income ranges: 11.7% for AGIs below $10k, 6.8% for AGIs $10k-25k, 1.5% for AGIs $25k-50k, -0.3% for AGIs $50k-75k, 0.1% for AGIs $75k-100k)
Total itemized deductions: $16,025 (27% of AGI, reported on 36.7% of returns)
Here:
$16,025
State:
$18,385
Here:
27.5% of AGI
State:
23.1% of AGI
(% of AGI for various income ranges: 11.2% for AGIs $10k-25k, 15.5% for AGIs $25k-50k, 18.6% for AGIs $50k-75k, 19.7% for AGIs $75k-100k, 19.5% for AGIs over 100k)
Charity contributions deductions: $4,906 (8% of AGI, reported on 33.2% of returns)
Here:
$4,906
State:
$3,875
Here:
8.3% of AGI
State:
4.6% of AGI
(% of AGI for various income ranges: 2.9% for AGIs $10k-25k, 4.2% for AGIs $25k-50k, 4.9% for AGIs $50k-75k, 6.4% for AGIs $75k-100k, 5.2% for AGIs over 100k)
Total tax: $3,299 (reported on 72.3% of returns)
83427:
$3,299
State:
$6,282
(% of AGI for various income ranges: 4.5% for AGIs below $10k, 4.0% for AGIs $10k-25k, 5.1% for AGIs $25k-50k, 6.5% for AGIs $50k-75k, 8.4% for AGIs $75k-100k, 13.0% for AGIs over 100k)
Earned income credit: $1,966 (reported on 16.0% of returns)
Here:
$1,966
State:
$1,660
Percentage of individuals using paid preparers for their 2004 taxes: 62.8%
Here:
63%
State:
59%
(% for various income ranges: 54.5% for AGIs below $10k, 64.2% for AGIs $10k-25k, 64.3% for AGIs $25k-50k, 62.9% for AGIs $50k-75k, 71.1% for AGIs $75k-100k, 76.5% for AGIs over 100k)
Household received Food Stamps/SNAP in the past 12 months: 83 Household did not receive Food Stamps/SNAP in the past 12 months: 727
Women who had a birth in the past 12 months: 50 (31 now married, 20 unmarried) Women who did not have a birth in the past 12 months: 569 (421 now married, 153 unmarried)
Housing units in zip code 83427 with a mortgage: 623 (15 second mortgage, 11 both second mortgage and home equity loan) Median monthly owner costs for units with a mortgage: $1,467 Median monthly owner costs for units without a mortgage: $349
Residents with income below the poverty level in 2022:
This zip code:
4.8%
Whole state:
10.7%
Residents with income below 50% of the poverty level in 2022:
This zip code:
2.5%
Whole state:
6.1%
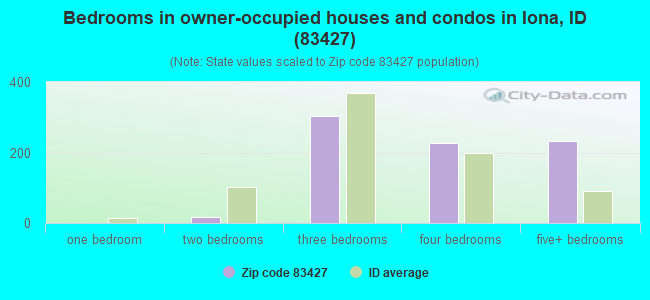
Median number of rooms in houses and condos:
Here:
7.1
State:
6.5
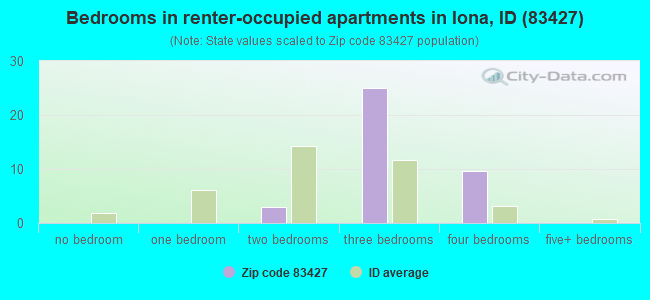
Median number of rooms in apartments:
Here:
4.4
State:
4.4
Notable locations in this zip code not listed on our city pages
Size of family households: 188 2-persons, 61 3-persons, 154 4-persons, 139 5-persons, 71 6-persons, 32 7-or-more-persons
Size of nonfamily households: 143 1-person, 18 2-persons
1,096 married couples with children.
59 single-parent households (10 men, 49 women).
95.4% of residents of 83427 zip code speak English at home.
2.2% of residents speak Spanish at home (100% very well).
0.4% of residents speak other Indo-European language at home (100% very well).
1.3% of residents speak Asian or Pacific Island language at home (100% very well).
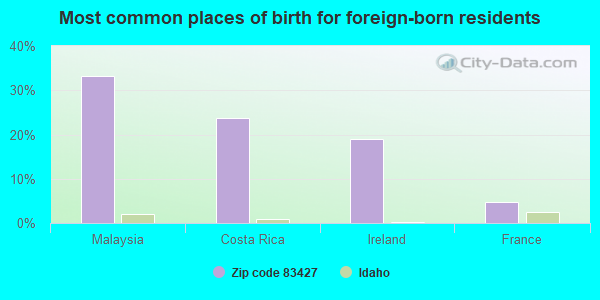
Foreign born population: 23 (0.8%) (77.2% of them are naturalized citizens)
This zip code:
0.8%
Whole state:
6.0%
33%Malaysia
24%Costa Rica
19%Ireland
5%France
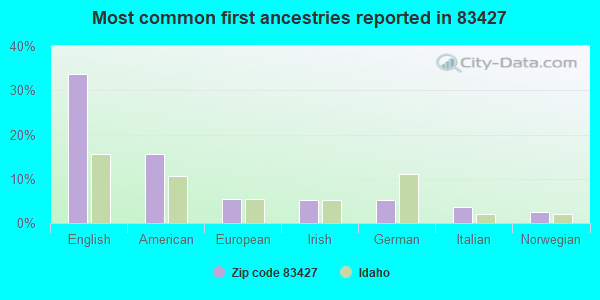
34%English
16%American
5%European
5%Irish
5%German
4%Italian
2%Norwegian
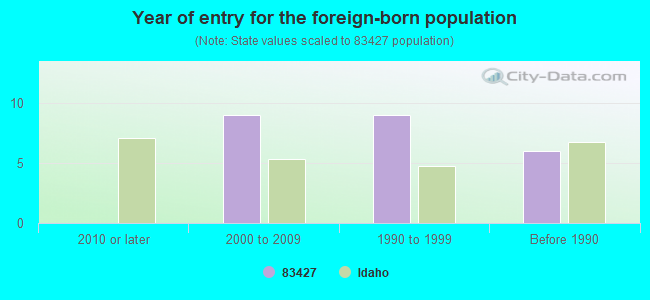
Year of entry for the foreign-born population
02010 or later
92000 to 2009
91990 to 1999
6Before 1990
Facilities with environmental interests located in this zip code:
IONA ELEMENTARY SCHOOL (5338 OWEN AVENUE in IONA, ID)
(Geographic Names Information System) (National Center for Education Statistics) - STATE ID-093 101 Organizations: BONNEVILLE JOINT SCHOOL DISTRICT 93 (SCHOOL DISTRICT)
CARGILL INC (IONA RD in IONA, ID)
AIR MINOR (AIRS/AFS) Business SIC classification: GRAIN AND FIELD BEANS
Housing units lacking complete plumbing facilities: 12.4% Housing units lacking complete kitchen facilities: 9.1%
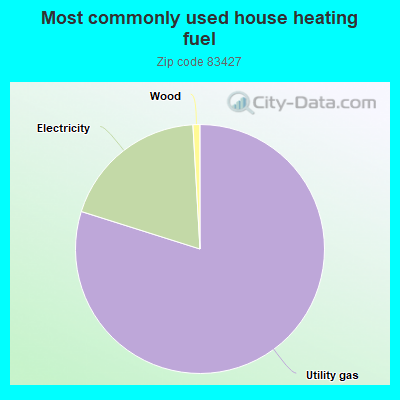
79.8%Utility gas
19.2%Electricity
0.9%Wood
Population in 1990: 1,491.
Place of birth for U.S.-born residents:
This state: 1,695
Northeast: 91
Midwest: 46
South: 255
West: 640
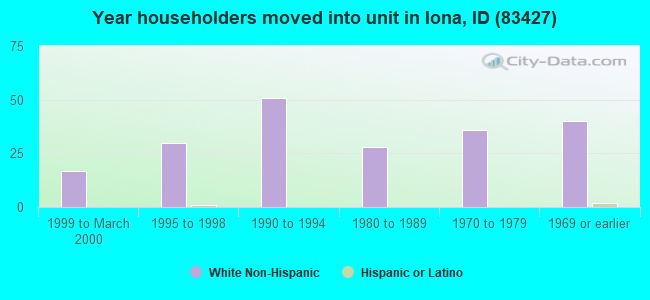
79% of the 83427 zip code residents lived in the same house 5 years ago. Out of people who lived in different houses, 66% lived in this county. Out of people who lived in different counties, 50% lived in Idaho.
93% of the 83427 zip code residents lived in the same house 1 year ago. Out of people who lived in different houses, 21% moved from this county. Out of people who lived in different houses, 15% moved from different county within same state. Out of people who lived in different houses, 70% moved from different state.
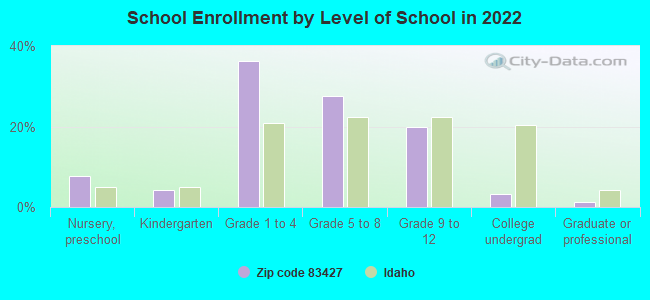
Private vs. public school enrollment:
Students in private schools in grades 1 to 8 (elementary and middle school): 60
Here:
10.3%
Idaho:
13.5%
Students in private schools in grades 9 to 12 (high school): 3
Here:
1.6%
Idaho:
8.5%
Students in private undergraduate colleges: 4
Here:
16.1%
Idaho:
30.0%
Occupation by median earnings in the past 12 months ($)
141,149Installation, maintenance, and repair occupations
102,000Computer and mathematical occupations
96,180Law enforcement workers including supervisors
85,598Health technologists and technicians
76,261Architecture and engineering occupations
71,185Health diagnosing and treating practitioners and other technical occupations
Top industries in this zip code by the number of employees in 2005:
Construction: Commercial and Institutional Building Construction (10-19 employees: 1 establishment)
Professional, Scientific, and Technical Services: Tax Preparation Services (10-19: 1)
Accommodation and Food Services: Full-Service Restaurants (10-19: 1)
Health Care and Social Assistance: Offices of Physical, Occupational and Speech Therapists, and Audiologists (1-4: 1)
Construction: Drywall and Insulation Contractors (1-4: 1)
Construction: Siding Contractors (1-4: 1)
Administrative and Support and Waste Management and Remediation Services: Landscaping Services (1-4: 1)
Home Mortgage Disclosure Act Aggregated Statistics For Year 2009 (Based on 4 partial tracts)
A) FHA, FSA/RHS & VA Home Purchase Loans
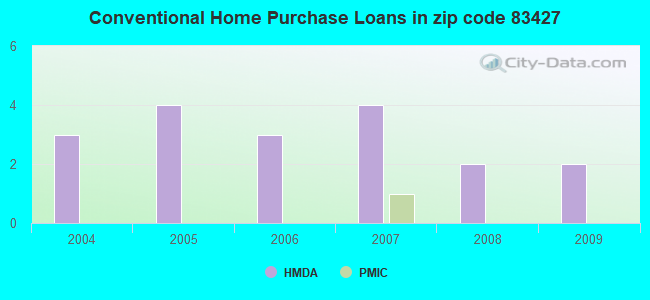
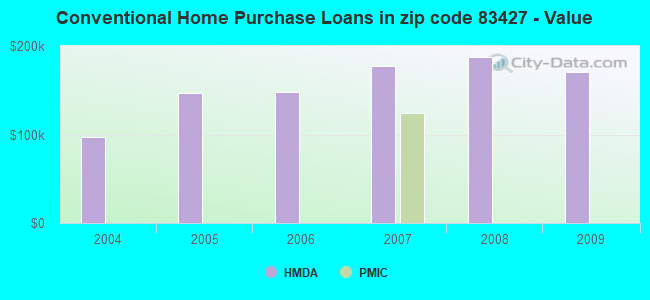
B) Conventional Home Purchase Loans
C) Refinancings
F) Non-occupant Loans on < 5 Family Dwellings (A B C & D)
Number
Average Value
Number
Average Value
Number
Average Value
Number
Average Value
LOANS ORIGINATED
2
$146,520
2
$170,265
8
$173,000
1
$170,060
APPLICATIONS APPROVED, NOT ACCEPTED
0
$0
0
$0
2
$170,715
0
$0
APPLICATIONS DENIED
0
$0
0
$0
3
$191,857
0
$0
APPLICATIONS WITHDRAWN
0
$0
0
$0
2
$144,585
0
$0
FILES CLOSED FOR INCOMPLETENESS
0
$0
0
$0
0
$0
0
$0
Aggregated Statistics For Year 2008 (Based on 4 partial tracts)
A) FHA, FSA/RHS & VA Home Purchase Loans
B) Conventional Home Purchase Loans
C) Refinancings
D) Home Improvement Loans
Number
Average Value
Number
Average Value
Number
Average Value
Number
Average Value
LOANS ORIGINATED
1
$128,660
2
$188,125
4
$151,852
1
$40,000
APPLICATIONS APPROVED, NOT ACCEPTED
0
$0
0
$0
1
$150,410
0
$0
APPLICATIONS DENIED
0
$0
0
$0
2
$236,040
1
$80,450
APPLICATIONS WITHDRAWN
0
$0
0
$0
1
$188,300
0
$0
FILES CLOSED FOR INCOMPLETENESS
0
$0
0
$0
0
$0
0
$0
Aggregated Statistics For Year 2007 (Based on 4 partial tracts)
B) Conventional Home Purchase Loans
C) Refinancings
D) Home Improvement Loans
F) Non-occupant Loans on < 5 Family Dwellings (A B C & D)
Number
Average Value
Number
Average Value
Number
Average Value
Number
Average Value
LOANS ORIGINATED
4
$177,718
3
$187,227
1
$42,350
1
$193,290
APPLICATIONS APPROVED, NOT ACCEPTED
1
$102,540
1
$59,320
0
$0
0
$0
APPLICATIONS DENIED
1
$232,490
2
$188,235
1
$20,520
0
$0
APPLICATIONS WITHDRAWN
1
$98,660
1
$166,250
0
$0
0
$0
FILES CLOSED FOR INCOMPLETENESS
0
$0
0
$0
0
$0
0
$0
Aggregated Statistics For Year 2006 (Based on 4 partial tracts)
B) Conventional Home Purchase Loans
C) Refinancings
D) Home Improvement Loans
F) Non-occupant Loans on < 5 Family Dwellings (A B C & D)
Number
Average Value
Number
Average Value
Number
Average Value
Number
Average Value
LOANS ORIGINATED
3
$147,977
3
$139,460
1
$27,370
1
$108,030
APPLICATIONS APPROVED, NOT ACCEPTED
0
$0
1
$57,880
0
$0
0
$0
APPLICATIONS DENIED
1
$82,230
2
$97,435
1
$32,800
0
$0
APPLICATIONS WITHDRAWN
0
$0
1
$121,750
0
$0
0
$0
FILES CLOSED FOR INCOMPLETENESS
0
$0
0
$0
0
$0
0
$0
Aggregated Statistics For Year 2005 (Based on 4 partial tracts)
B) Conventional Home Purchase Loans
C) Refinancings
F) Non-occupant Loans on < 5 Family Dwellings (A B C & D)
Number
Average Value
Number
Average Value
Number
Average Value
LOANS ORIGINATED
4
$146,548
4
$121,885
1
$254,960
APPLICATIONS APPROVED, NOT ACCEPTED
0
$0
1
$65,170
0
$0
APPLICATIONS DENIED
1
$75,880
2
$107,775
0
$0
APPLICATIONS WITHDRAWN
0
$0
1
$167,610
0
$0
FILES CLOSED FOR INCOMPLETENESS
0
$0
0
$0
0
$0
Aggregated Statistics For Year 2004 (Based on 4 partial tracts)

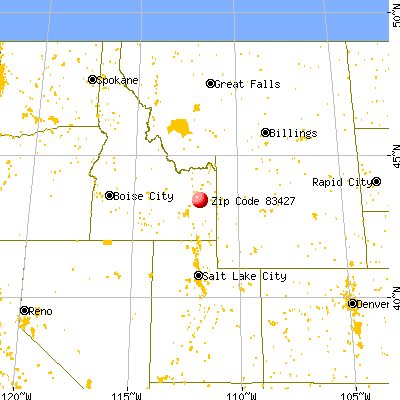


 Nearest zip codes: 83401, 83454, 83404, 83406, 83442, 83431.