Estimated zip code population in 2022: 549 Zip code population in 2010: 416 Zip code population in 2000: 242
Houses and condos: 512 Renter-occupied apartments: 14
% of renters here:
6%
State:
28%
March 2022 cost of living index in zip code 83428: 90.1 (less than average, U.S. average is 100)
Land area: 215.0 sq. mi. Water area: 7.0 sq. mi.
Population density: 3 people per square mile
(very low).
OSM Map
General Map
Google Map
MSN Map
OSM Map
General Map
Google Map
MSN Map
OSM Map
General Map
Google Map
MSN Map
OSM Map
General Map
Google Map
MSN Map
Please wait while loading the map...
Real estate property taxes paid for housing units in 2022:
This zip code:
0.2% ($1,516)
Idaho:
0.5% ($1,995)
Median real estate property taxes paid for housing units with mortgages in 2022: $2,316 (0.4%) Median real estate property taxes paid for housing units with no mortgage in 2022: $1,408 (0.2%)
Business Search- 14 Million verified businesses
Males: 267
(48.8%)
Females: 281
(51.2%)
For population 25 years and over in 83428:
High school or higher: 99.0%
Bachelor's degree or higher: 32.8%
Graduate or professional degree: 5.7%
Unemployed: 24.6%
Mean travel time to work (commute): 31.5 minutes
For population 15 years and over in 83428:
Never married: 6.3%
Now married: 82.1%
Separated: 0.8%
Widowed: 4.8%
Divorced: 6.0%
Zip code 83428 compared to state average:
Median house value above state average.
Unemployed percentage significantly above state average.
Black race population percentage significantly below state average.
Hispanic race population percentage significantly below state average.
Median age significantly above state average.
Foreign-born population percentage significantly below state average.
Renting percentage significantly below state average.
Length of stay since moving in significantly above state average.
Estimated median house/condo value in 2022: $670,532
83428:
$670,532
Idaho:
$432,500
Median resident age:
This zip code:
57.4 years
Idaho median age:
37.5 years
Average household size:
This zip code:
2.4 people
Idaho:
2.6 people
Averages for the 2020 tax year for zip code 83428, filed in 2021:
Average Adjusted Gross Income (AGI) in 2020: $58,279 (Individual Income Tax Returns)
Here:
$58,279
State:
$73,627
Salary/wage: $43,065 (reported on 70.8% of returns)
Here:
$43,065
State:
$55,245
(% of AGI for various income ranges: 1280.0% for AGIs below $25k, 3560.0% for AGIs $25k-50k, 12480.0% for AGIs $50k-75k)
Taxable interest for individuals: $517 (reported on 25.0% of returns)
This zip code:
$517
Idaho:
$2,230
(% of AGI for various income ranges: 18.0% for AGIs below $25k, 73.3% for AGIs $75k-100k)
Ordinary dividends: $1,475 (reported on 16.7% of returns)
Here:
$1,475
State:
$7,088
(% of AGI for various income ranges: 196.7% for AGIs $75k-100k)
Net capital gain/loss in AGI: +$25,460 (reported on 20.8% of returns)
Here:
+$25,460
State:
+$37,284
(% of AGI for various income ranges: 4243.3% for AGIs $75k-100k)
Profit/loss from business: +$125 (reported on 16.7% of returns)
Here:
+$125
State:
+$12,955
(% of AGI for various income ranges: 25.0% for AGIs $50k-75k)
Taxable individual retirement arrangement distribution: $15,667 (reported on 12.5% of returns)
83428:
$15,667
Idaho:
$20,110
(% of AGI for various income ranges: 2350.0% for AGIs $50k-75k)
Earned income credit: $1,167 (reported on 12.5% of returns)
Here:
$1,167
State:
$2,195
(% of AGI for various income ranges: 70.0% for AGIs below $25k)
Percentage of individuals using paid preparers for their 2020 taxes: 87.5%
Here:
88%
State:
94%
(% for various income ranges: 87.5% for AGIs below $25k, 80.0% for AGIs $25k-50k, 75.0% for AGIs $50k-75k, 100.0% for AGIs $75k-100k, 100.0% for AGIs $100k-200k)
Averages for the 2012 tax year for zip code 83428, filed in 2013:
Average Adjusted Gross Income (AGI) in 2012: $46,276 (Individual Income Tax Returns)
Here:
$46,276
State:
$52,536
Salary/wage: $32,423 (reported on 76.5% of returns)
Here:
$32,423
State:
$41,938
(% of AGI for various income ranges: 52.4% for AGIs below $25k, 68.1% for AGIs $25k-50k, 55.5% for AGIs $50k-75k, 47.1% for AGIs $75k-100k)
Taxable interest for individuals: $686 (reported on 41.2% of returns)
This zip code:
$686
Idaho:
$1,874
Ordinary dividends: $2,450 (reported on 11.8% of returns)
Here:
$2,450
State:
$5,706
Net capital gain/loss in AGI: +$23,100 (reported on 11.8% of returns)
Here:
+$23,100
State:
+$14,571
Profit/loss from business: +$1,133 (reported on 17.6% of returns)
Here:
+$1,133
State:
+$10,113
Taxable individual retirement arrangement distribution: $7,050 (reported on 11.8% of returns)
83428:
$7,050
Idaho:
$14,642
Total itemized deductions: $21,367 (28% of AGI, reported on 35.3% of returns)
Here:
$21,367
State:
$22,697
Here:
28.3% of AGI
State:
22.0% of AGI
Charity contributions: $2,275 (reported on 23.5% of returns)
Here:
$2,275
State:
$5,246
Taxes paid: $4,500 (reported on 35.3% of returns)
83428:
$4,500
State:
$7,139
Earned income credit: $1,533 (reported on 17.6% of returns)
Here:
$1,533
State:
$2,213
(% of AGI for various income ranges: 5.5% for AGIs below $25k)
Percentage of individuals using paid preparers for their 2012 taxes: 52.9%
Here:
53%
State:
52%
(% for various income ranges: 42.9% for AGIs below $25k, 100.0% for AGIs $25k-50k, 66.7% for AGIs $75k-100k)
Averages for the 2004 tax year for zip code 83428, filed in 2005:
Average Adjusted Gross Income (AGI) in 2004: $36,470 (Individual Income Tax Returns)
Here:
$36,470
State:
$42,679
Salary/wage: $33,832 (reported on 66.9% of returns)
Here:
$33,832
State:
$35,636
(% of AGI for various income ranges: 727.3% for AGIs below $10k, 38.6% for AGIs $10k-25k, 64.0% for AGIs $25k-50k, 70.4% for AGIs $50k-75k, 55.5% for AGIs $75k-100k)
Taxable interest for individuals: $493 (reported on 45.7% of returns)
This zip code:
$493
Idaho:
$2,024
(% of AGI for various income ranges: 0.0% for AGIs below $10k, 1.9% for AGIs $10k-25k, 1.0% for AGIs $25k-50k, 0.4% for AGIs $50k-75k)
Taxable dividends: $889 (reported on 17.9% of returns)
Here:
$889
State:
$2,917
Net capital gain/loss: +$905 (reported on 13.9% of returns)
Here:
+$905
State:
+$13,146
Profit/loss from business: +$1,548 (reported on 20.5% of returns)
Here:
+$1,548
State:
+$8,765
Total itemized deductions: $15,140 (29% of AGI, reported on 37.7% of returns)
Here:
$15,140
State:
$18,385
Here:
28.8% of AGI
State:
23.1% of AGI
(% of AGI for various income ranges: 1127.3% for AGIs below $10k, 18.4% for AGIs $25k-50k, 13.9% for AGIs $50k-75k, 13.6% for AGIs $75k-100k)
Charity contributions deductions: $1,227 (2% of AGI, reported on 29.1% of returns)
Here:
$1,227
State:
$3,875
Here:
2.2% of AGI
State:
4.6% of AGI
Total tax: $4,103 (reported on 76.8% of returns)
83428:
$4,103
State:
$6,282
(% of AGI for various income ranges: 4.0% for AGIs $10k-25k, 6.2% for AGIs $25k-50k, 9.1% for AGIs $50k-75k, 12.5% for AGIs $75k-100k)
Earned income credit: $1,000 (reported on 12.6% of returns)
Here:
$1,000
State:
$1,660
Percentage of individuals using paid preparers for their 2004 taxes: 64.9%
Here:
65%
State:
59%
(% for various income ranges: 61.5% for AGIs below $10k, 64.1% for AGIs $10k-25k, 71.1% for AGIs $25k-50k, 53.6% for AGIs $50k-75k, 76.9% for AGIs $75k-100k)
Notable locations in zip code 83428: Big Elk Creek Campground (A), Indian Creek Boat Ramp (B), Palisades Creek Campground (C), Hunts Corral (D), Palisades Lake Lodge (E). Display/hide their locations on the map
Streams, rivers, and creeks: Corral Creek (A), Big Elk Creek (B), North Fork Rainey Creek (C), North Fork Pine Creek (D), Poison Creek (E), Sheep Creek (F), South Fork Rainey Creek (G), Tag Alder Creek (H), West Pine Creek (I). Display/hide their locations on the map
Size of family households: 98 2-persons, 71 4-persons
Size of nonfamily households: 55 1-person, 10 2-persons
59 married couples with children.
0 single-parent households ().
98.5% of residents of 83428 zip code speak English at home.
0.5% of residents speak Spanish at home (100% very well).
1.1% of residents speak other Indo-European language at home (100% very well).
Foreign born population: 2 (0.4%) (0.0% of them are naturalized citizens)
:
0.4%
Whole state:
6.0%
50%Sweden
40%English
22%German
14%Irish
11%American
5%British
4%Swedish
3%Scotch-Irish
Year of entry for the foreign-born population
02010 or later
02000 to 2009
11990 to 1999
1Before 1990
Facilities with environmental interests located in this zip code:
SWAN VALLEY ELEMENTARY SCHOOL (HIGHWAY 26 in IRWIN, ID)
(Geographic Names Information System) (National Center for Education Statistics) - STATE ID-092 601 Organizations: SWAN VALLEY SCHOOL DISTRICT 92 (SCHOOL DISTRICT)
ID DLE BUREAU OF NARCOTICS (214 PARK LN in IRWIN, ID)
Conditionally Exempt Small Quantity Generators, less than 100 kg/month of hazardous waste (Resource Conservation and Recovery Act (tracking hazardous waste)) - notification Organizations: IDAHO BUREAU OF NARCOTICS (CONTACT/OWNER)
SWAN VALLEY SD 92 (HWY 26 in IRWIN, ID)
COMPLIANCE ACTIVITY (Tracking inspections of insecticide, fungicide, and rodenticide, and toxic substances)
Housing units lacking complete plumbing facilities: 1.5% Housing units lacking complete kitchen facilities: 0.4%
36.6%Electricity
36.2%Bottled, tank, or LP gas
10.7%Utility gas
10.2%Wood
5.6%Other fuel
2.3%Solar energy
Place of birth for U.S.-born residents:
This state: 225
Northeast: 29
Midwest: 143
South: 6
West: 128
61% of the 83428 zip code residents lived in the same house 5 years ago. Out of people who lived in different houses, 57% lived in this county. Out of people who lived in different counties, 50% lived in Idaho.
99% of the 83428 zip code residents lived in the same house 1 year ago. Out of people who lived in different houses, 200% moved from different state.
Private vs. public school enrollment:
Students in private schools in grades 1 to 8 (elementary and middle school):
Here:
0.0%
Idaho:
13.5%
Students in private schools in grades 9 to 12 (high school):
Here:
0.0%
Idaho:
8.5%
Students in private undergraduate colleges: 77
Here:
93.4%
Idaho:
30.0%
Occupation by median earnings in the past 12 months ($)
265,075Management occupations
56,261Transportation occupations
53,459Office and administrative support occupations
50,390Production occupations
28,171Education, training, and library occupations
Top industries in this zip code by the number of employees in 2005:
Health Care and Social Assistance: Child Day Care Services (10-19 employees: 1 establishment)
Administrative and Support and Waste Management and Remediation Services: Landscaping Services (1-4: 2)
Arts, Entertainment, and Recreation: Independent Artists, Writers, and Performers (1-4: 1)
Arts, Entertainment, and Recreation: All Other Amusement and Recreation Industries (1-4: 1)
Accommodation and Food Services: All Other Traveler Accommodation (1-4: 1)
Accommodation and Food Services: Drinking Places (Alcoholic Beverages) (1-4: 1)
Accommodation and Food Services: Hotels (except Casino Hotels) and Motels (1-4: 1)
Fatal accident statistics in 2014:
Fatal accident count: 1
Vehicles involved in fatal accidents: 1
Fatal accidents caused by drunken drivers: 0
Fatalities: 1
Persons involved in fatal accidents: 1
Pedestrians involved in fatal accidents: 0
Home Mortgage Disclosure Act Aggregated Statistics For Year 2009 (Based on 2 partial tracts)
A) FHA, FSA/RHS & VA Home Purchase Loans
B) Conventional Home Purchase Loans
C) Refinancings
D) Home Improvement Loans
F) Non-occupant Loans on < 5 Family Dwellings (A B C & D)
G) Loans On Manufactured Home Dwelling (A B C & D)
Number
Average Value
Number
Average Value
Number
Average Value
Number
Average Value
Number
Average Value
Number
Average Value
LOANS ORIGINATED
2
$146,550
3
$264,727
14
$186,876
1
$54,620
3
$247,883
0
$0
APPLICATIONS APPROVED, NOT ACCEPTED
0
$0
0
$0
3
$187,457
0
$0
1
$312,440
0
$0
APPLICATIONS DENIED
1
$109,910
0
$0
5
$175,590
0
$0
1
$104,600
1
$80,900
APPLICATIONS WITHDRAWN
0
$0
0
$0
2
$155,610
0
$0
0
$0
0
$0
FILES CLOSED FOR INCOMPLETENESS
0
$0
0
$0
1
$79,810
0
$0
0
$0
0
$0
Aggregated Statistics For Year 2008 (Based on 2 partial tracts)
A) FHA, FSA/RHS & VA Home Purchase Loans
B) Conventional Home Purchase Loans
C) Refinancings
D) Home Improvement Loans
F) Non-occupant Loans on < 5 Family Dwellings (A B C & D)
G) Loans On Manufactured Home Dwelling (A B C & D)
Number
Average Value
Number
Average Value
Number
Average Value
Number
Average Value
Number
Average Value
Number
Average Value
LOANS ORIGINATED
1
$186,190
3
$233,630
7
$138,516
1
$77,230
1
$370,870
1
$66,060
APPLICATIONS APPROVED, NOT ACCEPTED
0
$0
0
$0
1
$187,410
0
$0
0
$0
0
$0
APPLICATIONS DENIED
0
$0
1
$99,560
4
$191,225
1
$81,040
0
$0
1
$73,820
APPLICATIONS WITHDRAWN
0
$0
0
$0
1
$309,310
0
$0
0
$0
0
$0
FILES CLOSED FOR INCOMPLETENESS
0
$0
0
$0
0
$0
0
$0
0
$0
0
$0
Aggregated Statistics For Year 2007 (Based on 2 partial tracts)
A) FHA, FSA/RHS & VA Home Purchase Loans
B) Conventional Home Purchase Loans
C) Refinancings
D) Home Improvement Loans
E) Loans on Dwellings For 5+ Families
F) Non-occupant Loans on < 5 Family Dwellings (A B C & D)
G) Loans On Manufactured Home Dwelling (A B C & D)
Number
Average Value
Number
Average Value
Number
Average Value
Number
Average Value
Number
Average Value
Number
Average Value
Number
Average Value
LOANS ORIGINATED
1
$141,100
8
$208,096
6
$212,972
1
$43,310
1
$72,460
3
$287,517
1
$132,930
APPLICATIONS APPROVED, NOT ACCEPTED
0
$0
1
$327,700
1
$143,690
0
$0
0
$0
1
$190,540
0
$0
APPLICATIONS DENIED
0
$0
2
$288,405
5
$149,138
1
$32,550
0
$0
1
$352,620
0
$0
APPLICATIONS WITHDRAWN
0
$0
2
$124,895
1
$319,660
0
$0
0
$0
1
$241,210
0
$0
FILES CLOSED FOR INCOMPLETENESS
0
$0
0
$0
0
$0
0
$0
0
$0
0
$0
0
$0
Aggregated Statistics For Year 2006 (Based on 2 partial tracts)
B) Conventional Home Purchase Loans
C) Refinancings
D) Home Improvement Loans
F) Non-occupant Loans on < 5 Family Dwellings (A B C & D)
G) Loans On Manufactured Home Dwelling (A B C & D)
Number
Average Value
Number
Average Value
Number
Average Value
Number
Average Value
Number
Average Value
LOANS ORIGINATED
4
$147,710
5
$155,160
1
$37,860
2
$175,155
1
$61,430
APPLICATIONS APPROVED, NOT ACCEPTED
1
$250,740
1
$104,470
0
$0
1
$120,260
0
$0
APPLICATIONS DENIED
2
$90,165
3
$85,307
1
$37,450
1
$63,470
1
$50,260
APPLICATIONS WITHDRAWN
2
$108,690
1
$159,220
0
$0
0
$0
0
$0
FILES CLOSED FOR INCOMPLETENESS
0
$0
0
$0
0
$0
0
$0
0
$0
Aggregated Statistics For Year 2005 (Based on 2 partial tracts)
B) Conventional Home Purchase Loans
C) Refinancings
D) Home Improvement Loans
F) Non-occupant Loans on < 5 Family Dwellings (A B C & D)
Number
Average Value
Number
Average Value
Number
Average Value
Number
Average Value
LOANS ORIGINATED
7
$210,079
4
$155,915
1
$43,990
5
$230,858
APPLICATIONS APPROVED, NOT ACCEPTED
1
$199,670
1
$112,770
0
$0
0
$0
APPLICATIONS DENIED
1
$134,570
4
$145,155
1
$30,510
1
$41,130
APPLICATIONS WITHDRAWN
1
$150,640
2
$171,610
0
$0
1
$166,710
FILES CLOSED FOR INCOMPLETENESS
0
$0
1
$164,120
0
$0
0
$0
Aggregated Statistics For Year 2004 (Based on 2 partial tracts)
B) Conventional Home Purchase Loans
C) Refinancings
D) Home Improvement Loans
F) Non-occupant Loans on < 5 Family Dwellings (A B C & D)
G) Loans On Manufactured Home Dwelling (A B C & D)

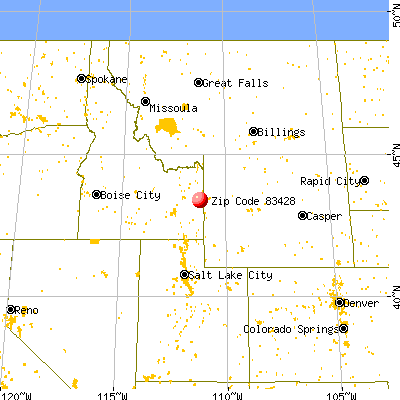


 Nearest zip codes: 83455, 83014, 83422, 83449, 83025, 83443.


