Estimated zip code population in 2022: 4,197 Zip code population in 2010: 3,438 Zip code population in 2000: 2,715
Houses and condos: 1,413 Renter-occupied apartments: 208
% of renters here:
15%
State:
28%
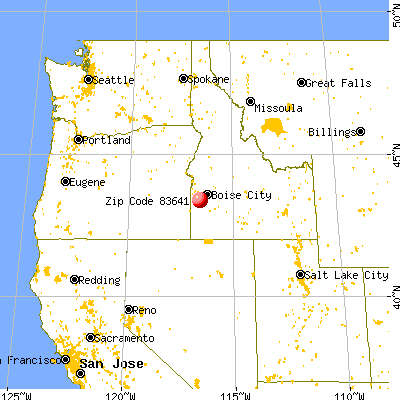
March 2022 cost of living index in zip code 83641: 88.9 (less than average, U.S. average is 100)
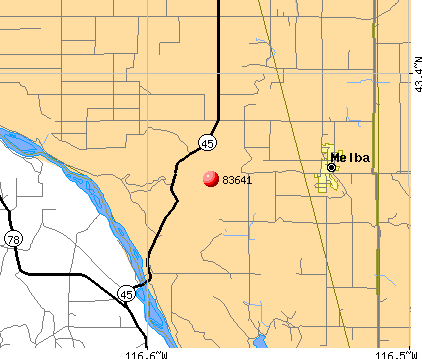
Land area: 162.5 sq. mi. Water area: 3.0 sq. mi.
Population density: 26 people per square mile
(very low).
OSM Map
General Map
Google Map
MSN Map
OSM Map
General Map
Google Map
MSN Map
OSM Map
General Map
Google Map
MSN Map
OSM Map
General Map
Google Map
MSN Map
Please wait while loading the map...
Real estate property taxes paid for housing units in 2022:
This zip code:
0.4% ($1,975)
Idaho:
0.5% ($1,995)
Median real estate property taxes paid for housing units with mortgages in 2022: $1,846 (0.4%) Median real estate property taxes paid for housing units with no mortgage in 2022: $2,517 (0.5%)
Business Search- 14 Million verified businesses
Males: 2,198
(52.4%)
Females: 1,999
(47.6%)
For population 25 years and over in 83641:
High school or higher: 86.6%
Bachelor's degree or higher: 22.3%
Graduate or professional degree: 4.1%
Unemployed: 1.5%
Mean travel time to work (commute): 34.6 minutes
For population 15 years and over in 83641:
Never married: 28.5%
Now married: 61.6%
Separated: 0.7%
Widowed: 4.8%
Divorced: 4.5%
Zip code 83641 compared to state average:
Unemployed percentage below state average.
Black race population percentage significantly below state average.
Renting percentage below state average.
Length of stay since moving in significantly above state average.
Percentage of population with a bachelor's degree or higher below state average.
Estimated median house/condo value in 2022: $470,324
83641:
$470,324
Idaho:
$432,500
According to our research of Idaho and other state lists, there was 1 registered sex offender living in 83641 zip code as of May 28, 2024. The ratio of all residents to sex offenders in zip code 83641 is 3,457 to 1. The ratio of registered sex offenders to all residents in this zip code is much lower than the state average.
Median resident age:
This zip code:
38.8 years
Idaho median age:
37.5 years
Average household size:
This zip code:
3.1 people
Idaho:
2.6 people
Averages for the 2020 tax year for zip code 83641, filed in 2021:
Average Adjusted Gross Income (AGI) in 2020: $69,954 (Individual Income Tax Returns)
Here:
$69,954
State:
$73,627
Salary/wage: $53,482 (reported on 81.2% of returns)
Here:
$53,482
State:
$55,245
(% of AGI for various income ranges: 1516.6% for AGIs below $25k, 4306.7% for AGIs $25k-50k, 7664.4% for AGIs $50k-75k, 9608.0% for AGIs $75k-100k, 17204.5% for AGIs $100k-200k)
Taxable interest for individuals: $1,850 (reported on 27.5% of returns)
This zip code:
$1,850
Idaho:
$2,230
(% of AGI for various income ranges: 30.0% for AGIs below $25k, 47.0% for AGIs $25k-50k, 62.5% for AGIs $50k-75k, 66.0% for AGIs $75k-100k, 82.7% for AGIs $100k-200k)
Ordinary dividends: $3,529 (reported on 13.1% of returns)
Here:
$3,529
State:
$7,088
(% of AGI for various income ranges: 23.4% for AGIs below $25k, 42.3% for AGIs $25k-50k, 30.6% for AGIs $50k-75k, 208.0% for AGIs $75k-100k, 160.9% for AGIs $100k-200k)
Net capital gain/loss in AGI: +$31,008 (reported on 15.6% of returns)
Here:
+$31,008
State:
+$37,284
(% of AGI for various income ranges: 16.2% for AGIs below $25k, 35.7% for AGIs $25k-50k, 180.6% for AGIs $50k-75k, 400.0% for AGIs $75k-100k, 1285.5% for AGIs $100k-200k)
Profit/loss from business: +$11,407 (reported on 16.9% of returns)
Here:
+$11,407
State:
+$12,955
(% of AGI for various income ranges: 142.4% for AGIs below $25k, 264.7% for AGIs $25k-50k, 387.5% for AGIs $50k-75k, 288.0% for AGIs $75k-100k, 877.3% for AGIs $100k-200k)
Taxable individual retirement arrangement distribution: $17,200 (reported on 6.2% of returns)
83641:
$17,200
Idaho:
$20,110
(% of AGI for various income ranges: 55.9% for AGIs below $25k, 63.3% for AGIs $25k-50k, 287.5% for AGIs $50k-75k, 825.5% for AGIs $100k-200k)
Total itemized deductions: $30,467 (reported on 7.5% of returns)
Here:
$30,467
State:
$38,402
(% of AGI for various income ranges: 766.9% for AGIs $50k-75k, 1086.4% for AGIs $100k-200k)
Charity contributions: $15,911 (reported on 5.6% of returns)
Here:
$15,911
State:
$18,314
(% of AGI for various income ranges: 236.2% for AGIs $50k-75k, 331.8% for AGIs $100k-200k)
Taxes paid: $6,825 (reported on 7.5% of returns)
83641:
$6,825
State:
$7,596
(% of AGI for various income ranges: 123.1% for AGIs $50k-75k, 302.7% for AGIs $100k-200k)
Earned income credit: $2,330 (reported on 14.4% of returns)
Here:
$2,330
State:
$2,195
(% of AGI for various income ranges: 96.6% for AGIs below $25k, 85.3% for AGIs $25k-50k)
Percentage of individuals using paid preparers for their 2020 taxes: 93.1%
Here:
93%
State:
94%
(% for various income ranges: 91.1% for AGIs below $25k, 93.2% for AGIs $25k-50k, 92.9% for AGIs $50k-75k, 93.8% for AGIs $75k-100k, 95.0% for AGIs $100k-200k, 100.0% for AGIs over 200k)
Averages for the 2012 tax year for zip code 83641, filed in 2013:
Average Adjusted Gross Income (AGI) in 2012: $46,748 (Individual Income Tax Returns)
Here:
$46,748
State:
$52,536
Salary/wage: $39,482 (reported on 83.1% of returns)
Here:
$39,482
State:
$41,938
(% of AGI for various income ranges: 75.2% for AGIs below $25k, 80.8% for AGIs $25k-50k, 71.2% for AGIs $50k-75k, 65.9% for AGIs $75k-100k, 61.9% for AGIs $100k-200k)
Taxable interest for individuals: $2,567 (reported on 27.7% of returns)
This zip code:
$2,567
Idaho:
$1,874
(% of AGI for various income ranges: 1.3% for AGIs below $25k, 1.1% for AGIs $25k-50k, 1.7% for AGIs $50k-75k, 2.0% for AGIs $75k-100k, 1.6% for AGIs $100k-200k)
Ordinary dividends: $2,494 (reported on 12.3% of returns)
Here:
$2,494
State:
$5,706
(% of AGI for various income ranges: 1.1% for AGIs below $25k, 0.6% for AGIs $25k-50k, 1.5% for AGIs $50k-75k, 0.3% for AGIs $100k-200k)
Net capital gain/loss in AGI: +$10,500 (reported on 16.2% of returns)
Here:
+$10,500
State:
+$14,571
(% of AGI for various income ranges: 0.9% for AGIs below $25k, 0.6% for AGIs $25k-50k, 1.8% for AGIs $50k-75k, 3.7% for AGIs $75k-100k, 7.7% for AGIs $100k-200k)
Profit/loss from business: +$10,475 (reported on 15.4% of returns)
Here:
+$10,475
State:
+$10,113
(% of AGI for various income ranges: 8.0% for AGIs below $25k, 3.3% for AGIs $25k-50k, 5.1% for AGIs $50k-75k, 6.7% for AGIs $75k-100k)
Taxable individual retirement arrangement distribution: $8,980 (reported on 7.7% of returns)
83641:
$8,980
Idaho:
$14,642
(% of AGI for various income ranges: 1.9% for AGIs below $25k, 2.1% for AGIs $25k-50k, 4.2% for AGIs $50k-75k)
Total itemized deductions: $20,452 (25% of AGI, reported on 30.8% of returns)
Here:
$20,452
State:
$22,697
Here:
24.6% of AGI
State:
22.0% of AGI
(% of AGI for various income ranges: 9.7% for AGIs below $25k, 8.7% for AGIs $25k-50k, 16.2% for AGIs $50k-75k, 17.7% for AGIs $75k-100k, 15.1% for AGIs $100k-200k)
Charity contributions: $4,387 (reported on 23.8% of returns)
Here:
$4,387
State:
$5,246
(% of AGI for various income ranges: 1.0% for AGIs below $25k, 1.1% for AGIs $25k-50k, 2.8% for AGIs $50k-75k, 3.3% for AGIs $75k-100k, 2.7% for AGIs $100k-200k)
Taxes paid: $5,298 (reported on 30.8% of returns)
83641:
$5,298
State:
$7,139
(% of AGI for various income ranges: 1.2% for AGIs below $25k, 1.5% for AGIs $25k-50k, 2.9% for AGIs $50k-75k, 4.1% for AGIs $75k-100k, 5.8% for AGIs $100k-200k)
Earned income credit: $2,612 (reported on 20.0% of returns)
Here:
$2,612
State:
$2,213
(% of AGI for various income ranges: 7.0% for AGIs below $25k, 1.6% for AGIs $25k-50k)
Percentage of individuals using paid preparers for their 2012 taxes: 66.9%
Here:
67%
State:
52%
(% for various income ranges: 57.4% for AGIs below $25k, 72.1% for AGIs $25k-50k, 64.7% for AGIs $50k-75k, 77.8% for AGIs $75k-100k, 78.6% for AGIs $100k-200k)
Averages for the 2004 tax year for zip code 83641, filed in 2005:
Average Adjusted Gross Income (AGI) in 2004: $30,391 (Individual Income Tax Returns)
Here:
$30,391
State:
$42,679
Salary/wage: $31,400 (reported on 82.6% of returns)
Here:
$31,400
State:
$35,636
(% of AGI for various income ranges: 81.8% for AGIs $10k-25k, 82.7% for AGIs $25k-50k, 76.5% for AGIs $50k-75k, 76.9% for AGIs $75k-100k, 43.0% for AGIs over 100k)
Taxable interest for individuals: $2,387 (reported on 35.9% of returns)
This zip code:
$2,387
Idaho:
$2,024
(% of AGI for various income ranges: 2.6% for AGIs $10k-25k, 2.0% for AGIs $25k-50k, 2.3% for AGIs $50k-75k, 0.4% for AGIs $75k-100k, 2.2% for AGIs over 100k)
Taxable dividends: $1,329 (reported on 18.1% of returns)
Here:
$1,329
State:
$2,917
(% of AGI for various income ranges: 1.1% for AGIs $10k-25k, 0.5% for AGIs $25k-50k, 0.3% for AGIs $50k-75k, 0.1% for AGIs $75k-100k, 0.5% for AGIs over 100k)
Net capital gain/loss: +$17,219 (reported on 22.7% of returns)
Here:
+$17,219
State:
+$13,146
(% of AGI for various income ranges: 0.4% for AGIs $10k-25k, 2.3% for AGIs $25k-50k, 2.9% for AGIs $50k-75k, 4.4% for AGIs $75k-100k, 38.5% for AGIs over 100k)
Profit/loss from business: +$4,592 (reported on 18.0% of returns)
Here:
+$4,592
State:
+$8,765
(% of AGI for various income ranges: 5.0% for AGIs $10k-25k, 4.7% for AGIs $25k-50k, 0.8% for AGIs $50k-75k, 0.9% for AGIs $75k-100k)
IRA payment deduction: $3,462 (reported on 2.3% of returns)
83641:
$3,462
Idaho:
$3,020
Total itemized deductions: $16,008 (26% of AGI, reported on 32.4% of returns)
Here:
$16,008
State:
$18,385
Here:
26.0% of AGI
State:
23.1% of AGI
(% of AGI for various income ranges: 8.5% for AGIs $10k-25k, 15.4% for AGIs $25k-50k, 16.9% for AGIs $50k-75k, 18.4% for AGIs $75k-100k, 12.1% for AGIs over 100k)
Charity contributions deductions: $2,946 (5% of AGI, reported on 26.1% of returns)
Here:
$2,946
State:
$3,875
Here:
4.5% of AGI
State:
4.6% of AGI
(% of AGI for various income ranges: 1.1% for AGIs $10k-25k, 1.5% for AGIs $25k-50k, 2.7% for AGIs $50k-75k, 3.3% for AGIs $75k-100k, 2.4% for AGIs over 100k)
Total tax: $4,275 (reported on 64.5% of returns)
83641:
$4,275
State:
$6,282
(% of AGI for various income ranges: 2.9% for AGIs $10k-25k, 5.6% for AGIs $25k-50k, 7.0% for AGIs $50k-75k, 9.7% for AGIs $75k-100k, 13.2% for AGIs over 100k)
Earned income credit: $1,982 (reported on 19.3% of returns)
Here:
$1,982
State:
$1,660
Percentage of individuals using paid preparers for their 2004 taxes: 68.8%
Here:
69%
State:
59%
(% for various income ranges: 68.3% for AGIs below $10k, 67.7% for AGIs $10k-25k, 67.1% for AGIs $25k-50k, 67.5% for AGIs $50k-75k, 79.3% for AGIs $75k-100k, 80.0% for AGIs over 100k)
Likely homosexual households (counted as self-reported same-sex unmarried-partner households)
Lesbian couples: 0.5% of all households
Gay men: 0.0% of all households
Household received Food Stamps/SNAP in the past 12 months: 155 Household did not receive Food Stamps/SNAP in the past 12 months: 1,193
Women who had a birth in the past 12 months: 89 (38 now married, 58 unmarried) Women who did not have a birth in the past 12 months: 811 (453 now married, 360 unmarried)
Housing units in zip code 83641 with a mortgage: 596 (34 second mortgage, 14 home equity loan, 11 both second mortgage and home equity loan) Houses without a mortgage: 35
Median monthly owner costs for units with a mortgage: $1,488 Median monthly owner costs for units without a mortgage: $588
Residents with income below the poverty level in 2022:
This zip code:
5.7%
Whole state:
10.7%
Residents with income below 50% of the poverty level in 2022:
This zip code:
3.7%
Whole state:
6.1%
Median number of rooms in houses and condos:
Here:
6.3
State:
6.5
Median number of rooms in apartments:
Here:
5.8
State:
4.4
Notable locations in this zip code not listed on our city pages
Notable locations in zip code 83641: Stoddard (A), Melmont (B), Warm Springs Ferry (C), Bernard Ferry (D), Sommercamp (E), Wilson Community Hall (F), Murphy - Reynolds - Wilson Fire Protection District (G), Melba Rural Fire Protection District (H). Display/hide their locations on the map
Creeks: Hardtrigger Creek (A), Rabbit Creek (B), Reynolds Creek (C), Wilson Creek (D), Warm Springs Creek (E), Squaw Creek (F), Scorpion Creek (G). Display/hide their locations on the map
Size of family households: 435 2-persons, 104 3-persons, 137 4-persons, 136 5-persons, 85 6-persons, 101 7-or-more-persons
Size of nonfamily households: 324 1-person, 23 2-persons
883 married couples with children.
36 single-parent households (8 men, 28 women).
87.1% of residents of 83641 zip code speak English at home.
12.0% of residents speak Spanish at home (68% very well, 14% well, 12% not well, 6% not at all).
0.3% of residents speak other Indo-European language at home (100% very well).
Foreign born population: 168 (4.0%) (28.7% of them are naturalized citizens)
This zip code:
4.0%
Whole state:
6.0%
89%Honduras
3%France
29%English
19%German
10%American
5%Finnish
2%Irish
2%Scottish
2%Italian
Year of entry for the foreign-born population
222010 or later
442000 to 2009
481990 to 1999
72Before 1990
Major facilities with environmental interests located in this zip code:
NICHOLSON FEEDLOT (497 BUTTE ROAD in MELBA, ID)
(Integrated Compliance Information System) - ICIS-10-1999-0180, FORMAL ENFORCEMENT ACTION, ICIS-10-1999-0114, National Pollutant Discharge Elimination System NON-MAJOR (Tracking pollutant discharge elimination systems) - permit Business SIC classification: BEEF CATTLE FEEDLOTS Alternative names: THOMAS NICHOLSON
MELBA ELEMENTARY SCHOOL (521 CARRIE REX AVENUE in MELBA, ID)
(Geographic Names Information System) (National Center for Education Statistics) - STATE ID-136 101 Organizations: MELBA JOINT SCHOOL DISTRICT 136 (SCHOOL DISTRICT)
MELBA HIGH SCHOOL (600 BROADWAY in MELBA, ID)
(National Center for Education Statistics) - STATE ID-136 401 Organizations: MELBA JOINT SCHOOL DISTRICT 136 (SCHOOL DISTRICT)
MELBA MIDDLE SCHOOL (560 BROADWAY in MELBA, ID)
(National Center for Education Statistics) - STATE ID-136 601 Organizations: MELBA JOINT SCHOOL DISTRICT 136 (SCHOOL DISTRICT)
CHUCK DEGROOT (3431 LYNWOOD ROAD in MELBA, ID)
National Pollutant Discharge Elimination System NON-MAJOR (Tracking pollutant discharge elimination systems) - permit Business SIC classification: DAIRY FARMS Alternative names: DEGROOT, CHUCK
MOORIAH DAIRY (3438 LYNWOOD ROAD in MELBA, ID)
National Pollutant Discharge Elimination System NON-MAJOR (Tracking pollutant discharge elimination systems) - permit Business SIC classification: DAIRY FARMS
SNAKE RIVER FARMS (15188 SOUTH CAN ADA ROAD in MELBA, ID)
National Pollutant Discharge Elimination System NON-MAJOR (Tracking pollutant discharge elimination systems) - permit Business SIC classification: DAIRY FARMS
TFI LIMITED PARTNERSHIP (5 M W OF HWY 45 ON MAP ROCK RD in MELBA, ID)
(Resource Conservation and Recovery Act (tracking hazardous waste)) Business NAICS classification: BEEF CATTLE RANCHING AND FARMING. Organizations: TFI LIMITED PARTERNISHIP (CONTACT/OWNER)
ANIMAL FEEDING OPERATION (7511 WARREN SPUR ROAD in MELBA, ID)
National Pollutant Discharge Elimination System NON-MAJOR (Tracking pollutant discharge elimination systems) - permit Business SIC classification: BEEF CATTLE FEEDLOTS Alternative names: CANYON CATTLE FEEDERS
FEEDLOT (HILL ROAD in MELBA, ID)
National Pollutant Discharge Elimination System NON-MAJOR (Tracking pollutant discharge elimination systems) - permit Business SIC classification: BEEF CATTLE FEEDLOTS Alternative names: MELBA FEEDLOT
SAWTOOTH FOREST INDUSTRIES (8758 MELMONT RD in MELBA, ID)
AIR MINOR (AIRS/AFS) Business SIC classification: WOOD PRODUCTS
MELBA JOINT SD 136 (520 BROADWAY AVE in MELBA, ID)
COMPLIANCE ACTIVITY (Tracking inspections of insecticide, fungicide, and rodenticide, and toxic substances)
Housing units lacking complete kitchen facilities: 0.4%
66.4%Electricity
10.6%Wood
8.3%Bottled, tank, or LP gas
6.9%Fuel oil, kerosene, etc.
3.7%No fuel used
3.0%Other fuel
1.1%Utility gas
Population in 1990: 1,116. Population change in the 1990s: +1,599 (+143.3%).
Place of birth for U.S.-born residents:
This state: 2,295
Northeast: 54
Midwest: 209
South: 143
West: 1,277
53% of the 83641 zip code residents lived in the same house 5 years ago. Out of people who lived in different houses, 43% lived in this county. Out of people who lived in different counties, 50% lived in Idaho.
95% of the 83641 zip code residents lived in the same house 1 year ago. Out of people who lived in different houses, 39% moved from this county. Out of people who lived in different houses, 32% moved from different county within same state. Out of people who lived in different houses, 40% moved from different state.
Private vs. public school enrollment:
Students in private schools in grades 1 to 8 (elementary and middle school): 75
Here:
13.7%
Idaho:
13.5%
Students in private schools in grades 9 to 12 (high school): 11
Here:
3.7%
Idaho:
8.5%
Students in private undergraduate colleges: 26
Here:
19.9%
Idaho:
30.0%
Occupation by median earnings in the past 12 months ($)
92,464Computer and mathematical occupations
80,806Management occupations
77,382Fire fighting and prevention, and other protective service workers including supervisors
59,336Health technologists and technicians
57,784Health diagnosing and treating practitioners and other technical occupations
53,503Installation, maintenance, and repair occupations
Top industries in this zip code by the number of employees in 2005:
Real Estate and Rental and Leasing: Video Tape and Disc Rental (10-19 employees: 1 establishment)
Accommodation and Food Services: Full-Service Restaurants (5-9: 1)
Health Care and Social Assistance: All Other Outpatient Care Centers (5-9: 1)
Fatal accident statistics in 2012:
Fatal accident count: 1
Vehicles involved in fatal accidents: 1
Fatal accidents caused by drunken drivers: 0
Fatalities: 1
Persons involved in fatal accidents: 1
Pedestrians involved in fatal accidents: 0
Fatal accident statistics in 2011:
Fatal accident count: 2
Vehicles involved in fatal accidents: 3
Fatal accidents caused by drunken drivers: 0
Fatalities: 2
Persons involved in fatal accidents: 7
Pedestrians involved in fatal accidents: 0
Home Mortgage Disclosure Act Aggregated Statistics For Year 2009 (Based on 6 partial tracts)
A) FHA, FSA/RHS & VA Home Purchase Loans
B) Conventional Home Purchase Loans
C) Refinancings
D) Home Improvement Loans
F) Non-occupant Loans on < 5 Family Dwellings (A B C & D)
G) Loans On Manufactured Home Dwelling (A B C & D)
Number
Average Value
Number
Average Value
Number
Average Value
Number
Average Value
Number
Average Value
Number
Average Value
LOANS ORIGINATED
20
$158,906
17
$215,783
106
$173,000
4
$245,985
5
$139,610
10
$121,591
APPLICATIONS APPROVED, NOT ACCEPTED
0
$0
0
$0
18
$184,720
2
$100,025
0
$0
1
$114,920
APPLICATIONS DENIED
3
$193,193
6
$200,287
70
$214,614
1
$109,250
3
$115,870
7
$122,220
APPLICATIONS WITHDRAWN
1
$184,440
4
$158,550
25
$240,203
1
$82,290
1
$258,220
3
$151,103
FILES CLOSED FOR INCOMPLETENESS
1
$127,690
0
$0
4
$215,835
4
$24,652
0
$0
1
$7,090
Aggregated Statistics For Year 2008 (Based on 6 partial tracts)
A) FHA, FSA/RHS & VA Home Purchase Loans
B) Conventional Home Purchase Loans
C) Refinancings
D) Home Improvement Loans
F) Non-occupant Loans on < 5 Family Dwellings (A B C & D)
G) Loans On Manufactured Home Dwelling (A B C & D)
Number
Average Value
Number
Average Value
Number
Average Value
Number
Average Value
Number
Average Value
Number
Average Value
LOANS ORIGINATED
11
$143,493
24
$242,290
78
$262,578
9
$81,108
4
$1,099,748
16
$391,500
APPLICATIONS APPROVED, NOT ACCEPTED
3
$144,243
6
$169,428
13
$199,342
2
$120,955
2
$200,405
4
$122,902
APPLICATIONS DENIED
3
$152,520
7
$215,860
66
$233,070
7
$295,921
4
$379,530
9
$147,003
APPLICATIONS WITHDRAWN
1
$183,730
4
$149,860
28
$250,697
3
$176,403
1
$258,930
2
$130,530
FILES CLOSED FOR INCOMPLETENESS
1
$178,060
1
$102,860
9
$281,790
2
$48,950
0
$0
4
$86,548
Aggregated Statistics For Year 2007 (Based on 6 partial tracts)
A) FHA, FSA/RHS & VA Home Purchase Loans
B) Conventional Home Purchase Loans
C) Refinancings
D) Home Improvement Loans
F) Non-occupant Loans on < 5 Family Dwellings (A B C & D)
G) Loans On Manufactured Home Dwelling (A B C & D)
Number
Average Value
Number
Average Value
Number
Average Value
Number
Average Value
Number
Average Value
Number
Average Value
LOANS ORIGINATED
4
$125,918
52
$226,476
109
$237,994
9
$65,264
9
$542,139
15
$127,077
APPLICATIONS APPROVED, NOT ACCEPTED
0
$0
6
$284,942
23
$217,046
2
$81,225
0
$0
5
$117,334
APPLICATIONS DENIED
2
$179,480
12
$295,761
89
$205,176
13
$171,675
2
$73,780
23
$125,132
APPLICATIONS WITHDRAWN
1
$109,250
6
$211,992
31
$203,666
4
$114,745
1
$241,200
4
$160,325
FILES CLOSED FOR INCOMPLETENESS
0
$0
1
$89,380
6
$235,520
0
$0
0
$0
1
$72,360
Aggregated Statistics For Year 2006 (Based on 6 partial tracts)
A) FHA, FSA/RHS & VA Home Purchase Loans
B) Conventional Home Purchase Loans
C) Refinancings
D) Home Improvement Loans
F) Non-occupant Loans on < 5 Family Dwellings (A B C & D)
G) Loans On Manufactured Home Dwelling (A B C & D)
Number
Average Value
Number
Average Value
Number
Average Value
Number
Average Value
Number
Average Value
Number
Average Value
LOANS ORIGINATED
6
$132,303
84
$189,292
118
$203,453
21
$130,023
16
$160,502
19
$128,700
APPLICATIONS APPROVED, NOT ACCEPTED
1
$87,970
22
$159,228
23
$177,597
4
$77,148
7
$104,180
4
$123,258
APPLICATIONS DENIED
1
$59,590
28
$169,648
70
$148,721
13
$61,499
6
$192,130
18
$133,013
APPLICATIONS WITHDRAWN
0
$0
14
$151,102
38
$157,673
3
$169,073
4
$97,720
3
$115,397
FILES CLOSED FOR INCOMPLETENESS
0
$0
3
$320,413
9
$187,281
0
$0
1
$35,470
0
$0
Aggregated Statistics For Year 2005 (Based on 6 partial tracts)
A) FHA, FSA/RHS & VA Home Purchase Loans
B) Conventional Home Purchase Loans
C) Refinancings
D) Home Improvement Loans
F) Non-occupant Loans on < 5 Family Dwellings (A B C & D)
G) Loans On Manufactured Home Dwelling (A B C & D)
Number
Average Value
Number
Average Value
Number
Average Value
Number
Average Value
Number
Average Value
Number
Average Value
LOANS ORIGINATED
7
$97,087
90
$148,611
102
$149,503
12
$90,862
22
$91,932
23
$90,279
APPLICATIONS APPROVED, NOT ACCEPTED
0
$0
16
$148,708
22
$157,293
1
$28,380
5
$131,098
4
$116,165
APPLICATIONS DENIED
4
$84,950
36
$118,253
65
$147,501
6
$101,680
13
$60,790
11
$125,564
APPLICATIONS WITHDRAWN
1
$116,340
24
$110,725
36
$137,151
3
$57,460
6
$94,232
9
$96,006
FILES CLOSED FOR INCOMPLETENESS
0
$0
3
$211,163
8
$130,352
0
$0
0
$0
0
$0
Aggregated Statistics For Year 2004 (Based on 6 partial tracts)
A) FHA, FSA/RHS & VA Home Purchase Loans
B) Conventional Home Purchase Loans
C) Refinancings
D) Home Improvement Loans
F) Non-occupant Loans on < 5 Family Dwellings (A B C & D)
G) Loans On Manufactured Home Dwelling (A B C & D)
Number
Average Value
Number
Average Value
Number
Average Value
Number
Average Value
Number
Average Value
Number
Average Value
LOANS ORIGINATED
9
$99,631
60
$148,903
91
$146,947
9
$46,662
13
$172,057
13
$83,272
APPLICATIONS APPROVED, NOT ACCEPTED
1
$78,740
12
$117,288
31
$151,125
1
$65,970
4
$76,792
5
$74,488
APPLICATIONS DENIED
2
$70,940
18
$119,337
62
$141,125
6
$45,757
5
$135,638
11
$101,895
APPLICATIONS WITHDRAWN
1
$70,940
4
$90,270
30
$148,359
4
$25,008
1
$69,520
4
$96,300
FILES CLOSED FOR INCOMPLETENESS
0
$0
0
$0
12
$150,688
0
$0
0
$0
1
$55,330
Aggregated Statistics For Year 2003 (Based on 6 partial tracts)
A) FHA, FSA/RHS & VA Home Purchase Loans
B) Conventional Home Purchase Loans
C) Refinancings
D) Home Improvement Loans
F) Non-occupant Loans on < 5 Family Dwellings (A B C & D)
Number
Average Value
Number
Average Value
Number
Average Value
Number
Average Value
Number
Average Value
LOANS ORIGINATED
17
$122,768
60
$124,784
192
$132,976
5
$32,206
13
$105,537
APPLICATIONS APPROVED, NOT ACCEPTED
1
$170,260
9
$104,833
29
$154,649
1
$3,550
6
$152,640
APPLICATIONS DENIED
4
$88,675
20
$102,863
70
$124,986
6
$11,232
11
$83,451
APPLICATIONS WITHDRAWN
1
$59,590
12
$72,891
40
$116,927
1
$33,340
1
$58,880
FILES CLOSED FOR INCOMPLETENESS
0
$0
2
$110,310
6
$124,973
0
$0
1
$145,430
Aggregated Statistics For Year 2002 (Based on 6 partial tracts)
A) FHA, FSA/RHS & VA Home Purchase Loans
B) Conventional Home Purchase Loans
C) Refinancings
D) Home Improvement Loans
F) Non-occupant Loans on < 5 Family Dwellings (A B C & D)
Number
Average Value
Number
Average Value
Number
Average Value
Number
Average Value
Number
Average Value
LOANS ORIGINATED
6
$106,292
52
$131,894
125
$135,666
6
$32,515
6
$82,645
APPLICATIONS APPROVED, NOT ACCEPTED
1
$159,620
7
$100,330
20
$144,150
0
$0
0
$0
APPLICATIONS DENIED
0
$0
12
$88,675
54
$92,485
8
$24,651
11
$80,291
APPLICATIONS WITHDRAWN
1
$123,440
8
$113,504
34
$107,850
1
$117,050
1
$101,440
FILES CLOSED FOR INCOMPLETENESS
1
$70,940
2
$145,425
11
$144,008
1
$81,580
0
$0
Aggregated Statistics For Year 2001 (Based on 6 partial tracts)
A) FHA, FSA/RHS & VA Home Purchase Loans
B) Conventional Home Purchase Loans
C) Refinancings
D) Home Improvement Loans
F) Non-occupant Loans on < 5 Family Dwellings (A B C & D)
Number
Average Value
Number
Average Value
Number
Average Value
Number
Average Value
Number
Average Value
LOANS ORIGINATED
19
$102,004
35
$124,348
119
$133,892
6
$35,470
6
$66,802
APPLICATIONS APPROVED, NOT ACCEPTED
0
$0
9
$73,383
21
$155,426
0
$0
2
$143,300
APPLICATIONS DENIED
4
$73,778
17
$78,994
54
$123,882
4
$89,385
4
$78,035
APPLICATIONS WITHDRAWN
0
$0
4
$95,770
25
$117,533
2
$20,925
1
$48,240
FILES CLOSED FOR INCOMPLETENESS
0
$0
1
$127,690
18
$154,452
0
$0
0
$0
Aggregated Statistics For Year 2000 (Based on 6 partial tracts)
A) FHA, FSA/RHS & VA Home Purchase Loans
B) Conventional Home Purchase Loans
C) Refinancings
D) Home Improvement Loans
F) Non-occupant Loans on < 5 Family Dwellings (A B C & D)
Number
Average Value
Number
Average Value
Number
Average Value
Number
Average Value
Number
Average Value
LOANS ORIGINATED
7
$109,551
42
$127,422
48
$89,399
7
$26,046
12
$61,067
APPLICATIONS APPROVED, NOT ACCEPTED
2
$59,590
9
$91,749
11
$125,628
4
$27,135
1
$68,100
APPLICATIONS DENIED
8
$87,345
30
$75,125
51
$106,452
11
$45,208
5
$123,152
APPLICATIONS WITHDRAWN
1
$114,210
11
$84,870
17
$65,932
1
$74,490
1
$22,700
FILES CLOSED FOR INCOMPLETENESS
1
$76,620
3
$137,860
6
$86,310
0
$0
1
$35,470
Aggregated Statistics For Year 1999 (Based on 3 partial tracts)
A) FHA, FSA/RHS & VA Home Purchase Loans
B) Conventional Home Purchase Loans
C) Refinancings
D) Home Improvement Loans
F) Non-occupant Loans on < 5 Family Dwellings (A B C & D)
Detailed PMIC statistics for the following Tracts:0223.00
2002 - 2018 National Fire Incident Reporting System (NFIRS) incidents
According to the data from the years 2002 - 2018 the average number of fires per year is 41. The highest number of fire incidents - 57 took place in 2015, and the least - 18 in 2004. The data has a declining trend.
When looking into fire subcategories, the most reports belonged to: Outside Fires (70.5%), and Structure Fires (18.0%).
Fire incident types reported to NFIRS in Zip Code 83641


 Nearest zip codes: 83686, 83651, 83687, 83634, 83642, 83639.


 According to the data from the years 2002 - 2018 the average number of fires per year is 41. The highest number of fire incidents - 57 took place in 2015, and the least - 18 in 2004. The data has a declining trend.
 When looking into fire subcategories, the most reports belonged to: Outside Fires (70.5%), and Structure Fires (18.0%).