Estimated zip code population in 2022: 1,453 Zip code population in 2010: 1,164 Zip code population in 2000: 1,393
Houses and condos: 1,692 Renter-occupied apartments: 60
% of renters here:
8%
State:
28%
March 2022 cost of living index in zip code 83833: 90.2 (less than average, U.S. average is 100)
Land area: 106.4 sq. mi. Water area: 25.3 sq. mi.
Population density: 14 people per square mile
(very low).
OSM Map
General Map
Google Map
MSN Map
OSM Map
General Map
Google Map
MSN Map
OSM Map
General Map
Google Map
MSN Map
OSM Map
General Map
Google Map
MSN Map
Please wait while loading the map...
Real estate property taxes paid for housing units in 2022:
This zip code:
0.4% ($2,679)
Idaho:
0.5% ($1,995)
Median real estate property taxes paid for housing units with mortgages in 2022: $2,223 (0.3%) Median real estate property taxes paid for housing units with no mortgage in 2022: $3,279 (0.5%)
Business Search- 14 Million verified businesses
Males: 840
(57.8%)
Females: 613
(42.2%)
For population 25 years and over in 83833:
High school or higher: 97.7%
Bachelor's degree or higher: 45.2%
Graduate or professional degree: 29.3%
Unemployed: 3.0%
Mean travel time to work (commute): 35.0 minutes
For population 15 years and over in 83833:
Never married: 11.0%
Now married: 76.3%
Separated: 0.0%
Widowed: 3.0%
Divorced: 9.7%
Zip code 83833 compared to state average:
Black race population percentage significantly below state average.
Hispanic race population percentage below state average.
Median age significantly above state average.
Renting percentage significantly below state average.
Length of stay since moving in significantly above state average.
Percentage of population with a bachelor's degree or higher above state average.
Estimated median house/condo value in 2022: $618,752
83833:
$618,752
Idaho:
$432,500
According to our research of Idaho and other state lists, there were 2 registered sex offenders living in 83833 zip code as of May 28, 2024. The ratio of all residents to sex offenders in zip code 83833 is 606 to 1. The ratio of registered sex offenders to all residents in this zip code is lower than the state average.
Median resident age:
This zip code:
61.3 years
Idaho median age:
37.5 years
Average household size:
This zip code:
2.0 people
Idaho:
2.6 people
Averages for the 2020 tax year for zip code 83833, filed in 2021:
Average Adjusted Gross Income (AGI) in 2020: $95,564 (Individual Income Tax Returns)
Here:
$95,564
State:
$73,627
Salary/wage: $66,190 (reported on 68.6% of returns)
Here:
$66,190
State:
$55,245
(% of AGI for various income ranges: 1431.1% for AGIs below $25k, 3477.5% for AGIs $25k-50k, 6535.0% for AGIs $50k-75k, 7382.5% for AGIs $75k-100k, 11002.9% for AGIs $100k-200k)
Taxable interest for individuals: $3,164 (reported on 47.1% of returns)
This zip code:
$3,164
Idaho:
$2,230
(% of AGI for various income ranges: 182.2% for AGIs below $25k, 91.2% for AGIs $25k-50k, 36.7% for AGIs $50k-75k, 167.5% for AGIs $75k-100k, 615.7% for AGIs $100k-200k)
Ordinary dividends: $8,167 (reported on 30.0% of returns)
Here:
$8,167
State:
$7,088
(% of AGI for various income ranges: 92.2% for AGIs below $25k, 143.8% for AGIs $25k-50k, 303.3% for AGIs $50k-75k, 460.0% for AGIs $75k-100k, 675.7% for AGIs $100k-200k)
Net capital gain/loss in AGI: +$23,354 (reported on 37.1% of returns)
Here:
+$23,354
State:
+$37,284
(% of AGI for various income ranges: 61.1% for AGIs below $25k, 273.8% for AGIs $25k-50k, 333.3% for AGIs $50k-75k, 1080.0% for AGIs $75k-100k, 1838.6% for AGIs $100k-200k)
Profit/loss from business: +$20,427 (reported on 21.4% of returns)
Here:
+$20,427
State:
+$12,955
(% of AGI for various income ranges: 93.3% for AGIs below $25k, 571.2% for AGIs $25k-50k, 1016.7% for AGIs $50k-75k, 2732.9% for AGIs $100k-200k)
Taxable individual retirement arrangement distribution: $23,745 (reported on 15.7% of returns)
83833:
$23,745
Idaho:
$20,110
(% of AGI for various income ranges: 402.2% for AGIs below $25k, 1301.7% for AGIs $50k-75k, 2098.6% for AGIs $100k-200k)
Total itemized deductions: $35,580 (reported on 14.3% of returns)
Here:
$35,580
State:
$38,402
(% of AGI for various income ranges: 1540.0% for AGIs $50k-75k, 1542.9% for AGIs $100k-200k)
Charity contributions: $13,286 (reported on 10.0% of returns)
Here:
$13,286
State:
$18,314
(% of AGI for various income ranges: 464.3% for AGIs $100k-200k)
Taxes paid: $7,840 (reported on 14.3% of returns)
83833:
$7,840
State:
$7,596
(% of AGI for various income ranges: 336.7% for AGIs $50k-75k, 337.1% for AGIs $100k-200k)
Earned income credit: $1,400 (reported on 7.1% of returns)
Here:
$1,400
State:
$2,195
(% of AGI for various income ranges: 77.8% for AGIs below $25k)
Percentage of individuals using paid preparers for their 2020 taxes: 91.4%
Here:
91%
State:
94%
(% for various income ranges: 89.5% for AGIs below $25k, 92.9% for AGIs $25k-50k, 90.9% for AGIs $50k-75k, 85.7% for AGIs $75k-100k, 92.3% for AGIs $100k-200k, 100.0% for AGIs over 200k)
Averages for the 2012 tax year for zip code 83833, filed in 2013:
Average Adjusted Gross Income (AGI) in 2012: $65,498 (Individual Income Tax Returns)
Here:
$65,498
State:
$52,536
Salary/wage: $43,880 (reported on 71.4% of returns)
Here:
$43,880
State:
$41,938
(% of AGI for various income ranges: 51.6% for AGIs below $25k, 60.6% for AGIs $25k-50k, 49.5% for AGIs $50k-75k, 56.5% for AGIs $75k-100k, 40.5% for AGIs $100k-200k)
Taxable interest for individuals: $1,973 (reported on 46.4% of returns)
This zip code:
$1,973
Idaho:
$1,874
(% of AGI for various income ranges: 2.3% for AGIs below $25k, 2.3% for AGIs $25k-50k, 1.0% for AGIs $50k-75k, 0.9% for AGIs $75k-100k, 1.3% for AGIs $100k-200k)
Ordinary dividends: $4,129 (reported on 30.4% of returns)
Here:
$4,129
State:
$5,706
(% of AGI for various income ranges: 4.7% for AGIs below $25k, 3.2% for AGIs $25k-50k, 0.9% for AGIs $75k-100k, 2.0% for AGIs $100k-200k)
Net capital gain/loss in AGI: +$1,619 (reported on 28.6% of returns)
Here:
+$1,619
State:
+$14,571
(% of AGI for various income ranges: 1.0% for AGIs $75k-100k, 1.2% for AGIs $100k-200k)
Profit/loss from business: +$10,900 (reported on 21.4% of returns)
Here:
+$10,900
State:
+$10,113
(% of AGI for various income ranges: 6.7% for AGIs below $25k, 4.8% for AGIs $25k-50k, 8.4% for AGIs $50k-75k, 2.9% for AGIs $100k-200k)
Taxable individual retirement arrangement distribution: $24,242 (reported on 21.4% of returns)
83833:
$24,242
Idaho:
$14,642
(% of AGI for various income ranges: 10.1% for AGIs below $25k, 6.9% for AGIs $25k-50k, 12.7% for AGIs $50k-75k, 9.5% for AGIs $100k-200k)
Total itemized deductions: $25,308 (25% of AGI, reported on 42.9% of returns)
Here:
$25,308
State:
$22,697
Here:
25.0% of AGI
State:
22.0% of AGI
(% of AGI for various income ranges: 21.3% for AGIs below $25k, 17.9% for AGIs $25k-50k, 16.1% for AGIs $50k-75k, 15.5% for AGIs $75k-100k, 16.1% for AGIs $100k-200k)
Charity contributions: $3,262 (reported on 28.6% of returns)
Here:
$3,262
State:
$5,246
(% of AGI for various income ranges: 1.6% for AGIs $25k-50k, 0.7% for AGIs $50k-75k, 1.5% for AGIs $75k-100k, 1.7% for AGIs $100k-200k)
Taxes paid: $9,226 (reported on 41.1% of returns)
83833:
$9,226
State:
$7,139
(% of AGI for various income ranges: 4.8% for AGIs below $25k, 3.5% for AGIs $25k-50k, 4.5% for AGIs $50k-75k, 4.9% for AGIs $75k-100k, 7.2% for AGIs $100k-200k)
Earned income credit: $1,350 (reported on 10.7% of returns)
Here:
$1,350
State:
$2,213
(% of AGI for various income ranges: 1.8% for AGIs below $25k, 0.8% for AGIs $25k-50k)
Percentage of individuals using paid preparers for their 2012 taxes: 64.3%
Here:
64%
State:
52%
(% for various income ranges: 57.9% for AGIs below $25k, 57.1% for AGIs $25k-50k, 71.4% for AGIs $50k-75k, 71.4% for AGIs $75k-100k, 77.8% for AGIs $100k-200k)
Averages for the 2004 tax year for zip code 83833, filed in 2005:
Average Adjusted Gross Income (AGI) in 2004: $50,387 (Individual Income Tax Returns)
Here:
$50,387
State:
$42,679
Salary/wage: $38,748 (reported on 71.1% of returns)
Here:
$38,748
State:
$35,636
(% of AGI for various income ranges: 188.8% for AGIs below $10k, 53.7% for AGIs $10k-25k, 65.5% for AGIs $25k-50k, 57.5% for AGIs $50k-75k, 57.4% for AGIs $75k-100k, 45.7% for AGIs over 100k)
Taxable interest for individuals: $2,961 (reported on 55.5% of returns)
This zip code:
$2,961
Idaho:
$2,024
(% of AGI for various income ranges: 15.4% for AGIs below $10k, 7.5% for AGIs $10k-25k, 1.8% for AGIs $25k-50k, 3.6% for AGIs $50k-75k, 1.8% for AGIs $75k-100k, 3.2% for AGIs over 100k)
Taxable dividends: $2,846 (reported on 34.0% of returns)
Here:
$2,846
State:
$2,917
(% of AGI for various income ranges: 15.4% for AGIs below $10k, 4.1% for AGIs $10k-25k, 1.6% for AGIs $25k-50k, 1.4% for AGIs $50k-75k, 2.7% for AGIs $75k-100k, 1.3% for AGIs over 100k)
Net capital gain/loss: +$18,957 (reported on 33.8% of returns)
Here:
+$18,957
State:
+$13,146
(% of AGI for various income ranges: -4.2% for AGIs below $10k, -2.0% for AGIs $10k-25k, 1.8% for AGIs $25k-50k, 3.1% for AGIs $50k-75k, 9.5% for AGIs $75k-100k, 25.7% for AGIs over 100k)
Profit/loss from business: +$5,142 (reported on 23.0% of returns)
Here:
+$5,142
State:
+$8,765
(% of AGI for various income ranges: 45.8% for AGIs below $10k, 9.1% for AGIs $10k-25k, 2.5% for AGIs $25k-50k, 1.3% for AGIs $50k-75k, 4.1% for AGIs $75k-100k, 0.0% for AGIs over 100k)
IRA payment deduction: $3,471 (reported on 3.1% of returns)
83833:
$3,471
Idaho:
$3,020
Total itemized deductions: $21,488 (24% of AGI, reported on 37.1% of returns)
Here:
$21,488
State:
$18,385
Here:
24.4% of AGI
State:
23.1% of AGI
(% of AGI for various income ranges: 24.4% for AGIs $10k-25k, 14.3% for AGIs $25k-50k, 15.3% for AGIs $50k-75k, 21.9% for AGIs $75k-100k, 13.0% for AGIs over 100k)
Charity contributions deductions: $3,663 (4% of AGI, reported on 31.1% of returns)
Here:
$3,663
State:
$3,875
Here:
3.9% of AGI
State:
4.6% of AGI
(% of AGI for various income ranges: 1.9% for AGIs $10k-25k, 1.2% for AGIs $25k-50k, 1.5% for AGIs $50k-75k, 2.6% for AGIs $75k-100k, 3.0% for AGIs over 100k)
Total tax: $7,722 (reported on 77.9% of returns)
83833:
$7,722
State:
$6,282
(% of AGI for various income ranges: 8.4% for AGIs below $10k, 4.1% for AGIs $10k-25k, 7.3% for AGIs $25k-50k, 8.1% for AGIs $50k-75k, 8.9% for AGIs $75k-100k, 18.2% for AGIs over 100k)
Earned income credit: $1,217 (reported on 12.5% of returns)
Here:
$1,217
State:
$1,660
Percentage of individuals using paid preparers for their 2004 taxes: 65.1%
Here:
65%
State:
59%
(% for various income ranges: 60.0% for AGIs below $10k, 61.6% for AGIs $10k-25k, 61.9% for AGIs $25k-50k, 69.8% for AGIs $50k-75k, 65.3% for AGIs $75k-100k, 84.6% for AGIs over 100k)
Notable locations in zip code 83833: Rainy Hill Guard Station (A), Mount Coeur D Alene Picnic Area (B), Mount Coeur D Alene Lookout (C), Camp Easton (D), Carlin Grange (E), Round Lake Access Area (F), Rainy Hill Campground (G), Bell Bay Campground (H), Harrison Boat Landing (I), Sqwe'mu'lmkhw (J), Thompson Lake Sportsman Access (K), Ne'atsqhaqhst'm Flat (L), Beauty Creek Campground (M), Beauty Bay Picnic Area (N), East Side Fire District 1 (O), East Side Fire District 3 (P), East Side Fire District 2 (Q), Saint Maries Fire Protection District Station 3 (R), Saint Maries Fire Protection District Station 2 (S). Display/hide their locations on the map
Lakes and reservoirs: Swan Lake (A), Anderson Lake (B), Blue Lake (C), Coeur d'Alene Lake (D), Harrison Slough (E), Thompson Lake (F). Display/hide their locations on the map
Rivers and creeks: Carrill Creek (A), Carlin Creek (B), Caribou Creek (C), Blue Lake Creek (D), Pleasant Creek (E), Beauty Creek (F), North Creek (G), Rose Creek (H), Steamchet Creek (I). Display/hide their locations on the map
In group quarters: 2 (-1 institutionalized population)
Size of family households: 382 2-persons, 61 3-persons, 27 4-persons, 6 5-persons, 6 6-persons
Size of nonfamily households: 228 1-person, 14 2-persons, 4 4-persons
22 married couples with children.
39 single-parent households (9 men, 30 women).
94.4% of residents of 83833 zip code speak English at home.
1.1% of residents speak Spanish at home (100% very well).
4.6% of residents speak other Indo-European language at home (100% very well).
0.2% of residents speak other language at home (100% very well).
Foreign born population: 101 (7.0%) (82.2% of them are naturalized citizens)
This zip code:
7.0%
Whole state:
6.0%
73%India
17%Sweden
9%France
7%United Kingdom, excluding England and Scotland
28%Irish
27%German
11%American
9%Armenian
5%English
4%Polish
2%Norwegian
Year of entry for the foreign-born population
02010 or later
92000 to 2009
01990 to 1999
85Before 1990
Facilities with environmental interests located in this zip code:
HARRISON HEIGHTS SUBDIVISION (2/3 MI SE OF HARRISON, HWY 97 in HARRISON, ID)
National Pollutant Discharge Elimination System NON-MAJOR (Tracking pollutant discharge elimination systems) - permit - ICIS-, ENFORCEMENT/COMPLIANCE ACTIVITY National Pollutant Discharge Elimination System NON-MAJOR (Tracking pollutant discharge elimination systems) - permit - ICIS-10-2004-0140, ENFORCEMENT/COMPLIANCE ACTIVITY Business SIC classification: GENERAL CONTRACTORS-SINGLE-FAMILY HOUSES Alternative names: HARRISON HEIGHTS LLC
HARRISON ELEMENTARY SCHOOL (13030 EAST O'GARA ROAD in HARRISON, ID)
(Geographic Names Information System) (National Center for Education Statistics) - STATE ID-274 102 Organizations: KOOTENAI JOINT SCHOOL DISTRICT 27 (SCHOOL DISTRICT)
KOOTENAI JR-SR HIGH SCHOOL (13030 EAST O'GARA ROAD in HARRISON, ID)
(National Center for Education Statistics) - STATE ID-274 501 Organizations: KOOTENAI JOINT SCHOOL DISTRICT 27 (SCHOOL DISTRICT)
CHRISTOPHER A WALSH (9338 CARIBOU RIDGE RD in HARRISON, ID)
USED OIL PROGRAM (Resource Conservation and Recovery Act (tracking hazardous waste)) Business NAICS classification: OTHER WASTE COLLECTION.
CONSTRUCTION SITE (7277 SOUTH GOZZER ROAD in HARRISON, ID)
National Pollutant Discharge Elimination System NON-MAJOR (Tracking pollutant discharge elimination systems) - permit Business SIC classification: GENERAL CONTRACTORS-RESIDENTIAL BUILDINGS, OTHER THAN SINGLE-FAMILY Alternative names: GOZZER RANCH GOLF & LAKE CLUB
KOOTENAI SD 274 (8100 E OGARA RD in HARRISON, ID)
COMPLIANCE ACTIVITY (Tracking inspections of insecticide, fungicide, and rodenticide, and toxic substances)
FOX FIRE MARINA (250 LAKEFRONT DR. in HARRISON, ID)
ENFORCEMENT/COMPLIANCE ACTIVITY (Integrated Compliance Information System)
KOOTENAI SD 274 (HWY 3 & 97 .25 MI W OF INT in HARRISON, ID)
COMPLIANCE ACTIVITY (Tracking inspections of insecticide, fungicide, and rodenticide, and toxic substances)
KOOTENAI SD 274 (RT 1 BOX 25 in HARRISON, ID)
COMPLIANCE ACTIVITY (Tracking inspections of insecticide, fungicide, and rodenticide, and toxic substances)
Housing units lacking complete plumbing facilities: 0.8% Housing units lacking complete kitchen facilities: 0.5%
45.5%Electricity
24.9%Wood
18.9%Bottled, tank, or LP gas
5.2%Fuel oil, kerosene, etc.
3.6%Utility gas
2.3%Other fuel
Population in 1990: 1,077. Population change in the 1990s: +316 (+29.3%).
Place of birth for U.S.-born residents:
This state: 447
Northeast: 96
Midwest: 167
South: 98
West: 543
62% of the 83833 zip code residents lived in the same house 5 years ago. Out of people who lived in different houses, 26% lived in this county. Out of people who lived in different counties, 50% lived in Idaho.
92% of the 83833 zip code residents lived in the same house 1 year ago. Out of people who lived in different houses, 48% moved from this county. Out of people who lived in different houses, 4% moved from different county within same state. Out of people who lived in different houses, 44% moved from different state. Out of people who lived in different houses, 6% moved from abroad.
Private vs. public school enrollment:
Students in private schools in grades 1 to 8 (elementary and middle school): 3
Here:
6.1%
Idaho:
13.5%
Students in private schools in grades 9 to 12 (high school): 2
Here:
4.9%
Idaho:
8.5%
Students in private undergraduate colleges: 7
Here:
21.1%
Idaho:
30.0%
Occupation by median earnings in the past 12 months ($)
103,693Health diagnosing and treating practitioners and other technical occupations
92,051Construction and extraction occupations
86,245Production occupations
85,231Transportation occupations
73,892Business and financial operations occupations
57,459Management occupations
Top industries in this zip code by the number of employees in 2005:
Construction: Other Heavy and Civil Engineering Construction (20-49 employees: 1 establishment)
Accommodation and Food Services: Full-Service Restaurants (5-9: 1, 1-4: 5)
Real Estate and Rental and Leasing: Offices of Real Estate Agents and Brokers (10-19: 1)
Accommodation and Food Services: Recreational and Vacation Camps (except Campgrounds) (10-19: 1)
Administrative and Support and Waste Management and Remediation Services: Landscaping Services (1-4: 2)
Construction: Framing Contractors (1-4: 2)
Wholesale Trade: Other Construction Material Merchant Wholesalers (1-4: 1)
Home Mortgage Disclosure Act Aggregated Statistics For Year 2009 (Based on 4 partial tracts)
A) FHA, FSA/RHS & VA Home Purchase Loans
B) Conventional Home Purchase Loans
C) Refinancings
D) Home Improvement Loans
F) Non-occupant Loans on < 5 Family Dwellings (A B C & D)
G) Loans On Manufactured Home Dwelling (A B C & D)
Number
Average Value
Number
Average Value
Number
Average Value
Number
Average Value
Number
Average Value
Number
Average Value
LOANS ORIGINATED
1
$203,360
11
$367,774
53
$299,712
3
$329,653
27
$441,931
4
$154,700
APPLICATIONS APPROVED, NOT ACCEPTED
0
$0
2
$199,545
6
$290,887
0
$0
2
$468,045
1
$115,770
APPLICATIONS DENIED
1
$334,320
2
$246,660
22
$317,178
2
$188,075
9
$364,754
2
$160,365
APPLICATIONS WITHDRAWN
1
$170,040
2
$553,050
11
$248,782
1
$15,660
4
$368,450
2
$87,790
FILES CLOSED FOR INCOMPLETENESS
0
$0
0
$0
2
$385,290
0
$0
1
$617,460
0
$0
Aggregated Statistics For Year 2008 (Based on 4 partial tracts)
A) FHA, FSA/RHS & VA Home Purchase Loans
B) Conventional Home Purchase Loans
C) Refinancings
D) Home Improvement Loans
F) Non-occupant Loans on < 5 Family Dwellings (A B C & D)
G) Loans On Manufactured Home Dwelling (A B C & D)
Number
Average Value
Number
Average Value
Number
Average Value
Number
Average Value
Number
Average Value
Number
Average Value
LOANS ORIGINATED
1
$153,140
11
$449,009
27
$366,013
4
$184,612
17
$534,058
3
$128,323
APPLICATIONS APPROVED, NOT ACCEPTED
0
$0
1
$761,720
6
$317,947
0
$0
3
$602,900
1
$162,470
APPLICATIONS DENIED
1
$96,720
2
$281,540
16
$298,628
1
$206,530
3
$443,800
3
$105,530
APPLICATIONS WITHDRAWN
0
$0
1
$588,170
9
$385,932
1
$63,420
2
$742,475
1
$160,380
FILES CLOSED FOR INCOMPLETENESS
0
$0
0
$0
1
$432,160
0
$0
0
$0
0
$0
Aggregated Statistics For Year 2007 (Based on 4 partial tracts)
B) Conventional Home Purchase Loans
C) Refinancings
D) Home Improvement Loans
F) Non-occupant Loans on < 5 Family Dwellings (A B C & D)
G) Loans On Manufactured Home Dwelling (A B C & D)
Number
Average Value
Number
Average Value
Number
Average Value
Number
Average Value
Number
Average Value
LOANS ORIGINATED
19
$484,489
32
$287,049
8
$154,359
21
$457,215
5
$155,622
APPLICATIONS APPROVED, NOT ACCEPTED
4
$483,020
8
$383,630
1
$31,480
4
$751,225
1
$293,030
APPLICATIONS DENIED
3
$325,227
18
$329,298
4
$86,552
4
$442,700
2
$124,475
APPLICATIONS WITHDRAWN
3
$345,303
8
$250,482
1
$95,700
2
$436,225
1
$117,650
FILES CLOSED FOR INCOMPLETENESS
0
$0
2
$394,430
0
$0
0
$0
0
$0
Aggregated Statistics For Year 2006 (Based on 4 partial tracts)
A) FHA, FSA/RHS & VA Home Purchase Loans
B) Conventional Home Purchase Loans
C) Refinancings
D) Home Improvement Loans
F) Non-occupant Loans on < 5 Family Dwellings (A B C & D)
G) Loans On Manufactured Home Dwelling (A B C & D)
Number
Average Value
Number
Average Value
Number
Average Value
Number
Average Value
Number
Average Value
Number
Average Value
LOANS ORIGINATED
0
$0
22
$334,143
39
$237,826
7
$98,829
19
$367,106
6
$127,142
APPLICATIONS APPROVED, NOT ACCEPTED
0
$0
7
$178,964
7
$209,440
1
$34,340
5
$152,314
1
$105,680
APPLICATIONS DENIED
1
$109,000
10
$280,603
20
$259,992
5
$76,278
3
$532,513
7
$144,887
APPLICATIONS WITHDRAWN
0
$0
3
$361,543
8
$248,368
1
$171,860
1
$438,020
0
$0
FILES CLOSED FOR INCOMPLETENESS
0
$0
0
$0
3
$193,463
1
$61,220
0
$0
0
$0
Aggregated Statistics For Year 2005 (Based on 4 partial tracts)
A) FHA, FSA/RHS & VA Home Purchase Loans
B) Conventional Home Purchase Loans
C) Refinancings
D) Home Improvement Loans
F) Non-occupant Loans on < 5 Family Dwellings (A B C & D)
G) Loans On Manufactured Home Dwelling (A B C & D)
Number
Average Value
Number
Average Value
Number
Average Value
Number
Average Value
Number
Average Value
Number
Average Value
LOANS ORIGINATED
1
$147,870
31
$251,571
41
$210,863
6
$105,230
26
$281,521
6
$109,330
APPLICATIONS APPROVED, NOT ACCEPTED
0
$0
4
$280,840
8
$175,434
0
$0
3
$330,660
1
$52,780
APPLICATIONS DENIED
0
$0
8
$157,749
22
$155,694
3
$49,520
4
$233,768
6
$88,597
APPLICATIONS WITHDRAWN
0
$0
6
$183,515
11
$173,486
1
$391,620
4
$192,562
1
$129,440
FILES CLOSED FOR INCOMPLETENESS
0
$0
0
$0
3
$113,890
0
$0
0
$0
0
$0
Aggregated Statistics For Year 2004 (Based on 4 partial tracts)
A) FHA, FSA/RHS & VA Home Purchase Loans
B) Conventional Home Purchase Loans
C) Refinancings
D) Home Improvement Loans
F) Non-occupant Loans on < 5 Family Dwellings (A B C & D)
G) Loans On Manufactured Home Dwelling (A B C & D)
Detailed PMIC statistics for the following Tracts:0019.00
, 0021.00
2002 - 2018 National Fire Incident Reporting System (NFIRS) incidents
According to the data from the years 2002 - 2018 the average number of fire incidents per year is 12. The highest number of fire incidents - 19 took place in 2012, and the least - 2 in 2002. The data has an increasing trend.
When looking into fire subcategories, the most incidents belonged to: Outside Fires (56.9%), and Structure Fires (29.7%).
Fire incident types reported to NFIRS in Zip Code 83833

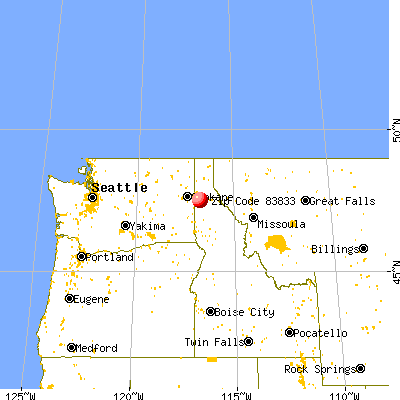


 Nearest zip codes: 83842, 83814, 83876, 83815, 83810, 83835.


 According to the data from the years 2002 - 2018 the average number of fire incidents per year is 12. The highest number of fire incidents - 19 took place in 2012, and the least - 2 in 2002. The data has an increasing trend.
 When looking into fire subcategories, the most incidents belonged to: Outside Fires (56.9%), and Structure Fires (29.7%).