Estimated zip code population in 2022: 2,000 Zip code population in 2010: 1,742 Zip code population in 2000: 1,603
Houses and condos: 1,050 Renter-occupied apartments: 257
% of renters here:
27%
State:
28%
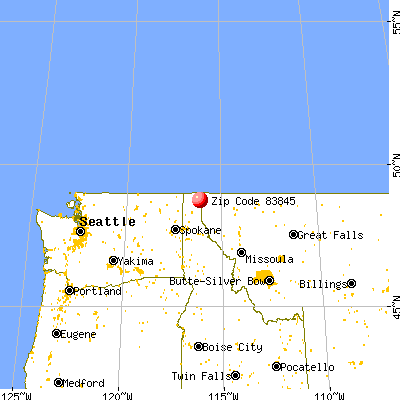
March 2022 cost of living index in zip code 83845: 87.5 (less than average, U.S. average is 100)
Land area: 94.0 sq. mi. Water area: 0.7 sq. mi.
Population density: 21 people per square mile
(very low).
OSM Map
General Map
Google Map
MSN Map
OSM Map
General Map
Google Map
MSN Map
OSM Map
General Map
Google Map
MSN Map
OSM Map
General Map
Google Map
MSN Map
Please wait while loading the map...
Real estate property taxes paid for housing units in 2022:
This zip code:
0.3% ($1,458)
Idaho:
0.5% ($1,995)
Median real estate property taxes paid for housing units with mortgages in 2022: $1,367 (0.3%) Median real estate property taxes paid for housing units with no mortgage in 2022: $1,730 (0.4%)
Estimated median house/condo value in 2022: $420,109
83845:
$420,109
Idaho:
$432,500
According to our research of Idaho and other state lists, there was 1 registered sex offender living in 83845 zip code as of May 28, 2024. The ratio of all residents to sex offenders in zip code 83845 is 1,567 to 1. The ratio of registered sex offenders to all residents in this zip code is much lower than the state average.
Median resident age:
This zip code:
49.5 years
Idaho median age:
37.5 years
Average household size:
This zip code:
2.1 people
Idaho:
2.6 people
Averages for the 2020 tax year for zip code 83845, filed in 2021:
Average Adjusted Gross Income (AGI) in 2020: $62,028 (Individual Income Tax Returns)
Here:
$62,028
State:
$73,627
Salary/wage: $45,412 (reported on 74.7% of returns)
Here:
$45,412
State:
$55,245
(% of AGI for various income ranges: 1196.8% for AGIs below $25k, 3275.8% for AGIs $25k-50k, 5980.0% for AGIs $50k-75k, 10232.5% for AGIs $75k-100k, 25872.5% for AGIs $100k-200k)
Taxable interest for individuals: $1,392 (reported on 33.3% of returns)
This zip code:
$1,392
Idaho:
$2,230
(% of AGI for various income ranges: 37.4% for AGIs below $25k, 30.0% for AGIs $25k-50k, 30.0% for AGIs $50k-75k, 90.0% for AGIs $75k-100k, 452.5% for AGIs $100k-200k)
Ordinary dividends: $3,300 (reported on 13.3% of returns)
Here:
$3,300
State:
$7,088
(% of AGI for various income ranges: 37.4% for AGIs below $25k, 56.7% for AGIs $25k-50k, 160.0% for AGIs $50k-75k, 157.5% for AGIs $100k-200k)
Net capital gain/loss in AGI: +$14,236 (reported on 18.7% of returns)
Here:
+$14,236
State:
+$37,284
(% of AGI for various income ranges: 52.6% for AGIs below $25k, 64.2% for AGIs $25k-50k, 436.2% for AGIs $50k-75k, 3667.5% for AGIs $100k-200k)
Profit/loss from business: +$8,192 (reported on 16.0% of returns)
Here:
+$8,192
State:
+$12,955
(% of AGI for various income ranges: 75.3% for AGIs below $25k, 357.5% for AGIs $25k-50k, 323.8% for AGIs $50k-75k, 380.0% for AGIs $75k-100k)
Taxable individual retirement arrangement distribution: $11,743 (reported on 9.3% of returns)
83845:
$11,743
Idaho:
$20,110
(% of AGI for various income ranges: 160.0% for AGIs below $25k, 647.5% for AGIs $50k-75k)
Total itemized deductions: $33,225 (reported on 5.3% of returns)
Here:
$33,225
State:
$38,402
(% of AGI for various income ranges: 455.0% for AGIs $25k-50k, 1957.5% for AGIs $100k-200k)
Charity contributions: $11,733 (reported on 4.0% of returns)
Here:
$11,733
State:
$18,314
(% of AGI for various income ranges: 880.0% for AGIs $75k-100k)
Taxes paid: $6,800 (reported on 5.3% of returns)
83845:
$6,800
State:
$7,596
(% of AGI for various income ranges: 68.3% for AGIs $25k-50k, 475.0% for AGIs $100k-200k)
Earned income credit: $2,508 (reported on 16.0% of returns)
Here:
$2,508
State:
$2,195
(% of AGI for various income ranges: 85.8% for AGIs below $25k, 115.0% for AGIs $25k-50k)
Percentage of individuals using paid preparers for their 2020 taxes: 96.0%
Here:
96%
State:
94%
(% for various income ranges: 96.4% for AGIs below $25k, 94.4% for AGIs $25k-50k, 100.0% for AGIs $50k-75k, 87.5% for AGIs $75k-100k, 100.0% for AGIs $100k-200k, 100.0% for AGIs over 200k)
Averages for the 2012 tax year for zip code 83845, filed in 2013:
Average Adjusted Gross Income (AGI) in 2012: $38,855 (Individual Income Tax Returns)
Here:
$38,855
State:
$52,536
Salary/wage: $33,907 (reported on 74.5% of returns)
Here:
$33,907
State:
$41,938
(% of AGI for various income ranges: 64.1% for AGIs below $25k, 68.5% for AGIs $25k-50k, 65.3% for AGIs $50k-75k, 62.3% for AGIs $75k-100k, 63.7% for AGIs $100k-200k)
Taxable interest for individuals: $1,575 (reported on 29.1% of returns)
This zip code:
$1,575
Idaho:
$1,874
(% of AGI for various income ranges: 1.1% for AGIs below $25k, 0.9% for AGIs $25k-50k, 1.9% for AGIs $50k-75k, 2.3% for AGIs $75k-100k)
Ordinary dividends: $1,233 (reported on 10.9% of returns)
Here:
$1,233
State:
$5,706
Net capital gain/loss in AGI: +$217 (reported on 10.9% of returns)
Here:
+$217
State:
+$14,571
Profit/loss from business: +$7,030 (reported on 18.2% of returns)
Here:
+$7,030
State:
+$10,113
(% of AGI for various income ranges: 9.8% for AGIs below $25k, 5.6% for AGIs $25k-50k, 2.7% for AGIs $50k-75k)
Taxable individual retirement arrangement distribution: $11,750 (reported on 7.3% of returns)
83845:
$11,750
Idaho:
$14,642
Total itemized deductions: $20,182 (24% of AGI, reported on 20.0% of returns)
Here:
$20,182
State:
$22,697
Here:
23.8% of AGI
State:
22.0% of AGI
(% of AGI for various income ranges: 15.5% for AGIs below $25k, 11.5% for AGIs $50k-75k, 12.2% for AGIs $75k-100k, 15.6% for AGIs $100k-200k)
Charity contributions: $4,675 (reported on 14.5% of returns)
Here:
$4,675
State:
$5,246
Taxes paid: $5,018 (reported on 20.0% of returns)
83845:
$5,018
State:
$7,139
(% of AGI for various income ranges: 2.4% for AGIs below $25k, 2.3% for AGIs $50k-75k, 3.2% for AGIs $75k-100k, 5.2% for AGIs $100k-200k)
Earned income credit: $1,938 (reported on 23.6% of returns)
Here:
$1,938
State:
$2,213
(% of AGI for various income ranges: 6.2% for AGIs below $25k, 1.4% for AGIs $25k-50k)
Percentage of individuals using paid preparers for their 2012 taxes: 63.6%
Here:
64%
State:
52%
(% for various income ranges: 56.0% for AGIs below $25k, 64.3% for AGIs $25k-50k, 75.0% for AGIs $50k-75k, 75.0% for AGIs $75k-100k, 75.0% for AGIs $100k-200k)
Averages for the 2004 tax year for zip code 83845, filed in 2005:
Average Adjusted Gross Income (AGI) in 2004: $29,223 (Individual Income Tax Returns)
Here:
$29,223
State:
$42,679
Salary/wage: $24,542 (reported on 80.8% of returns)
Here:
$24,542
State:
$35,636
(% of AGI for various income ranges: 107.3% for AGIs below $10k, 68.3% for AGIs $10k-25k, 75.6% for AGIs $25k-50k, 75.1% for AGIs $50k-75k, 93.4% for AGIs $75k-100k)
Taxable interest for individuals: $931 (reported on 34.4% of returns)
This zip code:
$931
Idaho:
$2,024
(% of AGI for various income ranges: 5.4% for AGIs below $10k, 2.6% for AGIs $10k-25k, 1.1% for AGIs $25k-50k, 0.3% for AGIs $50k-75k, 0.4% for AGIs $75k-100k)
Taxable dividends: $806 (reported on 9.4% of returns)
Here:
$806
State:
$2,917
Net capital gain/loss: +$7,016 (reported on 16.5% of returns)
Here:
+$7,016
State:
+$13,146
(% of AGI for various income ranges: -7.6% for AGIs below $10k, 3.1% for AGIs $25k-50k, 6.9% for AGIs $50k-75k, 14.8% for AGIs $75k-100k)
Profit/loss from business: +$3,548 (reported on 22.0% of returns)
Here:
+$3,548
State:
+$8,765
(% of AGI for various income ranges: 9.1% for AGIs below $10k, 10.2% for AGIs $10k-25k, 3.9% for AGIs $25k-50k, -3.6% for AGIs $50k-75k)
Total itemized deductions: $15,478 (28% of AGI, reported on 17.6% of returns)
Here:
$15,478
State:
$18,385
Here:
28.0% of AGI
State:
23.1% of AGI
(% of AGI for various income ranges: 34.7% for AGIs below $10k, 7.7% for AGIs $25k-50k, 12.5% for AGIs $50k-75k, 26.6% for AGIs $75k-100k)
Charity contributions deductions: $1,350 (2% of AGI, reported on 10.5% of returns)
Here:
$1,350
State:
$3,875
Here:
2.3% of AGI
State:
4.6% of AGI
Total tax: $3,004 (reported on 69.8% of returns)
83845:
$3,004
State:
$6,282
(% of AGI for various income ranges: 3.9% for AGIs below $10k, 4.2% for AGIs $10k-25k, 5.5% for AGIs $25k-50k, 7.5% for AGIs $50k-75k, 9.8% for AGIs $75k-100k, 14.0% for AGIs over 100k)
Earned income credit: $1,931 (reported on 26.5% of returns)
Here:
$1,931
State:
$1,660
Percentage of individuals using paid preparers for their 2004 taxes: 69.3%
Here:
69%
State:
59%
(% for various income ranges: 65.9% for AGIs below $10k, 67.5% for AGIs $10k-25k, 69.6% for AGIs $25k-50k, 76.9% for AGIs $50k-75k, 135.7% for AGIs $75k-100k)
Household received Food Stamps/SNAP in the past 12 months: 51 Household did not receive Food Stamps/SNAP in the past 12 months: 886
Women who had a birth in the past 12 months: 13 (12 now married, 0 unmarried) Women who did not have a birth in the past 12 months: 416 (205 now married, 210 unmarried)
Housing units in zip code 83845 with a mortgage: 291 (11 second mortgage) Median monthly owner costs for units with a mortgage: $1,425 Median monthly owner costs for units without a mortgage: $367
Residents with income below the poverty level in 2022:
This zip code:
14.8%
Whole state:
10.7%
Residents with income below 50% of the poverty level in 2022:
This zip code:
7.6%
Whole state:
6.1%
Median number of rooms in houses and condos:
Here:
6.4
State:
6.5
Median number of rooms in apartments:
Here:
4.0
State:
4.4
Notable locations in this zip code not listed on our city pages
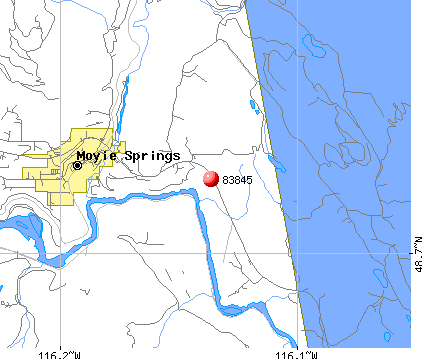
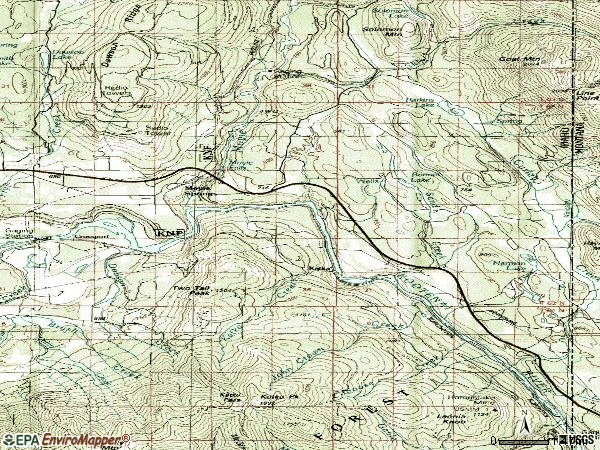
Notable locations in zip code 83845: Moyie River Access Area (A), Bonner Lake Access Area (B), Meadow Creek Campground (C), Curley Creek Volunteer Fire Department Station 2 (D), Moyie Springs Fire Department (E), Curley Creek Volunteer Fire Department (F). Display/hide their locations on the map
Creeks: Placer Creek (A), Orser Creek (B), Sand Creek (C), Skin Creek (D), Solomon Creek (E), Mill Creek (F), Lime Creek (G), Kingsley Creek (H), Keno Creek (I). Display/hide their locations on the map
Size of family households: 481 2-persons, 42 3-persons, 54 4-persons, 19 5-persons, 27 6-persons, 23 7-or-more-persons
Size of nonfamily households: 235 1-person, 44 2-persons
331 married couples with children.
22 single-parent households (22 women).
96.7% of residents of 83845 zip code speak English at home.
1.7% of residents speak Spanish at home (73% very well, 27% not well).
1.2% of residents speak other Indo-European language at home (100% very well).
0.3% of residents speak Asian or Pacific Island language at home (100% very well).
0.4% of residents speak other language at home (100% very well).
Foreign born population: 24 (1.2%) (4.6% of them are naturalized citizens)
This zip code:
1.2%
Whole state:
6.0%
30%Malaysia
22%Netherlands
4%Germany
35%American
20%English
13%German
3%Italian
3%Scotch-Irish
3%Scottish
2%European
Year of entry for the foreign-born population
82010 or later
52000 to 2009
41990 to 1999
49Before 1990
Facilities with environmental interests located in this zip code:
EVERGREEN ELEMENTARY SCHOOL (HIGHWAY 2 in MOYIE SPRINGS, ID)
(Geographic Names Information System) (National Center for Education Statistics) - STATE ID-101 106 Organizations: BOUNDARY COUNTY SCHOOL DISTRICT 101 (SCHOOL DISTRICT)
LOUISIANA PACIFIC CORPORATION MOYIE SPRINGS (HIGHWAY 2 1 MILE OFF in MOYIE SPRINGS, ID)
AIR MAJOR (AIRS/AFS) Conditionally Exempt Small Quantity Generators, less than 100 kg/month of hazardous waste (Resource Conservation and Recovery Act (tracking hazardous waste)) - notification TRI REPORTER (Tracking of toxic chemicals releasing facilities) Business SIC classification: SAWMILLS AND PLANING MILLS, GENERAL Business NAICS classification: SAWMILLS. Organizations: MOYIE SPRINGS LUMBER CO LLC (CONTACT/OPERATOR)
, LOUISIANA-PACIFIC CORPORATION (CONTACT/OWNER)
Alternative names: RILEY CREEK MOYIE SPRINGS
NORTH IDAHO ENERGY LOGS (OLD HWY 2, 1.5 MI W MOYIE SPRG in MOYIE SPRINGS, ID)
AIR MINOR (AIRS/AFS) Business SIC classification: WOOD PRODUCTS
LOUISIANA PACIFIC CORP. (OLD HWY. 2 in MOYIE SPRINGS, ID)
CRITERIA AND HAZARDOUS AIR POLLUTANT INVENTORY (Inventory of air pollution sources) Business SIC classification: SAWMILLS AND PLANING MILLS, GENERAL Alternative names: LOUISIANA PACIFIC CORP NW REGION
46.3%Utility gas
35.2%Electricity
14.0%Wood
3.2%Other fuel
1.6%Bottled, tank, or LP gas
Population in 1990: 1,496. Population change in the 1990s: +107 (+7.2%).
Place of birth for U.S.-born residents:
This state: 458
Northeast: 55
Midwest: 274
South: 314
West: 847
57% of the 83845 zip code residents lived in the same house 5 years ago. Out of people who lived in different houses, 37% lived in this county. Out of people who lived in different counties, 50% lived in Idaho.
80% of the 83845 zip code residents lived in the same house 1 year ago. Out of people who lived in different houses, 37% moved from different county within same state. Out of people who lived in different houses, 63% moved from different state.
Private vs. public school enrollment:
Students in private schools in grades 1 to 8 (elementary and middle school): 68
Here:
44.6%
Idaho:
13.5%
Students in private schools in grades 9 to 12 (high school): 20
Here:
41.8%
Idaho:
8.5%
Students in private undergraduate colleges: 77
Here:
75.7%
Idaho:
30.0%
Occupation by median earnings in the past 12 months ($)
132,724Architecture and engineering occupations
107,618Law enforcement workers including supervisors
102,792Health diagnosing and treating practitioners and other technical occupations
74,770Management occupations
59,690Building and grounds cleaning and maintenance occupations
57,711Production occupations
Top industries in this zip code by the number of employees in 2005:
Construction: New Single-Family Housing Construction (except Operative Builders) (5-9 employees: 1 establishment, 1-4 employees: 1 establishment)
Professional, Scientific, and Technical Services: Other Services Related to Advertising (5-9: 1)
Construction: Highway, Street, and Bridge Construction (5-9: 1)
Wholesale Trade: Other Professional Equipment and Supplies Merchant Wholesalers (5-9: 1)
Construction: Water and Sewer Line and Related Structures Construction (1-4: 1)
People in group quarters in 2000:
7 people in other nonhousehold living situations
Fatal accident statistics in 2014:
Fatal accident count: 1
Vehicles involved in fatal accidents: 1
Fatal accidents caused by drunken drivers: 1
Fatalities: 1
Persons involved in fatal accidents: 1
Pedestrians involved in fatal accidents: 0
Fatal accident statistics in 2013:
Fatal accident count: 1
Vehicles involved in fatal accidents: 1
Fatal accidents caused by drunken drivers: 1
Fatalities: 1
Persons involved in fatal accidents: 1
Pedestrians involved in fatal accidents: 0
2002 - 2018 National Fire Incident Reporting System (NFIRS) incidents
According to the data from the years 2002 - 2018 the average number of fires per year is 8. The highest number of fire incidents - 16 took place in 2016, and the least - 0 in 2015. The data has a decreasing trend.
When looking into fire subcategories, the most incidents belonged to: Outside Fires (60.6%), and Structure Fires (32.4%).
Fire incident types reported to NFIRS in Zip Code 83845


 Nearest zip codes: 83826, 59935, 83847, 83805, 83864, 83836.


 According to the data from the years 2002 - 2018 the average number of fires per year is 8. The highest number of fire incidents - 16 took place in 2016, and the least - 0 in 2015. The data has a decreasing trend.
 When looking into fire subcategories, the most incidents belonged to: Outside Fires (60.6%), and Structure Fires (32.4%).