Estimated zip code population in 2022: 10,563 Zip code population in 2010: 9,818 Zip code population in 2000: 7,576
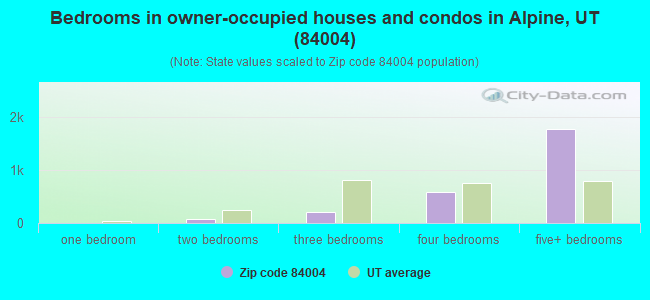
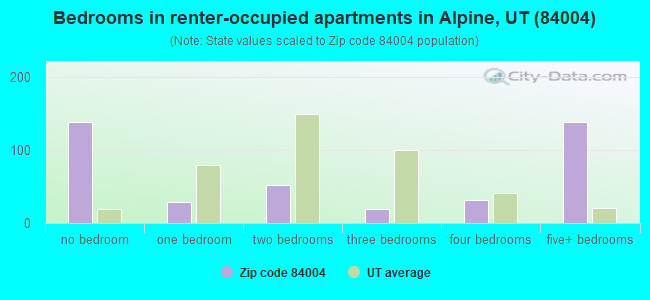
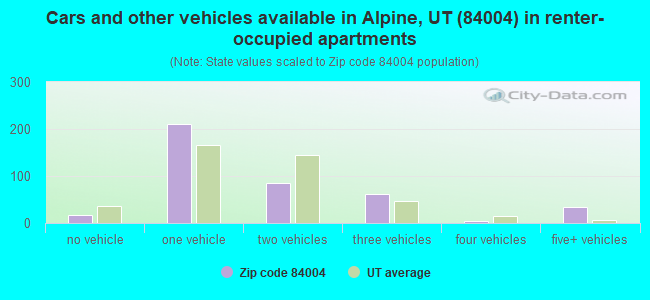
Houses and condos: 3,109 Renter-occupied apartments: 405
% of renters here:
13%
State:
29%
March 2022 cost of living index in zip code 84004: 94.0 (less than average, U.S. average is 100)
Land area: 29.3 sq. mi. Water area: 0.0 sq. mi.
Population density: 360 people per square mile
(very low).
OSM Map
General Map
Google Map
MSN Map
OSM Map
General Map
Google Map
MSN Map
OSM Map
General Map
Google Map
MSN Map
OSM Map
General Map
Google Map
MSN Map
Please wait while loading the map...
Real estate property taxes paid for housing units in 2022:
This zip code:
0.4% ($3,591)
Utah:
0.5% ($2,376)
Median real estate property taxes paid for housing units with mortgages in 2022: $3,257 (0.3%) Median real estate property taxes paid for housing units with no mortgage in 2022: $3,990 (0.4%)
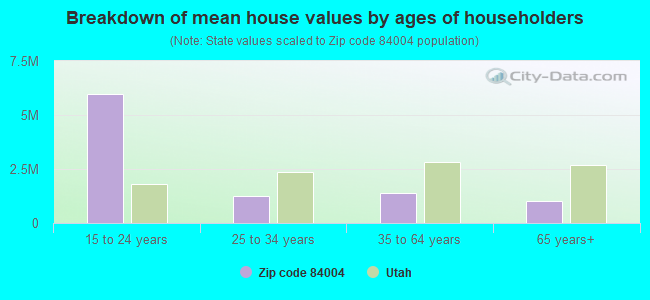
Estimated median house/condo value in 2022: $997,533
84004:
$997,533
Utah:
$499,500
According to our research of Utah and other state lists, there were 3 registered sex offenders living in 84004 zip code as of May 15, 2024. The ratio of all residents to sex offenders in zip code 84004 is 3,465 to 1. The ratio of registered sex offenders to all residents in this zip code is much lower than the state average.
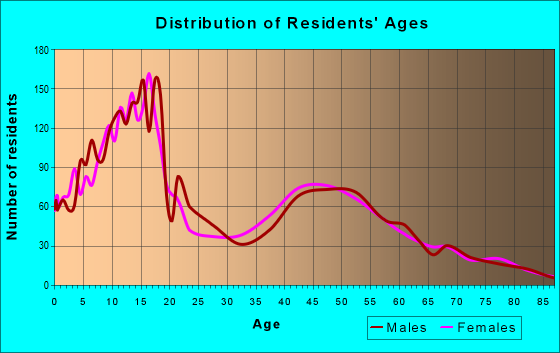
Median resident age:
This zip code:
35.8 years
Utah median age:
32.1 years
Average household size:
This zip code:
3.5 people
Utah:
3.0 people
Averages for the 2020 tax year for zip code 84004, filed in 2021:
Average Adjusted Gross Income (AGI) in 2020: $338,796 (Individual Income Tax Returns)
Here:
$338,796
State:
$81,660
Salary/wage: $128,521 (reported on 80.7% of returns)
Here:
$128,521
State:
$63,027
(% of AGI for various income ranges: 1268.0% for AGIs below $25k, 3593.9% for AGIs $25k-50k, 6699.2% for AGIs $50k-75k, 9948.1% for AGIs $75k-100k, 19859.2% for AGIs $100k-200k, 120090.0% for AGIs over 200k)
Taxable interest for individuals: $7,672 (reported on 45.4% of returns)
This zip code:
$7,672
Utah:
$2,255
(% of AGI for various income ranges: 34.8% for AGIs below $25k, 60.2% for AGIs $25k-50k, 180.0% for AGIs $50k-75k, 346.9% for AGIs $75k-100k, 367.6% for AGIs $100k-200k, 4595.9% for AGIs over 200k)
Ordinary dividends: $15,158 (reported on 30.6% of returns)
Here:
$15,158
State:
$7,362
(% of AGI for various income ranges: 32.7% for AGIs below $25k, 88.3% for AGIs $25k-50k, 250.8% for AGIs $50k-75k, 526.9% for AGIs $75k-100k, 565.4% for AGIs $100k-200k, 6010.7% for AGIs over 200k)
Net capital gain/loss in AGI: +$405,984 (reported on 35.4% of returns)
Here:
+$405,984
State:
+$43,433
(% of AGI for various income ranges: 18.9% for AGIs below $25k, 99.1% for AGIs $25k-50k, 256.2% for AGIs $50k-75k, 506.9% for AGIs $75k-100k, 1451.9% for AGIs $100k-200k, 231819.6% for AGIs over 200k)
Profit/loss from business: +$16,764 (reported on 21.5% of returns)
Here:
+$16,764
State:
+$9,957
(% of AGI for various income ranges: 65.5% for AGIs below $25k, 248.5% for AGIs $25k-50k, 458.8% for AGIs $50k-75k, 583.1% for AGIs $75k-100k, 873.8% for AGIs $100k-200k, 3308.5% for AGIs over 200k)
Taxable individual retirement arrangement distribution: $30,115 (reported on 9.3% of returns)
84004:
$30,115
Utah:
$21,167
(% of AGI for various income ranges: 33.3% for AGIs below $25k, 182.2% for AGIs $25k-50k, 331.2% for AGIs $50k-75k, 710.6% for AGIs $75k-100k, 893.8% for AGIs $100k-200k, 2212.6% for AGIs over 200k)
Self-employed (Keogh) retirement plans: $50,075 (reported on 0.9% of returns)
84004:
$50,075
Utah:
$29,069
(% of AGI for various income ranges: 741.9% for AGIs over 200k)
Total itemized deductions: $124,209 (reported on 34.7% of returns)
Here:
$124,209
State:
$41,056
(% of AGI for various income ranges: 105.6% for AGIs below $25k, 313.0% for AGIs $25k-50k, 849.2% for AGIs $50k-75k, 2562.5% for AGIs $75k-100k, 4845.7% for AGIs $100k-200k, 60590.0% for AGIs over 200k)
Charity contributions: $102,630 (reported on 33.6% of returns)
Here:
$102,630
State:
$22,261
(% of AGI for various income ranges: 14.9% for AGIs below $25k, 80.2% for AGIs $25k-50k, 312.5% for AGIs $50k-75k, 1082.5% for AGIs $75k-100k, 2199.5% for AGIs $100k-200k, 52137.0% for AGIs over 200k)
Taxes paid: $9,036 (reported on 34.7% of returns)
84004:
$9,036
State:
$7,985
(% of AGI for various income ranges: 17.0% for AGIs below $25k, 57.4% for AGIs $25k-50k, 151.2% for AGIs $50k-75k, 537.5% for AGIs $75k-100k, 1119.2% for AGIs $100k-200k, 2980.0% for AGIs over 200k)
Earned income credit: $1,669 (reported on 6.6% of returns)
Here:
$1,669
State:
$2,169
(% of AGI for various income ranges: 31.3% for AGIs below $25k, 44.6% for AGIs $25k-50k)
Percentage of individuals using paid preparers for their 2020 taxes: 93.4%
Here:
93%
State:
94%
(% for various income ranges: 92.5% for AGIs below $25k, 93.8% for AGIs $25k-50k, 95.0% for AGIs $50k-75k, 93.3% for AGIs $75k-100k, 92.2% for AGIs $100k-200k, 94.8% for AGIs over 200k)
Averages for the 2012 tax year for zip code 84004, filed in 2013:
Average Adjusted Gross Income (AGI) in 2012: $141,035 (Individual Income Tax Returns)
Here:
$141,035
State:
$60,327
Salary/wage: $86,561 (reported on 81.5% of returns)
Here:
$86,561
State:
$48,762
(% of AGI for various income ranges: 75.6% for AGIs below $25k, 68.7% for AGIs $25k-50k, 62.9% for AGIs $50k-75k, 67.4% for AGIs $75k-100k, 72.0% for AGIs $100k-200k, 40.2% for AGIs over 200k)
Taxable interest for individuals: $6,081 (reported on 49.2% of returns)
This zip code:
$6,081
Utah:
$1,534
(% of AGI for various income ranges: 2.5% for AGIs below $25k, 1.5% for AGIs $25k-50k, 2.0% for AGIs $50k-75k, 1.1% for AGIs $75k-100k, 2.1% for AGIs $100k-200k, 2.2% for AGIs over 200k)
Ordinary dividends: $9,577 (reported on 24.2% of returns)
Here:
$9,577
State:
$5,711
(% of AGI for various income ranges: 2.0% for AGIs below $25k, 1.9% for AGIs $25k-50k, 1.2% for AGIs $50k-75k, 2.0% for AGIs $75k-100k, 1.5% for AGIs $100k-200k, 1.7% for AGIs over 200k)
Net capital gain/loss in AGI: +$105,307 (reported on 27.9% of returns)
Here:
+$105,307
State:
+$23,734
(% of AGI for various income ranges: 0.2% for AGIs below $25k, 0.1% for AGIs $25k-50k, 0.6% for AGIs $50k-75k, 3.4% for AGIs $75k-100k, 4.1% for AGIs $100k-200k, 29.5% for AGIs over 200k)
Profit/loss from business: +$18,586 (reported on 21.6% of returns)
Here:
+$18,586
State:
+$8,845
(% of AGI for various income ranges: 7.1% for AGIs below $25k, 7.8% for AGIs $25k-50k, 4.0% for AGIs $50k-75k, 1.4% for AGIs $75k-100k, 3.0% for AGIs $100k-200k, 2.4% for AGIs over 200k)
Taxable individual retirement arrangement distribution: $25,131 (reported on 9.1% of returns)
84004:
$25,131
Utah:
$15,565
(% of AGI for various income ranges: 1.9% for AGIs below $25k, 3.5% for AGIs $25k-50k, 3.6% for AGIs $50k-75k, 5.0% for AGIs $75k-100k, 2.8% for AGIs $100k-200k, 0.9% for AGIs over 200k)
Self-employment retirement plans: $56,050 (reported on 1.0% of returns)
84004:
$56,050
Utah:
$22,655
Total itemized deductions: $50,777 (20% of AGI, reported on 52.6% of returns)
Here:
$50,777
State:
$25,197
Here:
20.3% of AGI
State:
22.4% of AGI
(% of AGI for various income ranges: 15.4% for AGIs below $25k, 23.4% for AGIs $25k-50k, 27.7% for AGIs $50k-75k, 29.7% for AGIs $75k-100k, 25.8% for AGIs $100k-200k, 15.7% for AGIs over 200k)
Charity contributions: $23,327 (reported on 50.3% of returns)
Here:
$23,327
State:
$8,502
(% of AGI for various income ranges: 2.6% for AGIs below $25k, 6.3% for AGIs $25k-50k, 9.9% for AGIs $50k-75k, 10.1% for AGIs $75k-100k, 9.8% for AGIs $100k-200k, 8.0% for AGIs over 200k)
Taxes paid: $12,598 (reported on 52.3% of returns)
84004:
$12,598
State:
$7,001
(% of AGI for various income ranges: 2.4% for AGIs below $25k, 3.9% for AGIs $25k-50k, 6.0% for AGIs $50k-75k, 6.4% for AGIs $75k-100k, 6.6% for AGIs $100k-200k, 4.1% for AGIs over 200k)
Earned income credit: $2,130 (reported on 9.6% of returns)
Here:
$2,130
State:
$2,259
(% of AGI for various income ranges: 3.6% for AGIs below $25k, 1.5% for AGIs $25k-50k)
Percentage of individuals using paid preparers for their 2012 taxes: 54.9%
Here:
55%
State:
51%
(% for various income ranges: 43.3% for AGIs below $25k, 51.0% for AGIs $25k-50k, 61.1% for AGIs $50k-75k, 58.6% for AGIs $75k-100k, 61.4% for AGIs $100k-200k, 78.0% for AGIs over 200k)
Averages for the 2004 tax year for zip code 84004, filed in 2005:
Average Adjusted Gross Income (AGI) in 2004: $115,085 (Individual Income Tax Returns)
Here:
$115,085
State:
$45,498
Salary/wage: $70,198 (reported on 81.2% of returns)
Here:
$70,198
State:
$38,975
(% of AGI for various income ranges: 66.5% for AGIs $10k-25k, 71.1% for AGIs $25k-50k, 66.0% for AGIs $50k-75k, 74.7% for AGIs $75k-100k, 42.9% for AGIs over 100k)
Taxable interest for individuals: $5,548 (reported on 59.7% of returns)
This zip code:
$5,548
Utah:
$1,445
(% of AGI for various income ranges: 3.0% for AGIs $10k-25k, 2.6% for AGIs $25k-50k, 2.0% for AGIs $50k-75k, 1.3% for AGIs $75k-100k, 2.9% for AGIs over 100k)
Taxable dividends: $4,852 (reported on 28.8% of returns)
Here:
$4,852
State:
$3,152
(% of AGI for various income ranges: 3.0% for AGIs $10k-25k, 1.3% for AGIs $25k-50k, 0.9% for AGIs $50k-75k, 1.2% for AGIs $75k-100k, 1.1% for AGIs over 100k)
Net capital gain/loss: +$38,538 (reported on 33.5% of returns)
Here:
+$38,538
State:
+$14,059
(% of AGI for various income ranges: 2.2% for AGIs $10k-25k, 2.3% for AGIs $25k-50k, 4.7% for AGIs $50k-75k, 1.3% for AGIs $75k-100k, 13.1% for AGIs over 100k)
Profit/loss from business: +$13,823 (reported on 24.1% of returns)
Here:
+$13,823
State:
+$6,903
(% of AGI for various income ranges: 9.8% for AGIs $10k-25k, 4.4% for AGIs $25k-50k, 2.8% for AGIs $50k-75k, 2.6% for AGIs $75k-100k, 2.6% for AGIs over 100k)
IRA payment deduction: $3,824 (reported on 2.8% of returns)
84004:
$3,824
Utah:
$2,970
(% of AGI for various income ranges: 0.3% for AGIs $25k-50k, 0.2% for AGIs $50k-75k, 0.3% for AGIs $75k-100k, 0.1% for AGIs over 100k)
Self-employed pension: $20,161 (reported on 1.0% of returns)
Here:
$20,161
Utah:
$14,916
Total itemized deductions: $46,043 (23% of AGI, reported on 54.1% of returns)
Here:
$46,043
State:
$20,312
Here:
22.7% of AGI
State:
24.9% of AGI
(% of AGI for various income ranges: 17.3% for AGIs $10k-25k, 30.2% for AGIs $25k-50k, 30.4% for AGIs $50k-75k, 31.8% for AGIs $75k-100k, 19.4% for AGIs over 100k)
Charity contributions deductions: $20,112 (10% of AGI, reported on 52.9% of returns)
Here:
$20,112
State:
$6,250
Here:
9.8% of AGI
State:
7.4% of AGI
(% of AGI for various income ranges: 4.4% for AGIs $10k-25k, 9.0% for AGIs $25k-50k, 10.6% for AGIs $50k-75k, 11.2% for AGIs $75k-100k, 9.0% for AGIs over 100k)
Total tax: $27,604 (reported on 73.2% of returns)
84004:
$27,604
State:
$6,523
(% of AGI for various income ranges: 5.0% for AGIs $10k-25k, 4.7% for AGIs $25k-50k, 5.7% for AGIs $50k-75k, 5.8% for AGIs $75k-100k, 20.2% for AGIs over 100k)
Earned income credit: $1,835 (reported on 7.1% of returns)
Here:
$1,835
State:
$1,703
Percentage of individuals using paid preparers for their 2004 taxes: 57.7%
Here:
58%
State:
53%
(% for various income ranges: 45.4% for AGIs below $10k, 55.0% for AGIs $10k-25k, 64.0% for AGIs $25k-50k, 62.8% for AGIs $50k-75k, 58.9% for AGIs $75k-100k, 66.8% for AGIs over 100k)
Household received Food Stamps/SNAP in the past 12 months: 24 Household did not receive Food Stamps/SNAP in the past 12 months: 3,000
Women who had a birth in the past 12 months: 76 (78 now married, 0 unmarried) Women who did not have a birth in the past 12 months: 2,204 (1,167 now married, 1,034 unmarried)
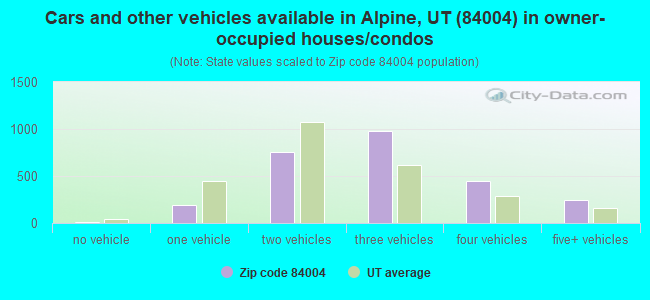
Housing units in zip code 84004 with a mortgage: 1,488 (250 second mortgage, 8 home equity loan, 253 both second mortgage and home equity loan) Houses without a mortgage: 83
Median monthly owner costs for units with a mortgage: $2,877 Median monthly owner costs for units without a mortgage: $673
Residents with income below the poverty level in 2022:
This zip code:
6.2%
Whole state:
8.2%
Residents with income below 50% of the poverty level in 2022:
This zip code:
3.3%
Whole state:
4.3%
Median number of rooms in houses and condos:
Here:
10.0
State:
7.6
Median number of rooms in apartments:
Here:
4.9
State:
4.3
Notable locations in this zip code not listed on our city pages
In group quarters: 5 (-1 institutionalized population)
Size of family households: 844 2-persons, 420 3-persons, 478 4-persons, 282 5-persons, 298 6-persons, 293 7-or-more-persons
Size of nonfamily households: 367 1-person, 16 3-persons
2,886 married couples with children.
114 single-parent households (52 men, 62 women).
90.0% of residents of 84004 zip code speak English at home.
4.0% of residents speak Spanish at home (97% very well, 3% well).
3.3% of residents speak other Indo-European language at home (73% very well, 15% well, 12% not well).
1.6% of residents speak Asian or Pacific Island language at home (91% very well, 9% not well).
0.2% of residents speak other language at home (100% very well).
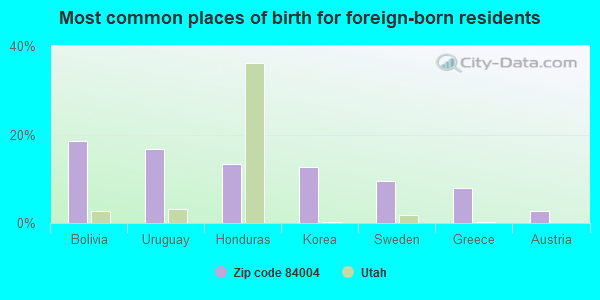
Foreign born population: 328 (3.1%) (51.1% of them are naturalized citizens)
This zip code:
3.1%
Whole state:
8.6%
18%Bolivia
17%Uruguay
13%Honduras
13%Korea
9%Sweden
8%Greece
3%Austria
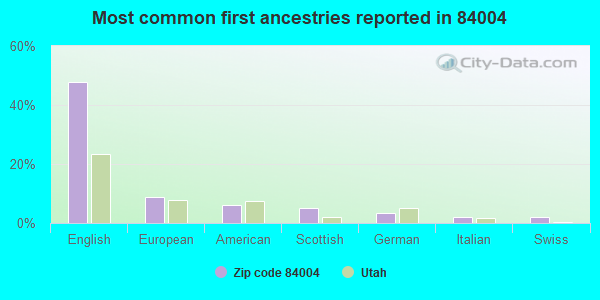
48%English
9%European
6%American
5%Scottish
3%German
2%Italian
2%Swiss
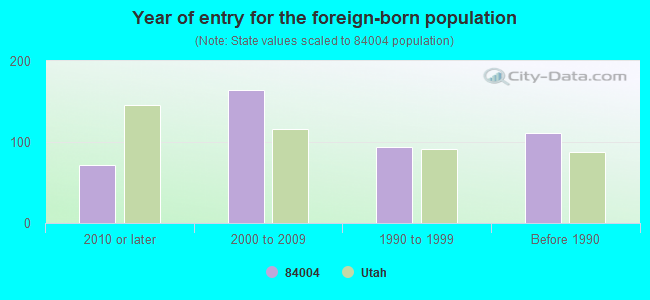
Year of entry for the foreign-born population
722010 or later
1642000 to 2009
941990 to 1999
111Before 1990
Facilities with environmental interests located in this zip code:
AMERICAN BIOTECH LABS (70 WEST CANYON CREST RD, SUITE D in ALPINE, UT)
(Integrated Compliance Information System) - ICIS-HQ-2003-5066, FORMAL ENFORCEMENT ACTION (Integrated Compliance Information System) - ICIS-HQ-2004-5113, FORMAL ENFORCEMENT ACTION
ALPINE ELEM SCH (400 E 300 N in ALPINE, UT)
(National Center for Education Statistics) - STATE ID-01 104 Organizations: ALPINE SCHOOL DISTRICT (SCHOOL DISTRICT)
ADONIS BRONZE (500 ALPINE HIGHWAY in ALPINE, UT)
AIR MINOR (AIRS/AFS) STATE MASTER (Utah compliance and permitting operations) Business SIC classification: NONFERROUS DIE-CASTINGS, EXCEPT ALUMINUM Alternative names: BRONZE MOLDING
Housing units lacking complete kitchen facilities: 4.8%
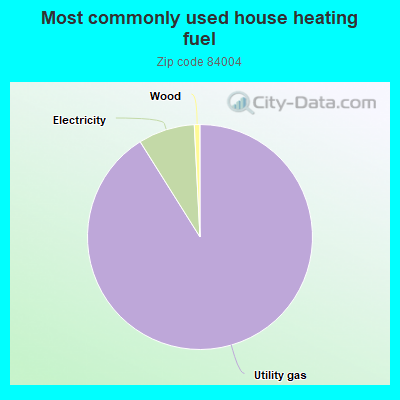
90.8%Utility gas
8.1%Electricity
0.8%Wood
Population in 1990: 3,665. Population change in the 1990s: +3,911 (+106.7%).
Place of birth for U.S.-born residents:
This state: 5,974
Northeast: 313
Midwest: 607
South: 648
West: 2,564
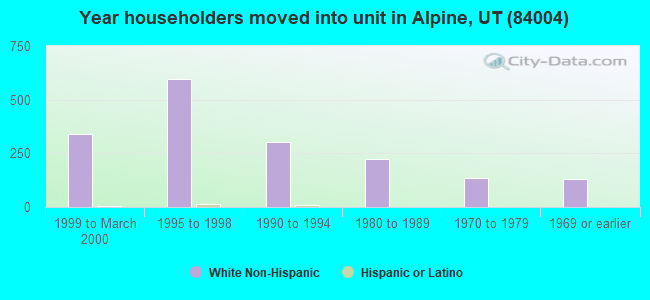
44% of the 84004 zip code residents lived in the same house 5 years ago. Out of people who lived in different houses, 41% lived in this county. Out of people who lived in different counties, 50% lived in Utah.
94% of the 84004 zip code residents lived in the same house 1 year ago. Out of people who lived in different houses, 56% moved from this county. Out of people who lived in different houses, 11% moved from different county within same state. Out of people who lived in different houses, 28% moved from different state. Out of people who lived in different houses, 11% moved from abroad.
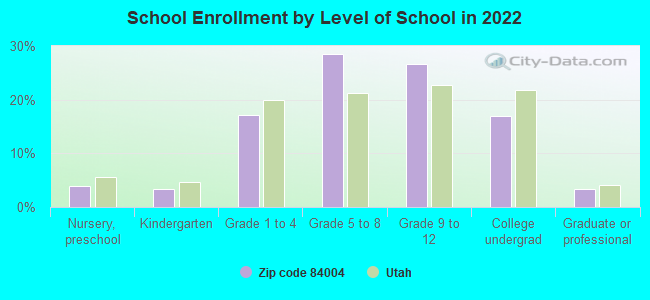
Private vs. public school enrollment:
Students in private schools in grades 1 to 8 (elementary and middle school): 147
Here:
8.7%
Utah:
7.2%
Students in private schools in grades 9 to 12 (high school): 54
Here:
5.5%
Utah:
5.3%
Students in private undergraduate colleges: 219
Here:
35.0%
Utah:
26.7%
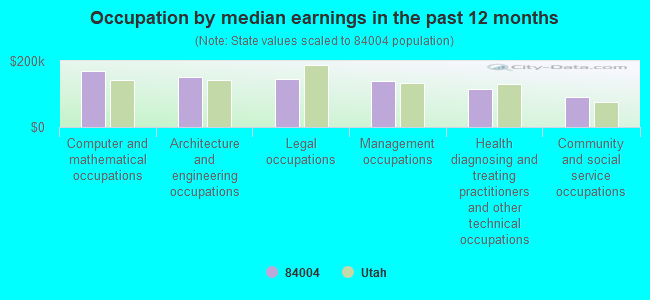
Occupation by median earnings in the past 12 months ($)
169,605Computer and mathematical occupations
152,160Architecture and engineering occupations
146,190Legal occupations
140,808Management occupations
114,707Health diagnosing and treating practitioners and other technical occupations
89,654Community and social service occupations
Companies with federal contracts located in this zip code (ALPINE, UT):
ALPINE INDUSTRIES (222 N 100 E; small business) : $2,740,080 in 38 contractsfrom 2000 to 2006
Contracts for Guided Missile and Space Vehicle Inert Propulsion Units, Solid Fuel; and Components, Aircraft Ground Servicing Equipment, Miscellaneous Electrical and Electronic Components, Aircraft Landing Gear Components, and moreby Air Force, Navy, Defense Logistics Agency, Army, and others Signed by year:2000: $460,416; 2001: $621,089; 2002: $310,462; 2003: $81,715; 2004: $463,517; 2005: $691,674; 2006: $111,207.
Biggest contracts:
$286,151 with Air Force for Guided Missile and Space Vehicle Inert Propulsion Units, Solid Fuel; and Components. Signed on 2001-04-25. Completion date: 2002-04-30.
$278,120 with Air Force for Aircraft Ground Servicing Equipment. Signed on 2002-09-30. Completion date: 2003-05-30.
$276,916 with Air Force for Guided Missile and Space Vehicle Inert Propulsion Units, Solid Fuel; and Components. Signed on 2005-08-12. Completion date: 2006-08-31.
$251,118 with Navy for Miscellaneous Electrical and Electronic Components. Signed on 2000-01-26. Completion date: 2000-12-21.
CHRISTENSEN, DANIEL (88 W CASCADE AVE; small business)
$15,449 with Army for Technical Assistance. Taking place in MS. Signed on 2006-05-02. Completion date: 2006-12-31.
LINGUATRONICS (165 W CANYON CREST RD; small business)
$15,000 with Air Force for ADPE System Configuration. Signed on 2005-09-22. Completion date: 2005-10-31.
VERACITY LC (100 W CANYON CREST RD; small business)
$8,937 with Air Force for Other Education and Training Services. Taking place in CA. Signed on 2005-09-01. Completion date: 2005-09-15.
LARSON, JERRY (453 W 800 S; small business)
$4,005 with Army for Lectures For Training. Taking place in CA. Signed on 2002-06-25. Completion date: 2002-07-19.
ALPINE COMMERCIAL INC (270 N MAIN ST)
-$802,954 with Navy for Maintenance, Repair or Alteration of Real Property -- Family Housing Facilities. Taking place in WA. Signed on 1999-10-07. Completion date: 1994-11-12.
Top industries in this zip code by the number of employees in 2005:
Health Care and Social Assistance: Residential Mental Health and Substance Abuse Facilities (100-249 employees: 1 establishment)
Real Estate and Rental and Leasing: Lessors of Residential Buildings and Dwellings (50-99: 1)
Construction: New Single-Family Housing Construction (except Operative Builders) (20-49: 1, 1-4: 9)
Finance and Insurance: Insurance Agencies and Brokerages (20-49: 1, 5-9: 1, 1-4: 3)
Accommodation and Food Services: Limited-Service Restaurants (10-19: 3)
Health Care and Social Assistance: Offices of Dentists (10-19: 2, 5-9: 1, 1-4: 2)
Professional, Scientific, and Technical Services: Other Accounting Services (20-49: 1, 1-4: 2)
Construction: Site Preparation Contractors (20-49: 1, 1-4: 1)
Home Mortgage Disclosure Act Aggregated Statistics For Year 2009 (Based on 2 full and 2 partial tracts)
A) FHA, FSA/RHS & VA Home Purchase Loans
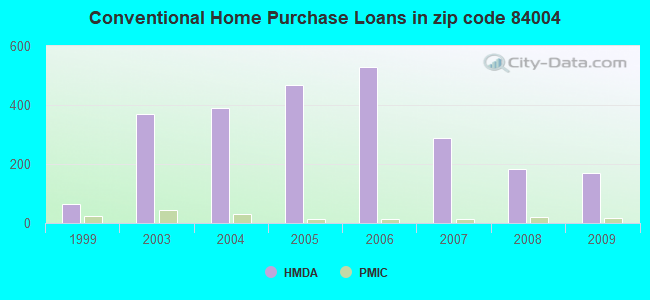
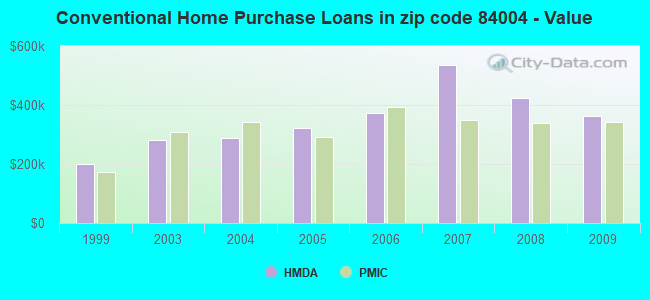
B) Conventional Home Purchase Loans
C) Refinancings
D) Home Improvement Loans
F) Non-occupant Loans on < 5 Family Dwellings (A B C & D)
Number
Average Value
Number
Average Value
Number
Average Value
Number
Average Value
Number
Average Value
LOANS ORIGINATED
32
$267,671
171
$362,082
712
$291,211
26
$140,478
38
$234,067
APPLICATIONS APPROVED, NOT ACCEPTED
0
$0
12
$545,905
94
$348,708
2
$7,765
6
$318,078
APPLICATIONS DENIED
8
$241,872
36
$664,971
237
$375,360
16
$133,200
18
$216,638
APPLICATIONS WITHDRAWN
4
$292,090
28
$445,745
144
$291,669
2
$50,410
9
$281,357
FILES CLOSED FOR INCOMPLETENESS
0
$0
4
$858,805
35
$346,239
4
$1,188,740
2
$155,265
Aggregated Statistics For Year 2008 (Based on 2 full and 2 partial tracts)
A) FHA, FSA/RHS & VA Home Purchase Loans
B) Conventional Home Purchase Loans
C) Refinancings
D) Home Improvement Loans
F) Non-occupant Loans on < 5 Family Dwellings (A B C & D)
G) Loans On Manufactured Home Dwelling (A B C & D)
Number
Average Value
Number
Average Value
Number
Average Value
Number
Average Value
Number
Average Value
Number
Average Value
LOANS ORIGINATED
12
$236,616
183
$422,791
429
$339,366
35
$133,250
38
$357,692
4
$84,910
APPLICATIONS APPROVED, NOT ACCEPTED
0
$0
31
$658,545
85
$487,200
2
$310,530
10
$710,721
0
$0
APPLICATIONS DENIED
0
$0
100
$1,023,318
173
$571,260
12
$119,538
28
$940,609
0
$0
APPLICATIONS WITHDRAWN
5
$226,956
44
$786,175
88
$437,422
6
$175,967
14
$497,159
0
$0
FILES CLOSED FOR INCOMPLETENESS
0
$0
10
$538,766
33
$703,670
2
$29,110
6
$296,295
0
$0
Aggregated Statistics For Year 2007 (Based on 2 full and 2 partial tracts)
A) FHA, FSA/RHS & VA Home Purchase Loans
B) Conventional Home Purchase Loans
C) Refinancings
D) Home Improvement Loans
F) Non-occupant Loans on < 5 Family Dwellings (A B C & D)
Number
Average Value
Number
Average Value
Number
Average Value
Number
Average Value
Number
Average Value
LOANS ORIGINATED
4
$200,872
289
$534,769
641
$415,011
59
$168,141
99
$541,975
APPLICATIONS APPROVED, NOT ACCEPTED
0
$0
69
$669,784
107
$417,678
16
$226,588
25
$386,994
APPLICATIONS DENIED
2
$195,050
170
$760,244
313
$612,610
38
$317,045
75
$727,644
APPLICATIONS WITHDRAWN
0
$0
62
$699,594
109
$547,274
10
$126,606
30
$829,394
FILES CLOSED FOR INCOMPLETENESS
0
$0
15
$623,551
42
$325,238
2
$53,370
3
$235,747
Aggregated Statistics For Year 2006 (Based on 2 full and 2 partial tracts)
A) FHA, FSA/RHS & VA Home Purchase Loans
B) Conventional Home Purchase Loans
C) Refinancings
D) Home Improvement Loans
F) Non-occupant Loans on < 5 Family Dwellings (A B C & D)
G) Loans On Manufactured Home Dwelling (A B C & D)
Number
Average Value
Number
Average Value
Number
Average Value
Number
Average Value
Number
Average Value
Number
Average Value
LOANS ORIGINATED
0
$0
530
$372,885
681
$357,344
69
$164,796
136
$330,701
0
$0
APPLICATIONS APPROVED, NOT ACCEPTED
0
$0
75
$407,077
143
$393,964
18
$165,642
26
$310,254
0
$0
APPLICATIONS DENIED
2
$176,615
197
$664,317
290
$529,879
24
$164,737
80
$620,569
2
$170,790
APPLICATIONS WITHDRAWN
0
$0
77
$661,842
153
$575,717
17
$156,406
11
$889,495
0
$0
FILES CLOSED FOR INCOMPLETENESS
0
$0
16
$1,229,182
61
$417,659
2
$131,005
7
$2,042,944
0
$0
Aggregated Statistics For Year 2005 (Based on 2 full and 2 partial tracts)
A) FHA, FSA/RHS & VA Home Purchase Loans
B) Conventional Home Purchase Loans
C) Refinancings
D) Home Improvement Loans
F) Non-occupant Loans on < 5 Family Dwellings (A B C & D)
Number
Average Value
Number
Average Value
Number
Average Value
Number
Average Value
Number
Average Value
LOANS ORIGINATED
4
$163,998
469
$321,171
654
$324,309
34
$162,103
103
$240,710
APPLICATIONS APPROVED, NOT ACCEPTED
0
$0
79
$336,517
100
$229,154
12
$166,833
10
$477,537
APPLICATIONS DENIED
2
$140,710
134
$378,309
230
$368,359
14
$87,429
36
$431,758
APPLICATIONS WITHDRAWN
0
$0
86
$291,226
108
$369,917
16
$142,794
19
$268,956
FILES CLOSED FOR INCOMPLETENESS
0
$0
41
$212,179
69
$416,225
0
$0
7
$152,834
Aggregated Statistics For Year 2004 (Based on 2 full and 2 partial tracts)
A) FHA, FSA/RHS & VA Home Purchase Loans
B) Conventional Home Purchase Loans
C) Refinancings
D) Home Improvement Loans
F) Non-occupant Loans on < 5 Family Dwellings (A B C & D)
G) Loans On Manufactured Home Dwelling (A B C & D)
Number
Average Value
Number
Average Value
Number
Average Value
Number
Average Value
Number
Average Value
Number
Average Value
LOANS ORIGINATED
5
$156,748
389
$287,236
830
$289,929
50
$110,586
71
$266,288
2
$320,230
APPLICATIONS APPROVED, NOT ACCEPTED
0
$0
76
$289,225
128
$341,660
16
$159,388
14
$398,961
0
$0
APPLICATIONS DENIED
0
$0
111
$316,661
248
$364,709
18
$85,013
24
$281,488
2
$47,550
APPLICATIONS WITHDRAWN
3
$108,237
64
$380,211
147
$321,855
6
$365,018
9
$387,347
0
$0
FILES CLOSED FOR INCOMPLETENESS
0
$0
5
$300,722
59
$335,882
4
$128,577
0
$0
0
$0
Aggregated Statistics For Year 2003 (Based on 2 full and 2 partial tracts)
A) FHA, FSA/RHS & VA Home Purchase Loans
B) Conventional Home Purchase Loans
C) Refinancings
D) Home Improvement Loans
F) Non-occupant Loans on < 5 Family Dwellings (A B C & D)
Number
Average Value
Number
Average Value
Number
Average Value
Number
Average Value
Number
Average Value
LOANS ORIGINATED
10
$135,153
369
$279,662
1,588
$251,707
26
$74,860
69
$219,574
APPLICATIONS APPROVED, NOT ACCEPTED
0
$0
52
$307,649
202
$263,004
2
$41,725
17
$244,655
APPLICATIONS DENIED
0
$0
82
$356,255
329
$418,361
12
$46,741
26
$319,358
APPLICATIONS WITHDRAWN
2
$162,055
35
$276,789
199
$270,710
0
$0
19
$274,572
FILES CLOSED FOR INCOMPLETENESS
4
$146,045
14
$443,057
47
$286,785
2
$19,410
2
$182,435
Aggregated Statistics For Year 1999 (Based on 1 partial tract)
A) FHA, FSA/RHS & VA Home Purchase Loans
B) Conventional Home Purchase Loans
C) Refinancings
D) Home Improvement Loans
F) Non-occupant Loans on < 5 Family Dwellings (A B C & D)
Detailed PMIC statistics for the following Tracts:0102.03
, 0102.07
2002 - 2018 National Fire Incident Reporting System (NFIRS) incidents
According to the data from the years 2002 - 2018 the average number of fires per year is 12. The highest number of fire incidents - 25 took place in 2017, and the least - 0 in 2004. The data has an increasing trend.
When looking into fire subcategories, the most incidents belonged to: Outside Fires (49.8%), and Structure Fires (29.9%).
Fire incident types reported to NFIRS in Zip Code 84004


 Nearest zip codes: 84092, 84003, 84062, 84121, 84093, 84020.


 According to the data from the years 2002 - 2018 the average number of fires per year is 12. The highest number of fire incidents - 25 took place in 2017, and the least - 0 in 2004. The data has an increasing trend.
 When looking into fire subcategories, the most incidents belonged to: Outside Fires (49.8%), and Structure Fires (29.9%).