Estimated zip code population in 2022: 723 Zip code population in 2010: 1,011 Zip code population in 2000: 901
Houses and condos: 220 Renter-occupied apartments: 13
% of renters here:
6%
State:
29%
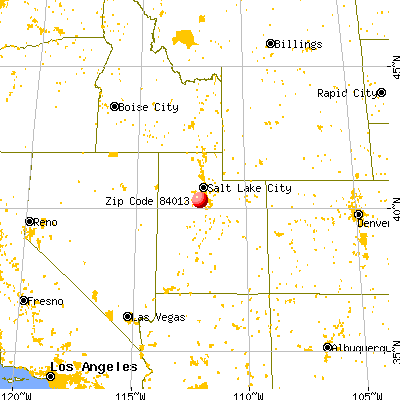
March 2022 cost of living index in zip code 84013: 85.0 (less than average, U.S. average is 100)
Land area: 40.0 sq. mi. Water area: 0.0 sq. mi.
Population density: 18 people per square mile
(very low).
OSM Map
General Map
Google Map
MSN Map
OSM Map
General Map
Google Map
MSN Map
OSM Map
General Map
Google Map
MSN Map
OSM Map
General Map
Google Map
MSN Map
Please wait while loading the map...
Real estate property taxes paid for housing units in 2022:
This zip code:
0.4% ($1,863)
Utah:
0.5% ($2,376)
Median real estate property taxes paid for housing units with mortgages in 2022: $1,829 (0.3%) Median real estate property taxes paid for housing units with no mortgage in 2022: $2,203 (0.4%)
Business Search- 14 Million verified businesses
Males: 407
(56.2%)
Females: 316
(43.8%)
For population 25 years and over in 84013:
High school or higher: 95.6%
Bachelor's degree or higher: 10.1%
Graduate or professional degree: 1.5%
Unemployed: 0.2%
Mean travel time to work (commute): 33.7 minutes
For population 15 years and over in 84013:
Never married: 21.2%
Now married: 68.8%
Separated: 0.0%
Widowed: 2.0%
Divorced: 8.0%
Zip code 84013 compared to state average:
Unemployed percentage significantly below state average.
Black race population percentage significantly below state average.
Hispanic race population percentage significantly below state average.
Foreign-born population percentage significantly below state average.
Renting percentage significantly below state average.
Length of stay since moving in significantly above state average.
Percentage of population with a bachelor's degree or higher significantly below state average.
Averages for the 2020 tax year for zip code 84013, filed in 2021:
Average Adjusted Gross Income (AGI) in 2020: $80,650 (Individual Income Tax Returns)
Here:
$80,650
State:
$81,660
Salary/wage: $60,616 (reported on 86.0% of returns)
Here:
$60,616
State:
$63,027
(% of AGI for various income ranges: 1388.8% for AGIs below $25k, 4184.4% for AGIs $25k-50k, 7890.0% for AGIs $50k-75k, 10382.5% for AGIs $75k-100k, 17152.0% for AGIs $100k-200k)
Taxable interest for individuals: $821 (reported on 28.0% of returns)
This zip code:
$821
Utah:
$2,255
(% of AGI for various income ranges: 20.0% for AGIs below $25k, 13.3% for AGIs $25k-50k, 58.3% for AGIs $50k-75k, 104.0% for AGIs $100k-200k)
Ordinary dividends: $2,900 (reported on 10.0% of returns)
Here:
$2,900
State:
$7,362
(% of AGI for various income ranges: 95.6% for AGIs $25k-50k, 147.5% for AGIs $75k-100k)
Net capital gain/loss in AGI: +$86,614 (reported on 14.0% of returns)
Here:
+$86,614
State:
+$43,433
(% of AGI for various income ranges: 55.0% for AGIs $50k-75k, 12060.0% for AGIs $100k-200k)
Profit/loss from business: +$2,857 (reported on 14.0% of returns)
Here:
+$2,857
State:
+$9,957
(% of AGI for various income ranges: 95.0% for AGIs below $25k, 5.0% for AGIs $50k-75k, 242.0% for AGIs $100k-200k)
Total itemized deductions: $44,800 (reported on 10.0% of returns)
Here:
$44,800
State:
$41,056
(% of AGI for various income ranges: 530.0% for AGIs $25k-50k, 3526.0% for AGIs $100k-200k)
Charity contributions: $28,025 (reported on 8.0% of returns)
Here:
$28,025
State:
$22,261
(% of AGI for various income ranges: 2242.0% for AGIs $100k-200k)
Taxes paid: $7,880 (reported on 10.0% of returns)
84013:
$7,880
State:
$7,985
(% of AGI for various income ranges: 127.8% for AGIs $25k-50k, 558.0% for AGIs $100k-200k)
Earned income credit: $1,525 (reported on 8.0% of returns)
Here:
$1,525
State:
$2,169
(% of AGI for various income ranges: 76.2% for AGIs below $25k)
Percentage of individuals using paid preparers for their 2020 taxes: 92.0%
Here:
92%
State:
94%
(% for various income ranges: 91.7% for AGIs below $25k, 91.7% for AGIs $25k-50k, 100.0% for AGIs $50k-75k, 100.0% for AGIs $75k-100k, 87.5% for AGIs $100k-200k, 66.7% for AGIs over 200k)
Averages for the 2012 tax year for zip code 84013, filed in 2013:
Average Adjusted Gross Income (AGI) in 2012: $52,140 (Individual Income Tax Returns)
Here:
$52,140
State:
$60,327
Salary/wage: $50,771 (reported on 85.0% of returns)
Here:
$50,771
State:
$48,762
(% of AGI for various income ranges: 84.4% for AGIs below $25k, 86.2% for AGIs $25k-50k, 88.1% for AGIs $50k-75k, 91.5% for AGIs $75k-100k, 72.0% for AGIs $100k-200k)
Taxable interest for individuals: $409 (reported on 27.5% of returns)
This zip code:
$409
Utah:
$1,534
(% of AGI for various income ranges: 0.8% for AGIs below $25k, 0.3% for AGIs $25k-50k, 0.1% for AGIs $50k-75k, 0.2% for AGIs $75k-100k, 0.2% for AGIs $100k-200k)
Ordinary dividends: $950 (reported on 5.0% of returns)
Here:
$950
State:
$5,711
Net capital gain/loss in AGI: +$1,367 (reported on 7.5% of returns)
Here:
+$1,367
State:
+$23,734
Total itemized deductions: $20,100 (24% of AGI, reported on 40.0% of returns)
Here:
$20,100
State:
$25,197
Here:
24.0% of AGI
State:
22.4% of AGI
(% of AGI for various income ranges: 32.5% for AGIs below $25k, 19.1% for AGIs $50k-75k, 19.4% for AGIs $75k-100k, 14.8% for AGIs $100k-200k)
Charity contributions: $5,321 (reported on 35.0% of returns)
Here:
$5,321
State:
$8,502
(% of AGI for various income ranges: 5.7% for AGIs below $25k, 4.1% for AGIs $50k-75k, 5.0% for AGIs $75k-100k, 3.8% for AGIs $100k-200k)
Taxes paid: $5,181 (reported on 40.0% of returns)
84013:
$5,181
State:
$7,001
(% of AGI for various income ranges: 5.5% for AGIs below $25k, 4.1% for AGIs $50k-75k, 5.7% for AGIs $75k-100k, 4.7% for AGIs $100k-200k)
Earned income credit: $2,560 (reported on 12.5% of returns)
Here:
$2,560
State:
$2,259
(% of AGI for various income ranges: 4.5% for AGIs below $25k, 1.6% for AGIs $25k-50k)
Percentage of individuals using paid preparers for their 2012 taxes: 55.0%
Here:
55%
State:
51%
(% for various income ranges: 50.0% for AGIs below $25k, 50.0% for AGIs $25k-50k, 62.5% for AGIs $50k-75k, 60.0% for AGIs $75k-100k, 60.0% for AGIs $100k-200k)
Averages for the 2004 tax year for zip code 84013, filed in 2005:
Average Adjusted Gross Income (AGI) in 2004: $41,790 (Individual Income Tax Returns)
Here:
$41,790
State:
$45,498
Salary/wage: $40,974 (reported on 88.3% of returns)
Here:
$40,974
State:
$38,975
(% of AGI for various income ranges: 99.5% for AGIs below $10k, 71.6% for AGIs $10k-25k, 83.3% for AGIs $25k-50k, 90.7% for AGIs $50k-75k, 95.8% for AGIs $75k-100k, 80.2% for AGIs over 100k)
Taxable interest for individuals: $265 (reported on 39.7% of returns)
This zip code:
$265
Utah:
$1,445
(% of AGI for various income ranges: 0.8% for AGIs $10k-25k, 0.3% for AGIs $25k-50k, 0.3% for AGIs $50k-75k, 0.1% for AGIs $75k-100k)
Taxable dividends: $458 (reported on 7.0% of returns)
Here:
$458
State:
$3,152
Profit/loss from business: +$576 (reported on 17.2% of returns)
Here:
+$576
State:
+$6,903
Total itemized deductions: $18,236 (29% of AGI, reported on 51.9% of returns)
Here:
$18,236
State:
$20,312
Here:
29.5% of AGI
State:
24.9% of AGI
(% of AGI for various income ranges: 12.9% for AGIs $10k-25k, 25.2% for AGIs $25k-50k, 26.5% for AGIs $50k-75k, 19.8% for AGIs $75k-100k, 21.9% for AGIs over 100k)
Charity contributions deductions: $4,348 (7% of AGI, reported on 47.8% of returns)
Here:
$4,348
State:
$6,250
Here:
7.0% of AGI
State:
7.4% of AGI
(% of AGI for various income ranges: 2.5% for AGIs $10k-25k, 4.7% for AGIs $25k-50k, 5.7% for AGIs $50k-75k, 4.5% for AGIs $75k-100k, 6.3% for AGIs over 100k)
Total tax: $3,116 (reported on 73.2% of returns)
84013:
$3,116
State:
$6,523
(% of AGI for various income ranges: 2.7% for AGIs below $10k, 4.1% for AGIs $10k-25k, 3.6% for AGIs $25k-50k, 4.4% for AGIs $50k-75k, 7.7% for AGIs $75k-100k, 8.9% for AGIs over 100k)
Earned income credit: $1,512 (reported on 12.0% of returns)
Here:
$1,512
State:
$1,703
Percentage of individuals using paid preparers for their 2004 taxes: 55.7%
Here:
56%
State:
53%
(% for various income ranges: 39.6% for AGIs below $10k, 57.9% for AGIs $10k-25k, 58.1% for AGIs $25k-50k, 61.0% for AGIs $50k-75k, 86.2% for AGIs $75k-100k)
Household received Food Stamps/SNAP in the past 12 months: 0 Household did not receive Food Stamps/SNAP in the past 12 months: 212
Women who had a birth in the past 12 months: 18 (19 now married, 0 unmarried) Women who did not have a birth in the past 12 months: 138 (92 now married, 44 unmarried)
Housing units in zip code 84013 with a mortgage: 157 (36 second mortgage, 29 both second mortgage and home equity loan) Houses without a mortgage: 1
Median monthly owner costs for units with a mortgage: $1,580 Median monthly owner costs for units without a mortgage: $513
Residents with income below the poverty level in 2022:
This zip code:
0.3%
Whole state:
8.2%
Median number of rooms in houses and condos:
Here:
7.4
State:
7.6
Median number of rooms in apartments:
Here:
4.7
State:
4.3
Notable locations in this zip code not listed on our city pages
Notable locations in zip code 84013: Stage Coach Inn State Historical Site (A), Camp Floyd State Historical Site (B), Cedar Fort Fire Department (C). Display/hide their locations on the map
Size of family households: 72 2-persons, 40 3-persons, 17 4-persons, 16 5-persons, 12 6-persons, 25 7-or-more-persons
Size of nonfamily households: 23 1-person, 4 2-persons
211 married couples with children.
2 single-parent households (2 women).
98.8% of residents of 84013 zip code speak English at home.
0.6% of residents speak Spanish at home (100% very well).
Foreign born population: 5 (0.7%) (100.0% of them are naturalized citizens)
This zip code:
0.7%
Whole state:
8.6%
80%United Kingdom, excluding England and Scotland
60%Sweden
66%English
4%German
3%Danish
3%American
3%Irish
2%Greek
2%Swedish
Year of entry for the foreign-born population
02010 or later
02000 to 2009
01990 to 1999
4Before 1990
Facilities with environmental interests located in this zip code:
FAIRFIELD IRRIGATION CO (17906 W 1610 N in FAIRFIELD, UT)
STATE MASTER (Utah compliance and permitting operations) - DMAC-5, DRINKING WATER SYSTEM ENFORCEMENT/COMPLIANCE ACTIVITY (Integrated Compliance Information System) - ICIS-08-1996-0073, FORMAL ENFORCEMENT ACTION (Integrated Compliance Information System) - ICIS-08-1996-0073, FORMAL ENFORCEMENT ACTION COMMUNITY WATER SYSTEM (SDWIS) Business SIC classification: WATER SUPPLY
CEDAR FORT MUNICIPAL CENTER (PO BOX 389 in CEDAR FORT, UT)
(Integrated Compliance Information System) - ICIS-08-2005-0037, ENFORCEMENT/COMPLIANCE ACTIVITY FORMAL ENFORCEMENT ACTION (Integrated Compliance Information System) - ICIS-08-2005-0037, ENFORCEMENT/COMPLIANCE ACTIVITY Business SIC classification: WATER SUPPLY
CEDAR VALLEY ELEM SCH (40 E CENTER in CEDAR FORT, UT)
(National Center for Education Statistics) - STATE ID-01 112 Organizations: ALPINE SCHOOL DISTRICT (SCHOOL DISTRICT)
DYNO NOBEL SITE A (IRECO) (PELICAN POINT SITE A in FAIRFIELD, UT)
Large Quantity Generators, more that 1000 kg of hazardous waste/month (Resource Conservation and Recovery Act (tracking hazardous waste)) TRANSPORTER (Resource Conservation and Recovery Act (tracking hazardous waste)) TSD (Resource Conservation and Recovery Act (tracking hazardous waste))
Housing units lacking complete plumbing facilities: 0.4%
67.8%Utility gas
13.7%Bottled, tank, or LP gas
13.2%Electricity
4.0%Wood
2.5%Coal or coke
Population in 1990: 1,836.
Place of birth for U.S.-born residents:
This state: 582
Northeast: 3
Midwest: 37
South: 10
West: 80
32% of the 84013 zip code residents lived in the same house 5 years ago. Out of people who lived in different houses, 57% lived in this county. Out of people who lived in different counties, 50% lived in Utah.
93% of the 84013 zip code residents lived in the same house 1 year ago. Out of people who lived in different houses, 80% moved from this county. Out of people who lived in different houses, 20% moved from different county within same state.
Private vs. public school enrollment:
Students in private schools in grades 1 to 8 (elementary and middle school):
Here:
0.0%
Utah:
7.2%
Students in private schools in grades 9 to 12 (high school):
Here:
0.0%
Utah:
5.3%
Students in private undergraduate colleges: 1
Here:
3.6%
Utah:
26.7%
Occupation by median earnings in the past 12 months ($)
78,456Installation, maintenance, and repair occupations
67,254Architecture and engineering occupations
54,016Sales and related occupations
41,954Management occupations
41,885Construction and extraction occupations
38,410Transportation occupations
Top industries in this zip code by the number of employees in 2005:
Arts, Entertainment, and Recreation: All Other Amusement and Recreation Industries (50-99 employees: 1 establishment)
Construction: Water and Sewer Line and Related Structures Construction (10-19: 1)
Construction: New Single-Family Housing Construction (except Operative Builders) (1-4: 1)
Utilities: Water Supply and Irrigation Systems (1-4: 1)
Construction: Framing Contractors (1-4: 1)
Construction: Plumbing, Heating, and Air-Conditioning Contractors (1-4: 1)
Fatal accident statistics in 2012:
Fatal accident count: 1
Vehicles involved in fatal accidents: 1
Fatal accidents caused by drunken drivers: 0
Fatalities: 1
Persons involved in fatal accidents: 2
Pedestrians involved in fatal accidents: 0
Fatal accident statistics in 2010:
Fatal accident count: 1
Vehicles involved in fatal accidents: 2
Fatal accidents caused by drunken drivers: 0
Fatalities: 1
Persons involved in fatal accidents: 3
Pedestrians involved in fatal accidents: 0
Home Mortgage Disclosure Act Aggregated Statistics For Year 2009 (Based on 2 partial tracts)
A) FHA, FSA/RHS & VA Home Purchase Loans
B) Conventional Home Purchase Loans
C) Refinancings
D) Home Improvement Loans
E) Loans on Dwellings For 5+ Families
F) Non-occupant Loans on < 5 Family Dwellings (A B C & D)
G) Loans On Manufactured Home Dwelling (A B C & D)
Number
Average Value
Number
Average Value
Number
Average Value
Number
Average Value
Number
Average Value
Number
Average Value
Number
Average Value
LOANS ORIGINATED
412
$182,486
66
$166,132
586
$193,269
5
$103,544
1
$70,870
16
$169,668
1
$84,300
APPLICATIONS APPROVED, NOT ACCEPTED
26
$202,654
10
$211,566
82
$210,954
3
$295,167
0
$0
3
$217,333
0
$0
APPLICATIONS DENIED
54
$200,356
16
$212,890
228
$216,814
10
$128,387
0
$0
11
$212,745
1
$2,240
APPLICATIONS WITHDRAWN
35
$183,644
15
$199,381
144
$200,508
4
$128,498
0
$0
7
$174,884
0
$0
FILES CLOSED FOR INCOMPLETENESS
13
$184,032
2
$227,905
30
$208,159
1
$18,650
0
$0
0
$0
0
$0
Aggregated Statistics For Year 2008 (Based on 2 partial tracts)
A) FHA, FSA/RHS & VA Home Purchase Loans
B) Conventional Home Purchase Loans
C) Refinancings
D) Home Improvement Loans
F) Non-occupant Loans on < 5 Family Dwellings (A B C & D)
G) Loans On Manufactured Home Dwelling (A B C & D)
Number
Average Value
Number
Average Value
Number
Average Value
Number
Average Value
Number
Average Value
Number
Average Value
LOANS ORIGINATED
254
$196,568
180
$199,360
456
$205,574
24
$79,791
32
$199,975
1
$150,690
APPLICATIONS APPROVED, NOT ACCEPTED
19
$205,503
34
$241,967
118
$202,609
9
$120,934
4
$261,845
0
$0
APPLICATIONS DENIED
46
$205,588
56
$229,661
315
$222,348
37
$118,130
40
$202,875
1
$183,520
APPLICATIONS WITHDRAWN
29
$206,410
34
$232,116
98
$202,509
7
$170,407
11
$217,086
1
$105,190
FILES CLOSED FOR INCOMPLETENESS
4
$219,325
5
$316,602
24
$220,443
3
$58,437
2
$151,810
0
$0
Aggregated Statistics For Year 2007 (Based on 2 partial tracts)
A) FHA, FSA/RHS & VA Home Purchase Loans
B) Conventional Home Purchase Loans
C) Refinancings
D) Home Improvement Loans
F) Non-occupant Loans on < 5 Family Dwellings (A B C & D)
G) Loans On Manufactured Home Dwelling (A B C & D)
Number
Average Value
Number
Average Value
Number
Average Value
Number
Average Value
Number
Average Value
Number
Average Value
LOANS ORIGINATED
102
$188,906
729
$170,752
585
$188,049
78
$102,432
155
$186,038
0
$0
APPLICATIONS APPROVED, NOT ACCEPTED
4
$233,685
126
$183,771
117
$197,295
15
$133,235
34
$181,914
0
$0
APPLICATIONS DENIED
16
$205,290
210
$209,828
316
$209,324
63
$122,972
77
$204,743
1
$41,030
APPLICATIONS WITHDRAWN
4
$243,570
102
$189,257
133
$205,049
11
$138,756
33
$188,422
0
$0
FILES CLOSED FOR INCOMPLETENESS
1
$182,770
22
$192,129
34
$227,135
2
$22,755
8
$249,910
0
$0
Aggregated Statistics For Year 2006 (Based on 2 partial tracts)
A) FHA, FSA/RHS & VA Home Purchase Loans
B) Conventional Home Purchase Loans
C) Refinancings
D) Home Improvement Loans
F) Non-occupant Loans on < 5 Family Dwellings (A B C & D)
G) Loans On Manufactured Home Dwelling (A B C & D)
Number
Average Value
Number
Average Value
Number
Average Value
Number
Average Value
Number
Average Value
Number
Average Value
LOANS ORIGINATED
96
$157,235
1,085
$132,191
538
$150,419
54
$58,975
241
$133,172
1
$108,920
APPLICATIONS APPROVED, NOT ACCEPTED
5
$122,792
117
$146,809
89
$145,621
13
$104,325
28
$150,319
1
$117,870
APPLICATIONS DENIED
10
$153,527
248
$141,349
259
$174,892
51
$73,284
67
$145,893
1
$145,470
APPLICATIONS WITHDRAWN
4
$187,432
101
$135,417
101
$147,959
16
$72,036
41
$143,541
0
$0
FILES CLOSED FOR INCOMPLETENESS
0
$0
26
$148,655
33
$195,791
1
$98,470
7
$164,653
0
$0
Aggregated Statistics For Year 2005 (Based on 2 partial tracts)
A) FHA, FSA/RHS & VA Home Purchase Loans
B) Conventional Home Purchase Loans
C) Refinancings
D) Home Improvement Loans
F) Non-occupant Loans on < 5 Family Dwellings (A B C & D)
G) Loans On Manufactured Home Dwelling (A B C & D)
Number
Average Value
Number
Average Value
Number
Average Value
Number
Average Value
Number
Average Value
Number
Average Value
LOANS ORIGINATED
98
$137,515
759
$111,168
389
$137,053
21
$34,458
116
$107,000
1
$198,440
APPLICATIONS APPROVED, NOT ACCEPTED
7
$155,487
110
$116,139
84
$125,426
4
$16,598
13
$138,355
0
$0
APPLICATIONS DENIED
12
$153,738
189
$117,919
219
$142,626
38
$64,234
25
$126,074
4
$58,375
APPLICATIONS WITHDRAWN
12
$153,925
106
$111,358
102
$144,980
20
$154,086
17
$103,957
0
$0
FILES CLOSED FOR INCOMPLETENESS
4
$122,718
26
$127,193
57
$167,902
4
$38,420
3
$80,320
0
$0
Aggregated Statistics For Year 2004 (Based on 2 partial tracts)
A) FHA, FSA/RHS & VA Home Purchase Loans
B) Conventional Home Purchase Loans
C) Refinancings
D) Home Improvement Loans
F) Non-occupant Loans on < 5 Family Dwellings (A B C & D)
G) Loans On Manufactured Home Dwelling (A B C & D)
Number
Average Value
Number
Average Value
Number
Average Value
Number
Average Value
Number
Average Value
Number
Average Value
LOANS ORIGINATED
151
$136,059
343
$111,415
333
$149,164
12
$96,482
39
$117,065
1
$44,010
APPLICATIONS APPROVED, NOT ACCEPTED
3
$123,837
66
$144,814
80
$147,326
3
$19,397
7
$121,279
1
$78,330
APPLICATIONS DENIED
12
$134,591
106
$133,625
193
$149,691
33
$38,046
10
$188,216
2
$66,765
APPLICATIONS WITHDRAWN
10
$149,200
54
$117,785
93
$148,470
10
$41,478
9
$119,940
0
$0
FILES CLOSED FOR INCOMPLETENESS
1
$105,930
10
$140,546
35
$148,475
1
$14,920
1
$143,230
0
$0
Aggregated Statistics For Year 2003 (Based on 2 partial tracts)
A) FHA, FSA/RHS & VA Home Purchase Loans
B) Conventional Home Purchase Loans
C) Refinancings
D) Home Improvement Loans
F) Non-occupant Loans on < 5 Family Dwellings (A B C & D)
Number
Average Value
Number
Average Value
Number
Average Value
Number
Average Value
Number
Average Value
LOANS ORIGINATED
193
$131,087
232
$116,315
667
$146,947
7
$39,006
34
$118,460
APPLICATIONS APPROVED, NOT ACCEPTED
5
$128,610
40
$127,137
101
$161,225
3
$61,670
11
$180,667
APPLICATIONS DENIED
19
$122,305
69
$131,837
201
$158,345
13
$19,912
21
$212,397
APPLICATIONS WITHDRAWN
10
$133,385
21
$134,102
142
$152,095
1
$14,920
3
$117,867
FILES CLOSED FOR INCOMPLETENESS
7
$112,113
9
$90,349
26
$136,231
1
$16,410
3
$87,033
Aggregated Statistics For Year 1999 (Based on 1 partial tract)
A) FHA, FSA/RHS & VA Home Purchase Loans
B) Conventional Home Purchase Loans
C) Refinancings
D) Home Improvement Loans
F) Non-occupant Loans on < 5 Family Dwellings (A B C & D)
Detailed PMIC statistics for the following Tracts:0101.02
2002 - 2018 National Fire Incident Reporting System (NFIRS) incidents
According to the data from the years 2002 - 2018 the average number of fires per year is 12. The highest number of fire incidents - 34 took place in 2004, and the least - 3 in 2007. The data has a decreasing trend.
When looking into fire subcategories, the most incidents belonged to: Outside Fires (61.3%), and Structure Fires (18.1%).
Fire incident types reported to NFIRS in Zip Code 84013


 Nearest zip codes: 84005, 84045, 84096, 84071, 84043, 84065.


 According to the data from the years 2002 - 2018 the average number of fires per year is 12. The highest number of fire incidents - 34 took place in 2004, and the least - 3 in 2007. The data has a decreasing trend.
 When looking into fire subcategories, the most incidents belonged to: Outside Fires (61.3%), and Structure Fires (18.1%).