Estimated zip code population in 2022: 108
Zip code population in 2010: 40
Zip code population in 2000: 43
March 2022 cost of living index in zip code 84304: 82.2
(low, U.S. average is 100)
Land area: 12.4
sq. mi.
Water area: 0.5
sq. mi.
| Population density: 9 people per square mile | | (very low). |
![Age and Sex of Residents in zip code 84304]()
- OSM Map
- General Map
- Google Map
- MSN Map
- OSM Map
- General Map
- Google Map
- MSN Map
- OSM Map
- General Map
- Google Map
- MSN Map
- OSM Map
- General Map
- Google Map
- MSN Map
Please wait while loading the map...
Real estate property taxes paid for housing units in 2022:
| This zip code: | 0.4% ($2,176) |
| Utah: | 0.5% ($2,376) |
Business Search - 14 Million verified businesses
| Males: 31 |  (29.6%) (29.6%) |
| Females: 76 |  (70.4%) (70.4%) |
For population 25 years and over in 84304:
- High school or higher: 96.5%
- Bachelor's degree or higher: 32.0%
- Graduate or professional degree: 0.0%
For population 15 years and over in 84304:
- Never married: 23.5%
- Now married: 48.2%
- Separated: 0.0%
- Widowed: 28.3%
- Divorced: 0.0%
Zip code 84304 compared to state average:
- Median household income significantly below state average.
- Median house value significantly below state average.
- Unemployed percentage significantly below state average.
- Black race population percentage significantly below state average.
- Hispanic race population percentage significantly below state average.
- Median age significantly below state average.
- Foreign-born population percentage significantly below state average.
- Renting percentage significantly below state average.
- Length of stay since moving in significantly above state average.
- Number of rooms per house significantly below state average.
- House age above state average.
- Percentage of population with a bachelor's degree or higher below state average.
Data:
100%
rural population.
Median resident age:| This zip code: | 18.9 years |
| Utah median age: | 32.1 years |
Average household size:| This zip code: | 3.3 people |
| Utah: | 3.0 people |
Averages for the 2004 tax year for zip code 84304, filed in 2005:
Average Adjusted Gross Income (AGI) in 2004: $19,200 (Individual Income Tax Returns)
| Here: | $19,200 |
| State: | $45,498 |
Salary/wage: $24,636 (reported on 73.3% of returns)
| Here: | $24,636 |
| State: | $38,975 |
Percentage of individuals using paid preparers for their 2004 taxes: 73.3%
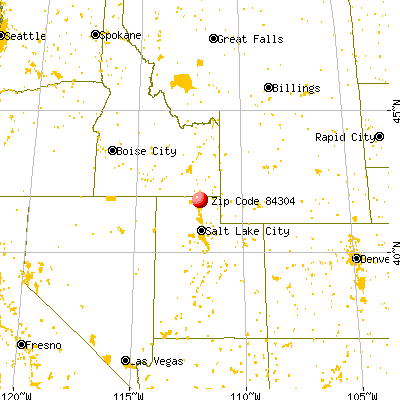
![Peter, UT (84304) map]() Nearest zip codes: 84327
Nearest zip codes: 84327,
84306,
84325,
84338,
84311,
84335.
Peter Zip Code Map
Percentage of family households:| This zip code: | 98.4% |
| Utah: | 56.6% |
Percentage of households with unmarried partners:| This zip code: | 0.0% |
| Utah: | 59.5% |
No gay or lesbian households reported
Household received Food Stamps/SNAP in the past 12 months: 0
Household did not receive Food Stamps/SNAP in the past 12 months: 33
Women who did not have a birth in the past 12 months: 46 (14 now married, 32 unmarried)
Housing units in zip code 84304 with a mortgage: 14

- Year house built (houses)
- 02020 or later
- 02010 to 2019
- 02000 to 2009
- 161990 to 1999
- 01980 to 1989
- 01970 to 1979
- 01960 to 1969
- 01950 to 1959
- 01940 to 1949
- 141939 or earlier
![Zip code 84304 satellite photo by USGS]()
- Bedrooms in owner-occupied houses and condos in Peter, UT (84304)
- 0no bedroom
- 01 bedroom
- 02 bedrooms
- 03 bedrooms
- 184 bedrooms
- 155+ bedrooms
- Cars and other vehicles available in Peter, UT (84304) in owner-occupied houses/condos
- 0no vehicle
- 01 vehicle
- 332 vehicles
- 03 vehicles
- 04 vehicles
- 05+ vehicles
Zip code 84304 household income distribution in 2022
![Zip code 84304 household income distribution in 2022]()
- 17$20,000 to $24,999
- 14$50,000 to $59,999
Estimate of home value of owner-occupied houses/condos in 2022 in zip code 84304
![Estimate of home value of owner-occupied houses/condos in 2022 in zip code 84304]()
- 7$250,000 to $299,999
- 13$300,000 to $399,999
Estimated median house (or condo) value in 2022 for:
- White Non-Hispanic householders: $631,100
Mean price in 2022:
Detached houses: $557,056| Here: | $557,056 |
| State: | $607,750 |
Housing units in structures:
Travel time to work (commute) in zip code 84304
![Travel time to work (commute) in zip code 84304]()
- 1515 to 19 minutes
- 3120 to 24 minutes
Percentage of zip code residents living and working in this county: 102.1%
Household type by relationship:
Households: 108
- Male householders: 0 (0 living alone), Female householders: 33 (0 living alone)
16 spouses (16 opposite-sex spouses), 0 unmarried partners, (0 opposite-sex unmarried partners), 58 children (58 natural, 0 adopted, 0 stepchildren), 0 grandchildren, 0 brothers or sisters, 0 parents, 0 foster children, 0 other relatives, 0 non-relatives
Size of family households: 18 2-persons, 14 5-persons
44 married couples with children.
0 single-parent households ().
98.7% of residents of 84304 zip code speak English at home.
Foreign born population: 0 (0.0%)
![Zip code 84304 topographic map]()

- 56.5%Fuel oil, kerosene, etc.
- 46.5%Bottled, tank, or LP gas
Place of birth for U.S.-born residents:
100% of the 84304 zip code residents lived in the same house 5 years ago.
102% of the 84304 zip code residents lived in the same house 1 year ago.
Private vs. public school enrollment:
Students in private schools in grades 1 to 8 (elementary and middle school):
Students in private undergraduate colleges:
Top industries in this zip code by the number of employees in 2005:
- Wholesale Trade: Grain and Field Bean Merchant Wholesalers (1-4 employees: 1 establishment)
Fatal accident statistics in 2014:
- Fatal accident count: 1
- Vehicles involved in fatal accidents: 1
- Fatal accidents caused by drunken drivers: 0
- Fatalities: 1
- Persons involved in fatal accidents: 1
- Pedestrians involved in fatal accidents: 0
Home Mortgage Disclosure Act Aggregated Statistics For Year 2009
(Based on 2 partial tracts)
|
| A) FHA, FSA/RHS & VA
Home Purchase Loans | B) Conventional
Home Purchase Loans | C) Refinancings
| D) Home Improvement Loans
| F) Non-occupant Loans on
< 5 Family Dwellings (A B C & D) | G) Loans On Manufactured
Home Dwelling (A B C & D) |
|---|
| Number | Average Value | Number | Average Value | Number | Average Value | Number | Average Value | Number | Average Value | Number | Average Value |
|---|
| LOANS ORIGINATED | 8 | $133,228 | 4 | $141,922 | 34 | $163,187 | 1 | $64,680 | 0 | $0 | 2 | $95,090 |
| APPLICATIONS APPROVED, NOT ACCEPTED | 0 | $0 | 1 | $75,660 | 3 | $176,823 | 1 | $117,970 | 0 | $0 | 0 | $0 |
| APPLICATIONS DENIED | 2 | $180,925 | 1 | $147,060 | 12 | $176,382 | 1 | $35,390 | 1 | $81,160 | 1 | $121,020 |
| APPLICATIONS WITHDRAWN | 1 | $192,210 | 0 | $0 | 8 | $166,432 | 0 | $0 | 0 | $0 | 0 | $0 |
| FILES CLOSED FOR INCOMPLETENESS | 0 | $0 | 0 | $0 | 0 | $0 | 0 | $0 | 0 | $0 | 0 | $0 |
Aggregated Statistics For Year 2008
(Based on 2 partial tracts)
|
| A) FHA, FSA/RHS & VA
Home Purchase Loans | B) Conventional
Home Purchase Loans | C) Refinancings
| D) Home Improvement Loans
| F) Non-occupant Loans on
< 5 Family Dwellings (A B C & D) | G) Loans On Manufactured
Home Dwelling (A B C & D) |
|---|
| Number | Average Value | Number | Average Value | Number | Average Value | Number | Average Value | Number | Average Value | Number | Average Value |
|---|
| LOANS ORIGINATED | 8 | $183,060 | 9 | $146,561 | 25 | $167,520 | 1 | $111,260 | 2 | $87,665 | 1 | $132,010 |
| APPLICATIONS APPROVED, NOT ACCEPTED | 0 | $0 | 1 | $175,740 | 4 | $150,618 | 0 | $0 | 0 | $0 | 0 | $0 |
| APPLICATIONS DENIED | 2 | $151,025 | 3 | $157,840 | 12 | $184,992 | 1 | $56,550 | 1 | $91,940 | 2 | $73,530 |
| APPLICATIONS WITHDRAWN | 2 | $178,380 | 1 | $150,520 | 4 | $182,195 | 0 | $0 | 0 | $0 | 0 | $0 |
| FILES CLOSED FOR INCOMPLETENESS | 0 | $0 | 0 | $0 | 1 | $136,480 | 0 | $0 | 0 | $0 | 0 | $0 |
Aggregated Statistics For Year 2007
(Based on 2 partial tracts)
|
| A) FHA, FSA/RHS & VA
Home Purchase Loans | B) Conventional
Home Purchase Loans | C) Refinancings
| D) Home Improvement Loans
| F) Non-occupant Loans on
< 5 Family Dwellings (A B C & D) | G) Loans On Manufactured
Home Dwelling (A B C & D) |
|---|
| Number | Average Value | Number | Average Value | Number | Average Value | Number | Average Value | Number | Average Value | Number | Average Value |
|---|
| LOANS ORIGINATED | 5 | $151,736 | 26 | $117,683 | 22 | $147,844 | 2 | $43,730 | 3 | $155,467 | 3 | $93,497 |
| APPLICATIONS APPROVED, NOT ACCEPTED | 0 | $0 | 3 | $152,280 | 6 | $156,923 | 0 | $0 | 1 | $99,670 | 0 | $0 |
| APPLICATIONS DENIED | 1 | $113,900 | 3 | $118,853 | 12 | $159,702 | 2 | $122,750 | 0 | $0 | 2 | $73,935 |
| APPLICATIONS WITHDRAWN | 0 | $0 | 2 | $118,275 | 3 | $143,397 | 0 | $0 | 1 | $123,060 | 0 | $0 |
| FILES CLOSED FOR INCOMPLETENESS | 0 | $0 | 1 | $99,670 | 2 | $179,805 | 1 | $35,590 | 0 | $0 | 0 | $0 |
Aggregated Statistics For Year 2006
(Based on 2 partial tracts)
|
| A) FHA, FSA/RHS & VA
Home Purchase Loans | B) Conventional
Home Purchase Loans | C) Refinancings
| D) Home Improvement Loans
| F) Non-occupant Loans on
< 5 Family Dwellings (A B C & D) | G) Loans On Manufactured
Home Dwelling (A B C & D) |
|---|
| Number | Average Value | Number | Average Value | Number | Average Value | Number | Average Value | Number | Average Value | Number | Average Value |
|---|
| LOANS ORIGINATED | 9 | $138,086 | 23 | $117,247 | 21 | $130,331 | 2 | $87,260 | 3 | $86,037 | 1 | $132,410 |
| APPLICATIONS APPROVED, NOT ACCEPTED | 0 | $0 | 3 | $132,073 | 4 | $132,718 | 0 | $0 | 0 | $0 | 0 | $0 |
| APPLICATIONS DENIED | 1 | $83,190 | 5 | $145,512 | 9 | $134,424 | 1 | $43,930 | 1 | $92,950 | 1 | $82,780 |
| APPLICATIONS WITHDRAWN | 1 | $67,530 | 3 | $109,633 | 7 | $130,060 | 0 | $0 | 1 | $79,120 | 0 | $0 |
| FILES CLOSED FOR INCOMPLETENESS | 0 | $0 | 1 | $94,170 | 2 | $160,990 | 0 | $0 | 0 | $0 | 0 | $0 |
Aggregated Statistics For Year 2005
(Based on 2 partial tracts)
|
| A) FHA, FSA/RHS & VA
Home Purchase Loans | B) Conventional
Home Purchase Loans | C) Refinancings
| D) Home Improvement Loans
| F) Non-occupant Loans on
< 5 Family Dwellings (A B C & D) | G) Loans On Manufactured
Home Dwelling (A B C & D) |
|---|
| Number | Average Value | Number | Average Value | Number | Average Value | Number | Average Value | Number | Average Value | Number | Average Value |
|---|
| LOANS ORIGINATED | 5 | $114,352 | 24 | $97,683 | 18 | $101,226 | 2 | $57,460 | 4 | $111,565 | 2 | $77,495 |
| APPLICATIONS APPROVED, NOT ACCEPTED | 0 | $0 | 3 | $87,057 | 4 | $93,310 | 0 | $0 | 0 | $0 | 1 | $33,360 |
| APPLICATIONS DENIED | 0 | $0 | 5 | $75,828 | 12 | $100,920 | 2 | $15,965 | 1 | $43,120 | 0 | $0 |
| APPLICATIONS WITHDRAWN | 1 | $128,140 | 4 | $120,260 | 5 | $132,902 | 1 | $48,210 | 1 | $51,460 | 1 | $135,870 |
| FILES CLOSED FOR INCOMPLETENESS | 0 | $0 | 0 | $0 | 2 | $137,090 | 0 | $0 | 0 | $0 | 0 | $0 |
Aggregated Statistics For Year 2004
(Based on 2 partial tracts)
|
| A) FHA, FSA/RHS & VA
Home Purchase Loans | B) Conventional
Home Purchase Loans | C) Refinancings
| D) Home Improvement Loans
| F) Non-occupant Loans on
< 5 Family Dwellings (A B C & D) | G) Loans On Manufactured
Home Dwelling (A B C & D) |
|---|
| Number | Average Value | Number | Average Value | Number | Average Value | Number | Average Value | Number | Average Value | Number | Average Value |
|---|
| LOANS ORIGINATED | 4 | $119,295 | 11 | $108,578 | 24 | $115,887 | 2 | $74,445 | 2 | $117,870 | 1 | $126,920 |
| APPLICATIONS APPROVED, NOT ACCEPTED | 0 | $0 | 3 | $90,920 | 5 | $111,586 | 0 | $0 | 0 | $0 | 0 | $0 |
| APPLICATIONS DENIED | 0 | $0 | 4 | $101,650 | 14 | $116,084 | 1 | $40,880 | 0 | $0 | 1 | $89,290 |
| APPLICATIONS WITHDRAWN | 1 | $90,310 | 2 | $83,905 | 9 | $109,271 | 1 | $52,880 | 0 | $0 | 1 | $128,550 |
| FILES CLOSED FOR INCOMPLETENESS | 0 | $0 | 0 | $0 | 3 | $113,293 | 0 | $0 | 0 | $0 | 0 | $0 |
Private Mortgage Insurance Companies Aggregated Statistics For Year 2009
(Based on 2 partial tracts)
|
| A) Conventional
Home Purchase Loans | B) Refinancings
|
|---|
| Number | Average Value | Number | Average Value |
|---|
| LOANS ORIGINATED | 1 | $94,990 | 3 | $147,330 |
| APPLICATIONS APPROVED, NOT ACCEPTED | 1 | $137,500 | 1 | $240,010 |
| APPLICATIONS DENIED | 0 | $0 | 1 | $153,360 |
| APPLICATIONS WITHDRAWN | 0 | $0 | 0 | $0 |
| FILES CLOSED FOR INCOMPLETENESS | 0 | $0 | 0 | $0 |
Aggregated Statistics For Year 2008
(Based on 2 partial tracts)
|
| A) Conventional
Home Purchase Loans | B) Refinancings
|
|---|
| Number | Average Value | Number | Average Value |
|---|
| LOANS ORIGINATED | 3 | $179,060 | 3 | $157,297 |
| APPLICATIONS APPROVED, NOT ACCEPTED | 1 | $207,670 | 1 | $123,460 |
| APPLICATIONS DENIED | 0 | $0 | 1 | $157,020 |
| APPLICATIONS WITHDRAWN | 0 | $0 | 0 | $0 |
| FILES CLOSED FOR INCOMPLETENESS | 0 | $0 | 0 | $0 |
Aggregated Statistics For Year 2007
(Based on 2 partial tracts)
|
| A) Conventional
Home Purchase Loans | B) Refinancings
|
|---|
| Number | Average Value | Number | Average Value |
|---|
| LOANS ORIGINATED | 7 | $171,553 | 2 | $184,280 |
| APPLICATIONS APPROVED, NOT ACCEPTED | 1 | $279,880 | 0 | $0 |
| APPLICATIONS DENIED | 0 | $0 | 0 | $0 |
| APPLICATIONS WITHDRAWN | 0 | $0 | 0 | $0 |
| FILES CLOSED FOR INCOMPLETENESS | 0 | $0 | 0 | $0 |
Aggregated Statistics For Year 2006
(Based on 2 partial tracts)
|
| A) Conventional
Home Purchase Loans | B) Refinancings
|
|---|
| Number | Average Value | Number | Average Value |
|---|
| LOANS ORIGINATED | 4 | $169,635 | 2 | $231,980 |
| APPLICATIONS APPROVED, NOT ACCEPTED | 0 | $0 | 0 | $0 |
| APPLICATIONS DENIED | 0 | $0 | 0 | $0 |
| APPLICATIONS WITHDRAWN | 0 | $0 | 0 | $0 |
| FILES CLOSED FOR INCOMPLETENESS | 0 | $0 | 0 | $0 |
Aggregated Statistics For Year 2005
(Based on 2 partial tracts)
|
| A) Conventional
Home Purchase Loans | B) Refinancings
|
|---|
| Number | Average Value | Number | Average Value |
|---|
| LOANS ORIGINATED | 3 | $107,260 | 2 | $119,500 |
| APPLICATIONS APPROVED, NOT ACCEPTED | 0 | $0 | 0 | $0 |
| APPLICATIONS DENIED | 0 | $0 | 0 | $0 |
| APPLICATIONS WITHDRAWN | 0 | $0 | 1 | $93,560 |
| FILES CLOSED FOR INCOMPLETENESS | 0 | $0 | 0 | $0 |
Aggregated Statistics For Year 2004
(Based on 2 partial tracts)
|
| A) Conventional
Home Purchase Loans | B) Refinancings
|
|---|
| Number | Average Value | Number | Average Value |
|---|
| LOANS ORIGINATED | 2 | $101,700 | 2 | $180,720 |
| APPLICATIONS APPROVED, NOT ACCEPTED | 1 | $119,800 | 1 | $98,240 |
| APPLICATIONS DENIED | 0 | $0 | 0 | $0 |
| APPLICATIONS WITHDRAWN | 0 | $0 | 0 | $0 |
| FILES CLOSED FOR INCOMPLETENESS | 0 | $0 | 0 | $0 |
 100% rural population.


 Nearest zip codes: 84327, 84306, 84325, 84338, 84311, 84335.


