Estimated zip code population in 2022: 5,084 Zip code population in 2010: 4,028 Zip code population in 2000: 3,509
Houses and condos: 1,607 Renter-occupied apartments: 346
% of renters here:
22%
State:
29%
March 2022 cost of living index in zip code 84312: 86.0 (less than average, U.S. average is 100)
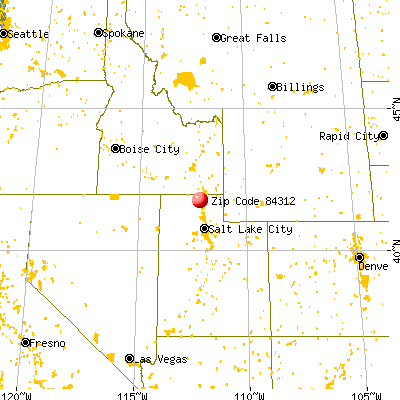
Land area: 23.4 sq. mi. Water area: 0.0 sq. mi.
Population density: 217 people per square mile
(very low).
OSM Map
General Map
Google Map
MSN Map
OSM Map
General Map
Google Map
MSN Map
OSM Map
General Map
Google Map
MSN Map
OSM Map
General Map
Google Map
MSN Map
Please wait while loading the map...
Real estate property taxes paid for housing units in 2022:
This zip code:
0.5% ($1,635)
Utah:
0.5% ($2,376)
Median real estate property taxes paid for housing units with mortgages in 2022: $1,655 (0.5%) Median real estate property taxes paid for housing units with no mortgage in 2022: $1,575 (0.5%)
Business Search- 14 Million verified businesses
Males: 2,509
(49.4%)
Females: 2,575
(50.6%)
For population 25 years and over in 84312:
High school or higher: 92.1%
Bachelor's degree or higher: 23.2%
Graduate or professional degree: 4.8%
Unemployed: 2.1%
Mean travel time to work (commute): 24.3 minutes
For population 15 years and over in 84312:
Never married: 26.6%
Now married: 63.3%
Separated: 0.5%
Widowed: 3.7%
Divorced: 5.8%
Zip code 84312 compared to state average:
Black race population percentage significantly below state average.
Foreign-born population percentage significantly below state average.
Length of stay since moving in significantly above state average.
Percentage of population with a bachelor's degree or higher below state average.
Averages for the 2020 tax year for zip code 84312, filed in 2021:
Average Adjusted Gross Income (AGI) in 2020: $60,680 (Individual Income Tax Returns)
Here:
$60,680
State:
$81,660
Salary/wage: $53,285 (reported on 87.8% of returns)
Here:
$53,285
State:
$63,027
(% of AGI for various income ranges: 1218.3% for AGIs below $25k, 4042.4% for AGIs $25k-50k, 6950.0% for AGIs $50k-75k, 10191.3% for AGIs $75k-100k, 18402.5% for AGIs $100k-200k)
Taxable interest for individuals: $926 (reported on 33.7% of returns)
This zip code:
$926
Utah:
$2,255
(% of AGI for various income ranges: 8.1% for AGIs below $25k, 26.2% for AGIs $25k-50k, 22.8% for AGIs $50k-75k, 20.7% for AGIs $75k-100k, 155.0% for AGIs $100k-200k)
Ordinary dividends: $1,613 (reported on 12.7% of returns)
Here:
$1,613
State:
$7,362
(% of AGI for various income ranges: 4.4% for AGIs below $25k, 15.4% for AGIs $25k-50k, 15.6% for AGIs $50k-75k, 20.7% for AGIs $75k-100k, 142.5% for AGIs $100k-200k)
Net capital gain/loss in AGI: +$15,948 (reported on 12.7% of returns)
Here:
+$15,948
State:
+$43,433
(% of AGI for various income ranges: 13.9% for AGIs below $25k, 56.5% for AGIs $25k-50k, 64.0% for AGIs $50k-75k, 218.7% for AGIs $75k-100k, 1825.6% for AGIs $100k-200k)
Profit/loss from business: +$2,262 (reported on 14.4% of returns)
Here:
+$2,262
State:
+$9,957
(% of AGI for various income ranges: 71.1% for AGIs below $25k, 2.4% for AGIs $25k-50k, 12.0% for AGIs $50k-75k, 79.3% for AGIs $75k-100k, 108.7% for AGIs $100k-200k)
Taxable individual retirement arrangement distribution: $13,464 (reported on 7.7% of returns)
84312:
$13,464
Utah:
$21,167
(% of AGI for various income ranges: 76.7% for AGIs below $25k, 67.3% for AGIs $25k-50k, 288.0% for AGIs $50k-75k, 400.0% for AGIs $100k-200k)
Total itemized deductions: $30,480 (reported on 8.3% of returns)
Here:
$30,480
State:
$41,056
(% of AGI for various income ranges: 163.9% for AGIs below $25k, 323.2% for AGIs $50k-75k, 1983.7% for AGIs $100k-200k)
Charity contributions: $14,742 (reported on 6.6% of returns)
Here:
$14,742
State:
$22,261
(% of AGI for various income ranges: 115.6% for AGIs $50k-75k, 925.0% for AGIs $100k-200k)
Taxes paid: $6,747 (reported on 8.3% of returns)
84312:
$6,747
State:
$7,985
(% of AGI for various income ranges: 19.4% for AGIs below $25k, 82.0% for AGIs $50k-75k, 460.6% for AGIs $100k-200k)
Earned income credit: $2,493 (reported on 14.9% of returns)
Here:
$2,493
State:
$2,169
(% of AGI for various income ranges: 93.1% for AGIs below $25k, 87.8% for AGIs $25k-50k, 5.2% for AGIs $50k-75k)
Percentage of individuals using paid preparers for their 2020 taxes: 95.6%
Here:
96%
State:
94%
(% for various income ranges: 92.0% for AGIs below $25k, 95.7% for AGIs $25k-50k, 97.0% for AGIs $50k-75k, 95.2% for AGIs $75k-100k, 100.0% for AGIs $100k-200k, 100.0% for AGIs over 200k)
Averages for the 2012 tax year for zip code 84312, filed in 2013:
Average Adjusted Gross Income (AGI) in 2012: $44,688 (Individual Income Tax Returns)
Here:
$44,688
State:
$60,327
Salary/wage: $40,515 (reported on 87.8% of returns)
Here:
$40,515
State:
$48,762
(% of AGI for various income ranges: 78.6% for AGIs below $25k, 79.5% for AGIs $25k-50k, 85.0% for AGIs $50k-75k, 82.2% for AGIs $75k-100k, 69.5% for AGIs $100k-200k)
Taxable interest for individuals: $513 (reported on 36.1% of returns)
This zip code:
$513
Utah:
$1,534
(% of AGI for various income ranges: 0.7% for AGIs below $25k, 0.6% for AGIs $25k-50k, 0.4% for AGIs $50k-75k, 0.2% for AGIs $75k-100k, 0.2% for AGIs $100k-200k)
Ordinary dividends: $822 (reported on 12.2% of returns)
Here:
$822
State:
$5,711
(% of AGI for various income ranges: 0.2% for AGIs below $25k, 0.2% for AGIs $25k-50k, 0.2% for AGIs $50k-75k, 0.4% for AGIs $75k-100k)
Net capital gain/loss in AGI: +$3,857 (reported on 9.5% of returns)
Here:
+$3,857
State:
+$23,734
(% of AGI for various income ranges: 0.4% for AGIs $50k-75k, 2.3% for AGIs $75k-100k, 1.2% for AGIs $100k-200k)
Profit/loss from business: +$2,105 (reported on 14.3% of returns)
Here:
+$2,105
State:
+$8,845
(% of AGI for various income ranges: 1.4% for AGIs below $25k, 0.2% for AGIs $25k-50k, 0.8% for AGIs $50k-75k, 1.2% for AGIs $75k-100k)
Taxable individual retirement arrangement distribution: $12,219 (reported on 10.9% of returns)
84312:
$12,219
Utah:
$15,565
(% of AGI for various income ranges: 5.0% for AGIs below $25k, 3.0% for AGIs $25k-50k, 1.8% for AGIs $50k-75k, 6.2% for AGIs $75k-100k)
Total itemized deductions: $18,644 (26% of AGI, reported on 34.0% of returns)
Here:
$18,644
State:
$25,197
Here:
26.4% of AGI
State:
22.4% of AGI
(% of AGI for various income ranges: 7.8% for AGIs below $25k, 11.7% for AGIs $25k-50k, 13.8% for AGIs $50k-75k, 18.5% for AGIs $75k-100k, 16.1% for AGIs $100k-200k)
Charity contributions: $6,336 (reported on 28.6% of returns)
Here:
$6,336
State:
$8,502
(% of AGI for various income ranges: 1.1% for AGIs below $25k, 2.6% for AGIs $25k-50k, 4.1% for AGIs $50k-75k, 5.2% for AGIs $75k-100k, 5.8% for AGIs $100k-200k)
Taxes paid: $4,228 (reported on 34.0% of returns)
84312:
$4,228
State:
$7,001
(% of AGI for various income ranges: 0.9% for AGIs below $25k, 2.0% for AGIs $25k-50k, 2.9% for AGIs $50k-75k, 4.3% for AGIs $75k-100k, 5.0% for AGIs $100k-200k)
Earned income credit: $2,232 (reported on 19.0% of returns)
Here:
$2,232
State:
$2,259
(% of AGI for various income ranges: 5.3% for AGIs below $25k, 1.9% for AGIs $25k-50k)
Percentage of individuals using paid preparers for their 2012 taxes: 55.8%
Here:
56%
State:
51%
(% for various income ranges: 50.0% for AGIs below $25k, 55.3% for AGIs $25k-50k, 60.0% for AGIs $50k-75k, 62.5% for AGIs $75k-100k, 66.7% for AGIs $100k-200k)
Averages for the 2004 tax year for zip code 84312, filed in 2005:
Average Adjusted Gross Income (AGI) in 2004: $36,748 (Individual Income Tax Returns)
Here:
$36,748
State:
$45,498
Salary/wage: $35,515 (reported on 88.7% of returns)
Here:
$35,515
State:
$38,975
(% of AGI for various income ranges: 107.0% for AGIs below $10k, 77.0% for AGIs $10k-25k, 89.8% for AGIs $25k-50k, 87.8% for AGIs $50k-75k, 83.1% for AGIs $75k-100k, 72.6% for AGIs over 100k)
Taxable interest for individuals: $620 (reported on 47.4% of returns)
This zip code:
$620
Utah:
$1,445
(% of AGI for various income ranges: 5.2% for AGIs below $10k, 2.0% for AGIs $10k-25k, 0.5% for AGIs $25k-50k, 0.4% for AGIs $50k-75k, 0.6% for AGIs $75k-100k, 1.2% for AGIs over 100k)
Taxable dividends: $711 (reported on 13.2% of returns)
Here:
$711
State:
$3,152
(% of AGI for various income ranges: 0.7% for AGIs below $10k, 1.0% for AGIs $10k-25k, 0.2% for AGIs $25k-50k, 0.1% for AGIs $50k-75k, 0.1% for AGIs $75k-100k, 0.5% for AGIs over 100k)
Net capital gain/loss: +$6,351 (reported on 11.5% of returns)
Here:
+$6,351
State:
+$14,059
(% of AGI for various income ranges: -0.8% for AGIs below $10k, 0.6% for AGIs $10k-25k, 0.5% for AGIs $25k-50k, 0.4% for AGIs $50k-75k, 2.6% for AGIs $75k-100k, 13.8% for AGIs over 100k)
Profit/loss from business: +$697 (reported on 14.8% of returns)
Here:
+$697
State:
+$6,903
(% of AGI for various income ranges: 8.0% for AGIs below $10k, 0.4% for AGIs $10k-25k, 0.6% for AGIs $25k-50k, -0.4% for AGIs $50k-75k, 0.1% for AGIs $75k-100k)
IRA payment deduction: $1,833 (reported on 0.9% of returns)
84312:
$1,833
Utah:
$2,970
Total itemized deductions: $15,397 (26% of AGI, reported on 36.4% of returns)
Here:
$15,397
State:
$20,312
Here:
26.3% of AGI
State:
24.9% of AGI
(% of AGI for various income ranges: 10.5% for AGIs $10k-25k, 13.2% for AGIs $25k-50k, 17.6% for AGIs $50k-75k, 17.7% for AGIs $75k-100k, 18.5% for AGIs over 100k)
Charity contributions deductions: $5,028 (8% of AGI, reported on 33.1% of returns)
Here:
$5,028
State:
$6,250
Here:
8.5% of AGI
State:
7.4% of AGI
(% of AGI for various income ranges: 2.4% for AGIs $10k-25k, 3.4% for AGIs $25k-50k, 5.3% for AGIs $50k-75k, 5.3% for AGIs $75k-100k, 7.5% for AGIs over 100k)
Total tax: $3,172 (reported on 69.9% of returns)
84312:
$3,172
State:
$6,523
(% of AGI for various income ranges: 3.4% for AGIs below $10k, 3.6% for AGIs $10k-25k, 4.2% for AGIs $25k-50k, 6.0% for AGIs $50k-75k, 8.6% for AGIs $75k-100k, 11.0% for AGIs over 100k)
Earned income credit: $1,590 (reported on 13.5% of returns)
Here:
$1,590
State:
$1,703
Percentage of individuals using paid preparers for their 2004 taxes: 60.6%
Here:
61%
State:
53%
(% for various income ranges: 52.7% for AGIs below $10k, 63.0% for AGIs $10k-25k, 57.9% for AGIs $25k-50k, 64.6% for AGIs $50k-75k, 73.5% for AGIs $75k-100k, 67.6% for AGIs over 100k)
Household received Food Stamps/SNAP in the past 12 months: 213 Household did not receive Food Stamps/SNAP in the past 12 months: 1,342
Women who had a birth in the past 12 months: 169 (166 now married, 5 unmarried) Women who did not have a birth in the past 12 months: 1,033 (489 now married, 544 unmarried)
Housing units in zip code 84312 with a mortgage: 745 (51 second mortgage, 50 both second mortgage and home equity loan) Houses without a mortgage: 21
Median monthly owner costs for units with a mortgage: $1,375 Median monthly owner costs for units without a mortgage: $393
Residents with income below the poverty level in 2022:
This zip code:
7.3%
Whole state:
8.2%
Residents with income below 50% of the poverty level in 2022:
This zip code:
4.3%
Whole state:
4.3%
Median number of rooms in houses and condos:
Here:
6.9
State:
7.6
Median number of rooms in apartments:
Here:
4.9
State:
4.3
Notable locations in this zip code not listed on our city pages
Size of family households: 447 2-persons, 176 3-persons, 251 4-persons, 169 5-persons, 97 6-persons, 58 7-or-more-persons
Size of nonfamily households: 273 1-person, 80 2-persons
1,351 married couples with children.
124 single-parent households (57 men, 67 women).
93.2% of residents of 84312 zip code speak English at home.
3.7% of residents speak Spanish at home (94% very well, 6% well).
2.0% of residents speak other Indo-European language at home (100% very well).
0.2% of residents speak Asian or Pacific Island language at home (100% very well).
Foreign born population: 38 (0.8%) (66.2% of them are naturalized citizens)
This zip code:
0.8%
Whole state:
8.6%
31%Honduras
42%English
13%German
11%American
8%Danish
5%European
2%Swedish
2%British
Year of entry for the foreign-born population
72010 or later
02000 to 2009
171990 to 1999
36Before 1990
Facilities with environmental interests located in this zip code:
BEAR RIVER HIGH SCHOOL (1450 SOUTH MAIN STREET in GARLAND, UT)
COMPLIANCE ACTIVITY (Tracking inspections of insecticide, fungicide, and rodenticide, and toxic substances) (National Center for Education Statistics) - STATE ID-03 704 Organizations: BOX ELDER SCHOOL DISTRICT (SCHOOL DISTRICT)
BEAR RIVER MIDDLE (300 E 1500 S in GARLAND, UT)
(National Center for Education Statistics) - STATE ID-03 404 Organizations: BOX ELDER SCHOOL DISTRICT (SCHOOL DISTRICT)
GARLAND ELEM SCH (250 N MAIN in GARLAND, UT)
(National Center for Education Statistics) - STATE ID-03 136 Organizations: BOX ELDER SCHOOL DISTRICT (SCHOOL DISTRICT)
GARLAND CITY (P.O. BOX 129 in GARLAND, UT)
National Pollutant Discharge Elimination System NON-MAJOR (Tracking pollutant discharge elimination systems) - permit Business SIC classification: SEWERAGE SYSTEMS
GARLAND ELEMENTARY SCHOOL (250 NROTH MAIN STREET in GARLAND, UT)
COMPLIANCE ACTIVITY (Tracking inspections of insecticide, fungicide, and rodenticide, and toxic substances)
INTERMOUNTAIN FARMERS ASSOCIATION (5260 WEST 12800 NORTH in GARLAND, UT)
ENFORCEMENT/COMPLIANCE ACTIVITY (Integrated Compliance Information System) Business SIC classification: FARM SUPPLIES Alternative names: GARLAND BRANCH
Housing units lacking complete kitchen facilities: 0.2%
81.6%Utility gas
6.6%Electricity
4.8%Bottled, tank, or LP gas
4.4%Wood
2.7%Other fuel
Population in 1990: 2,208. Population change in the 1990s: +1,301 (+58.9%).
Place of birth for U.S.-born residents:
This state: 4,141
Northeast: 28
Midwest: 25
South: 113
West: 671
56% of the 84312 zip code residents lived in the same house 5 years ago. Out of people who lived in different houses, 50% lived in this county. Out of people who lived in different counties, 50% lived in Utah.
90% of the 84312 zip code residents lived in the same house 1 year ago. Out of people who lived in different houses, 44% moved from this county. Out of people who lived in different houses, 52% moved from different county within same state. Out of people who lived in different houses, 7% moved from different state.
Private vs. public school enrollment:
Students in private schools in grades 1 to 8 (elementary and middle school): 23
Here:
3.4%
Utah:
7.2%
Students in private schools in grades 9 to 12 (high school):
Here:
0.0%
Utah:
5.3%
Students in private undergraduate colleges: 28
Here:
23.6%
Utah:
26.7%
Occupation by median earnings in the past 12 months ($)
109,409Computer and mathematical occupations
98,134Architecture and engineering occupations
85,436Business and financial operations occupations
79,617Life, physical, and social science occupations
61,186Management occupations
58,560Construction and extraction occupations
Top industries in this zip code by the number of employees in 2005:
Accommodation and Food Services: Limited-Service Restaurants (20-49 employees: 1 establishment)
Health Care and Social Assistance: Offices of Physicians (except Mental Health Specialists) (10-19: 1)
Finance and Insurance: Credit Unions (10-19: 1)
Construction: Commercial and Institutional Building Construction (10-19: 1)
Construction: New Single-Family Housing Construction (except Operative Builders) (1-4: 5)
Fatal accident statistics in 2014:
Fatal accident count: 1
Vehicles involved in fatal accidents: 1
Fatal accidents caused by drunken drivers: 0
Fatalities: 1
Persons involved in fatal accidents: 1
Pedestrians involved in fatal accidents: 0
Fatal accident statistics in 2010:
Fatal accident count: 1
Vehicles involved in fatal accidents: 2
Fatal accidents caused by drunken drivers: 0
Fatalities: 1
Persons involved in fatal accidents: 3
Pedestrians involved in fatal accidents: 0
2002 - 2018 National Fire Incident Reporting System (NFIRS) incidents
According to the data from the years 2002 - 2018 the average number of fire incidents per year is 9. The highest number of fires - 18 took place in 2013, and the least - 0 in 2004. The data has a rising trend.
When looking into fire subcategories, the most reports belonged to: Outside Fires (48.0%), and Structure Fires (32.7%).
Fire incident types reported to NFIRS in Zip Code 84312


 Nearest zip codes: 84334, 84311, 84309, 84306, 84314, 84330.


 According to the data from the years 2002 - 2018 the average number of fire incidents per year is 9. The highest number of fires - 18 took place in 2013, and the least - 0 in 2004. The data has a rising trend.
 When looking into fire subcategories, the most reports belonged to: Outside Fires (48.0%), and Structure Fires (32.7%).