Estimated zip code population in 2022: 2,827 Zip code population in 2010: 2,237 Zip code population in 2000: 2,475
Houses and condos: 897 Renter-occupied apartments: 162
% of renters here:
19%
State:
29%
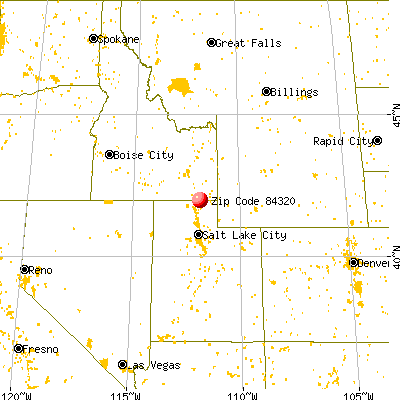
March 2022 cost of living index in zip code 84320: 84.4 (less than average, U.S. average is 100)
Land area: 44.5 sq. mi. Water area: 0.1 sq. mi.
Population density: 64 people per square mile
(very low).
OSM Map
General Map
Google Map
MSN Map
OSM Map
General Map
Google Map
MSN Map
OSM Map
General Map
Google Map
MSN Map
OSM Map
General Map
Google Map
MSN Map
Please wait while loading the map...
Real estate property taxes paid for housing units in 2022:
This zip code:
0.5% ($1,776)
Utah:
0.5% ($2,376)
Median real estate property taxes paid for housing units with mortgages in 2022: $1,776 (0.5%) Median real estate property taxes paid for housing units with no mortgage in 2022: $1,776 (0.5%)
Business Search- 14 Million verified businesses
Males: 1,423
(50.3%)
Females: 1,403
(49.7%)
For population 25 years and over in 84320:
High school or higher: 93.0%
Bachelor's degree or higher: 26.3%
Graduate or professional degree: 8.2%
Unemployed: 0.5%
Mean travel time to work (commute): 22.7 minutes
For population 15 years and over in 84320:
Never married: 23.0%
Now married: 67.1%
Separated: 0.1%
Widowed: 3.6%
Divorced: 6.1%
Zip code 84320 compared to state average:
Unemployed percentage significantly below state average.
Black race population percentage significantly below state average.
Hispanic race population percentage significantly below state average.
Foreign-born population percentage significantly below state average.
Renting percentage below state average.
Length of stay since moving in significantly above state average.
House age above state average.
Percentage of population with a bachelor's degree or higher below state average.
Averages for the 2020 tax year for zip code 84320, filed in 2021:
Average Adjusted Gross Income (AGI) in 2020: $64,019 (Individual Income Tax Returns)
Here:
$64,019
State:
$81,660
Salary/wage: $51,793 (reported on 86.9% of returns)
Here:
$51,793
State:
$63,027
(% of AGI for various income ranges: 1300.6% for AGIs below $25k, 4173.8% for AGIs $25k-50k, 7909.2% for AGIs $50k-75k, 10117.5% for AGIs $75k-100k, 14431.2% for AGIs $100k-200k)
Taxable interest for individuals: $1,658 (reported on 33.3% of returns)
This zip code:
$1,658
Utah:
$2,255
(% of AGI for various income ranges: 21.1% for AGIs below $25k, 101.0% for AGIs $25k-50k, 37.5% for AGIs $50k-75k, 31.2% for AGIs $75k-100k, 216.2% for AGIs $100k-200k)
Ordinary dividends: $5,071 (reported on 17.2% of returns)
Here:
$5,071
State:
$7,362
(% of AGI for various income ranges: 40.0% for AGIs $25k-50k, 50.8% for AGIs $50k-75k, 896.2% for AGIs $100k-200k)
Net capital gain/loss in AGI: +$22,422 (reported on 18.2% of returns)
Here:
+$22,422
State:
+$43,433
(% of AGI for various income ranges: 31.7% for AGIs below $25k, 116.7% for AGIs $25k-50k, 83.3% for AGIs $50k-75k, 400.0% for AGIs $75k-100k, 4142.5% for AGIs $100k-200k)
Profit/loss from business: +$4,887 (reported on 15.2% of returns)
Here:
+$4,887
State:
+$9,957
(% of AGI for various income ranges: 188.3% for AGIs below $25k, 76.2% for AGIs $25k-50k, 34.2% for AGIs $50k-75k, 212.5% for AGIs $75k-100k, 28.7% for AGIs $100k-200k)
Taxable individual retirement arrangement distribution: $15,557 (reported on 7.1% of returns)
84320:
$15,557
Utah:
$21,167
(% of AGI for various income ranges: 231.4% for AGIs $25k-50k, 753.8% for AGIs $75k-100k)
Total itemized deductions: $42,011 (reported on 9.1% of returns)
Here:
$42,011
State:
$41,056
(% of AGI for various income ranges: 689.2% for AGIs $50k-75k, 1812.5% for AGIs $100k-200k)
Charity contributions: $19,844 (reported on 9.1% of returns)
Here:
$19,844
State:
$22,261
(% of AGI for various income ranges: 148.6% for AGIs $25k-50k, 840.0% for AGIs $100k-200k)
Taxes paid: $8,167 (reported on 9.1% of returns)
84320:
$8,167
State:
$7,985
(% of AGI for various income ranges: 116.7% for AGIs $50k-75k, 461.2% for AGIs $100k-200k)
Earned income credit: $2,446 (reported on 13.1% of returns)
Here:
$2,446
State:
$2,169
(% of AGI for various income ranges: 71.1% for AGIs below $25k, 90.5% for AGIs $25k-50k)
Percentage of individuals using paid preparers for their 2020 taxes: 93.9%
Here:
94%
State:
94%
(% for various income ranges: 92.3% for AGIs below $25k, 92.6% for AGIs $25k-50k, 94.4% for AGIs $50k-75k, 91.7% for AGIs $75k-100k, 100.0% for AGIs $100k-200k, 100.0% for AGIs over 200k)
Averages for the 2012 tax year for zip code 84320, filed in 2013:
Average Adjusted Gross Income (AGI) in 2012: $45,222 (Individual Income Tax Returns)
Here:
$45,222
State:
$60,327
Salary/wage: $39,373 (reported on 87.5% of returns)
Here:
$39,373
State:
$48,762
(% of AGI for various income ranges: 82.2% for AGIs below $25k, 82.5% for AGIs $25k-50k, 84.5% for AGIs $50k-75k, 83.6% for AGIs $75k-100k, 52.4% for AGIs $100k-200k)
Taxable interest for individuals: $1,244 (reported on 38.6% of returns)
This zip code:
$1,244
Utah:
$1,534
(% of AGI for various income ranges: 1.8% for AGIs below $25k, 1.9% for AGIs $25k-50k, 0.3% for AGIs $50k-75k, 0.5% for AGIs $75k-100k, 1.2% for AGIs $100k-200k)
Ordinary dividends: $1,950 (reported on 13.6% of returns)
Here:
$1,950
State:
$5,711
(% of AGI for various income ranges: 0.5% for AGIs below $25k, 0.3% for AGIs $25k-50k, 0.3% for AGIs $50k-75k, 2.3% for AGIs $75k-100k)
Net capital gain/loss in AGI: +$10,120 (reported on 11.4% of returns)
Here:
+$10,120
State:
+$23,734
Profit/loss from business: +$4,136 (reported on 15.9% of returns)
Here:
+$4,136
State:
+$8,845
(% of AGI for various income ranges: 4.0% for AGIs below $25k, 1.5% for AGIs $25k-50k, 2.3% for AGIs $50k-75k, 0.7% for AGIs $75k-100k)
Taxable individual retirement arrangement distribution: $5,783 (reported on 6.8% of returns)
84320:
$5,783
Utah:
$15,565
Total itemized deductions: $20,174 (27% of AGI, reported on 35.2% of returns)
Here:
$20,174
State:
$25,197
Here:
26.9% of AGI
State:
22.4% of AGI
(% of AGI for various income ranges: 8.8% for AGIs below $25k, 13.4% for AGIs $25k-50k, 17.1% for AGIs $50k-75k, 18.8% for AGIs $75k-100k, 17.3% for AGIs $100k-200k)
Charity contributions: $8,189 (reported on 31.8% of returns)
Here:
$8,189
State:
$8,502
(% of AGI for various income ranges: 4.7% for AGIs $25k-50k, 5.7% for AGIs $50k-75k, 7.3% for AGIs $75k-100k, 8.2% for AGIs $100k-200k)
Taxes paid: $4,372 (reported on 36.4% of returns)
84320:
$4,372
State:
$7,001
(% of AGI for various income ranges: 1.3% for AGIs below $25k, 2.0% for AGIs $25k-50k, 3.7% for AGIs $50k-75k, 4.6% for AGIs $75k-100k, 4.9% for AGIs $100k-200k)
Earned income credit: $2,306 (reported on 19.3% of returns)
Here:
$2,306
State:
$2,259
(% of AGI for various income ranges: 5.4% for AGIs below $25k, 1.8% for AGIs $25k-50k)
Percentage of individuals using paid preparers for their 2012 taxes: 61.4%
Here:
61%
State:
51%
(% for various income ranges: 59.4% for AGIs below $25k, 61.5% for AGIs $25k-50k, 60.0% for AGIs $50k-75k, 66.7% for AGIs $75k-100k, 66.7% for AGIs $100k-200k)
Averages for the 2004 tax year for zip code 84320, filed in 2005:
Average Adjusted Gross Income (AGI) in 2004: $36,894 (Individual Income Tax Returns)
Here:
$36,894
State:
$45,498
Salary/wage: $30,526 (reported on 87.0% of returns)
Here:
$30,526
State:
$38,975
(% of AGI for various income ranges: 101.4% for AGIs below $10k, 76.2% for AGIs $10k-25k, 86.1% for AGIs $25k-50k, 83.2% for AGIs $50k-75k, 67.9% for AGIs $75k-100k, 35.6% for AGIs over 100k)
Taxable interest for individuals: $1,071 (reported on 50.8% of returns)
This zip code:
$1,071
Utah:
$1,445
(% of AGI for various income ranges: 5.5% for AGIs below $10k, 2.7% for AGIs $10k-25k, 1.5% for AGIs $25k-50k, 0.6% for AGIs $50k-75k, 1.5% for AGIs $75k-100k, 1.3% for AGIs over 100k)
Taxable dividends: $1,030 (reported on 15.7% of returns)
Here:
$1,030
State:
$3,152
(% of AGI for various income ranges: 2.6% for AGIs below $10k, 0.2% for AGIs $10k-25k, 0.2% for AGIs $25k-50k, 0.1% for AGIs $50k-75k, 1.7% for AGIs $75k-100k, 0.4% for AGIs over 100k)
Net capital gain/loss: +$10,347 (reported on 19.5% of returns)
Here:
+$10,347
State:
+$14,059
(% of AGI for various income ranges: 26.3% for AGIs below $10k, 2.0% for AGIs $10k-25k, 2.5% for AGIs $25k-50k, 6.5% for AGIs $50k-75k, 9.4% for AGIs $75k-100k, 6.1% for AGIs over 100k)
Profit/loss from business: +$1,022 (reported on 15.9% of returns)
Here:
+$1,022
State:
+$6,903
(% of AGI for various income ranges: 5.5% for AGIs below $10k, 3.9% for AGIs $10k-25k, 0.2% for AGIs $25k-50k, -0.9% for AGIs $50k-75k)
IRA payment deduction: $2,909 (reported on 2.6% of returns)
84320:
$2,909
Utah:
$2,970
Total itemized deductions: $15,950 (27% of AGI, reported on 34.9% of returns)
Here:
$15,950
State:
$20,312
Here:
27.2% of AGI
State:
24.9% of AGI
(% of AGI for various income ranges: 13.0% for AGIs $10k-25k, 15.4% for AGIs $25k-50k, 20.2% for AGIs $50k-75k, 16.5% for AGIs $75k-100k, 11.5% for AGIs over 100k)
Charity contributions deductions: $6,367 (10% of AGI, reported on 32.5% of returns)
Here:
$6,367
State:
$6,250
Here:
9.7% of AGI
State:
7.4% of AGI
(% of AGI for various income ranges: 4.1% for AGIs $10k-25k, 4.2% for AGIs $25k-50k, 7.6% for AGIs $50k-75k, 7.0% for AGIs $75k-100k, 6.2% for AGIs over 100k)
Total tax: $4,148 (reported on 67.3% of returns)
84320:
$4,148
State:
$6,523
(% of AGI for various income ranges: 2.4% for AGIs below $10k, 3.4% for AGIs $10k-25k, 3.7% for AGIs $25k-50k, 5.5% for AGIs $50k-75k, 7.7% for AGIs $75k-100k, 18.0% for AGIs over 100k)
Earned income credit: $1,823 (reported on 15.2% of returns)
Here:
$1,823
State:
$1,703
Percentage of individuals using paid preparers for their 2004 taxes: 69.2%
Here:
69%
State:
53%
(% for various income ranges: 59.0% for AGIs below $10k, 71.4% for AGIs $10k-25k, 73.7% for AGIs $25k-50k, 68.3% for AGIs $50k-75k, 68.6% for AGIs $75k-100k, 80.6% for AGIs over 100k)
Household received Food Stamps/SNAP in the past 12 months: 18 Household did not receive Food Stamps/SNAP in the past 12 months: 831
Women who had a birth in the past 12 months: 57 (53 now married, 3 unmarried) Women who did not have a birth in the past 12 months: 598 (297 now married, 301 unmarried)
Housing units in zip code 84320 with a mortgage: 360 (37 second mortgage, 16 both second mortgage and home equity loan) Median monthly owner costs for units with a mortgage: $1,554 Median monthly owner costs for units without a mortgage: $483
Residents with income below the poverty level in 2022:
This zip code:
2.8%
Whole state:
8.2%
Residents with income below 50% of the poverty level in 2022:
This zip code:
1.6%
Whole state:
4.3%
Median number of rooms in houses and condos:
Here:
7.5
State:
7.6
Median number of rooms in apartments:
Here:
5.3
State:
4.3
Notable locations in this zip code not listed on our city pages
In group quarters: 6 (-1 institutionalized population)
Size of family households: 321 2-persons, 114 3-persons, 99 4-persons, 88 5-persons, 72 6-persons, 65 7-or-more-persons
Size of nonfamily households: 77 1-person, 4 2-persons
787 married couples with children.
77 single-parent households (29 men, 48 women).
96.1% of residents of 84320 zip code speak English at home.
2.5% of residents speak Spanish at home (73% very well, 5% well, 22% not well).
0.7% of residents speak other Indo-European language at home (100% very well).
0.2% of residents speak Asian or Pacific Island language at home (100% very well).
Foreign born population: 32 (1.1%) (12.7% of them are naturalized citizens)
This zip code:
1.1%
Whole state:
8.6%
65%Honduras
19%France
3%Netherlands
45%English
18%European
12%American
4%Danish
3%Welsh
2%German
1%Scandinavian
Year of entry for the foreign-born population
92010 or later
72000 to 2009
171990 to 1999
2Before 1990
Facilities with environmental interests located in this zip code:
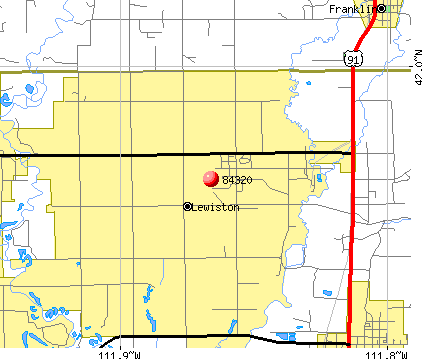
LEWISTON CITY (59 SOUTH MAIN STREET in LEWISTON, UT)
STATE MASTER (Utah compliance and permitting operations) - DMAC-5, DRINKING WATER SYSTEM National Pollutant Discharge Elimination System NON-MAJOR (Tracking pollutant discharge elimination systems) - permit Business SIC classification: SEWERAGE SYSTEMS Alternative names: LEWISTON CITY LE
GOASLIND SPRING WW CO. (1113 E. 13000 N in COVE, UT)
(Integrated Compliance Information System) - ICIS-08-1997-0043, FORMAL ENFORCEMENT ACTION Business SIC classification: WATER SUPPLY
INTERMOUNTAIN FARMERS ASSOCIATION (13395 NORTH HIGHWAY 91 in LEWISTON, UT)
ENFORCEMENT/COMPLIANCE ACTIVITY (Integrated Compliance Information System) National Pollutant Discharge Elimination System NON-MAJOR (Tracking pollutant discharge elimination systems) - permit Business SIC classification: FERTILIZERS, MIXING ONLY; FARM SUPPLIES
AGGREGATE PROCESSING (1600 EAST 12200 NORTH in COVE, UT)
AIR SYNTHETIC MINOR (AIRS/AFS) STATE MASTER (Utah compliance and permitting operations) CRITERIA AND HAZARDOUS AIR POLLUTANT INVENTORY (Inventory of air pollution sources) Business SIC classification: CONSTRUCTION SAND AND GRAVEL Alternative names: ALLEN GRAVEL LIMITED LIABILITY COMPANY
CACHE COUNTY CORPORATION ROAD DEPARTMENT (12200 NORTH 1400 EAST in COVE, UT)
AIR MINOR (AIRS/AFS) Business SIC classification: CONSTRUCTION SAND AND GRAVEL
LEWISTON ANGRONOMY CENTER (NORTH REGION FEED in LEWISTON, UT)
National Pollutant Discharge Elimination System NON-MAJOR (Tracking pollutant discharge elimination systems) - permit Business SIC classification: PREPARED FEEDS AND FEED INGREDIENTS FOR ANIMALS AND FOWLS, EXCEPT DOGS AND CATS Alternative names: INTERMOUTAIN FARMERS ASSN
81.6%Utility gas
9.6%Electricity
6.7%Bottled, tank, or LP gas
1.3%Fuel oil, kerosene, etc.
1.3%Wood
Population in 1990: 1,418. Population change in the 1990s: +1,057 (+74.5%).
Place of birth for U.S.-born residents:
This state: 2,135
Northeast: 35
Midwest: 65
South: 41
West: 499
61% of the 84320 zip code residents lived in the same house 5 years ago. Out of people who lived in different houses, 60% lived in this county. Out of people who lived in different counties, 50% lived in Utah.
97% of the 84320 zip code residents lived in the same house 1 year ago. Out of people who lived in different houses, 65% moved from this county. Out of people who lived in different houses, 29% moved from different county within same state. Out of people who lived in different houses, 12% moved from different state. Out of people who lived in different houses, 10% moved from abroad.
Private vs. public school enrollment:
Students in private schools in grades 1 to 8 (elementary and middle school):
Here:
0.0%
Utah:
7.2%
Students in private schools in grades 9 to 12 (high school): 12
Here:
5.2%
Utah:
5.3%
Students in private undergraduate colleges: 1
Here:
1.4%
Utah:
26.7%
Occupation by median earnings in the past 12 months ($)
91,347Business and financial operations occupations
74,925Health diagnosing and treating practitioners and other technical occupations
74,307Management occupations
70,694Architecture and engineering occupations
62,779Education, training, and library occupations
44,359Production occupations
Top industries in this zip code by the number of employees in 2005:
Finance and Insurance: Commercial Banking (50-99 employees: 1 establishment)
Construction: Highway, Street, and Bridge Construction (20-49: 1, 1-4: 1)
Construction: New Single-Family Housing Construction (except Operative Builders) (10-19: 1, 5-9: 1, 1-4: 4)
Wholesale Trade: Petroleum Bulk Stations and Terminals (10-19: 1)
Health Care and Social Assistance: Residential Mental Health and Substance Abuse Facilities (10-19: 1)
People in group quarters in 2010:
10 people in group homes for juveniles (non-correctional)
Fatal accident statistics in 2014:
Fatal accident count: 1
Vehicles involved in fatal accidents: 3
Fatal accidents caused by drunken drivers: 0
Fatalities: 1
Persons involved in fatal accidents: 3
Pedestrians involved in fatal accidents: 0
Fatal accident statistics in 2013:
Fatal accident count: 1
Vehicles involved in fatal accidents: 2
Fatal accidents caused by drunken drivers: 0
Fatalities: 1
Persons involved in fatal accidents: 2
Pedestrians involved in fatal accidents: 0
Home Mortgage Disclosure Act Aggregated Statistics For Year 2009 (Based on 4 partial tracts)
A) FHA, FSA/RHS & VA Home Purchase Loans
B) Conventional Home Purchase Loans
C) Refinancings
D) Home Improvement Loans
F) Non-occupant Loans on < 5 Family Dwellings (A B C & D)
G) Loans On Manufactured Home Dwelling (A B C & D)
Number
Average Value
Number
Average Value
Number
Average Value
Number
Average Value
Number
Average Value
Number
Average Value
LOANS ORIGINATED
35
$156,108
19
$177,184
191
$156,472
4
$83,305
6
$170,547
4
$109,625
APPLICATIONS APPROVED, NOT ACCEPTED
0
$0
0
$0
26
$200,540
0
$0
0
$0
0
$0
APPLICATIONS DENIED
4
$117,145
6
$162,353
57
$164,881
5
$57,730
3
$67,380
2
$86,960
APPLICATIONS WITHDRAWN
2
$142,150
3
$258,813
19
$178,292
0
$0
1
$304,380
1
$89,580
FILES CLOSED FOR INCOMPLETENESS
0
$0
0
$0
6
$139,137
2
$71,020
0
$0
1
$91,850
Aggregated Statistics For Year 2008 (Based on 4 partial tracts)
A) FHA, FSA/RHS & VA Home Purchase Loans
B) Conventional Home Purchase Loans
C) Refinancings
D) Home Improvement Loans
E) Loans on Dwellings For 5+ Families
F) Non-occupant Loans on < 5 Family Dwellings (A B C & D)
G) Loans On Manufactured Home Dwelling (A B C & D)
Number
Average Value
Number
Average Value
Number
Average Value
Number
Average Value
Number
Average Value
Number
Average Value
Number
Average Value
LOANS ORIGINATED
17
$163,033
26
$171,985
116
$142,879
6
$84,413
1
$427,200
9
$131,570
3
$89,713
APPLICATIONS APPROVED, NOT ACCEPTED
3
$158,420
0
$0
27
$135,882
2
$26,165
0
$0
2
$173,800
0
$0
APPLICATIONS DENIED
9
$153,026
8
$179,394
62
$142,350
5
$63,942
0
$0
3
$77,760
1
$126,020
APPLICATIONS WITHDRAWN
5
$165,498
2
$108,965
32
$139,248
2
$32,215
0
$0
1
$68,350
1
$119,620
FILES CLOSED FOR INCOMPLETENESS
2
$145,590
0
$0
3
$78,637
0
$0
0
$0
0
$0
0
$0
Aggregated Statistics For Year 2007 (Based on 4 partial tracts)
A) FHA, FSA/RHS & VA Home Purchase Loans
B) Conventional Home Purchase Loans
C) Refinancings
D) Home Improvement Loans
F) Non-occupant Loans on < 5 Family Dwellings (A B C & D)
G) Loans On Manufactured Home Dwelling (A B C & D)
Number
Average Value
Number
Average Value
Number
Average Value
Number
Average Value
Number
Average Value
Number
Average Value
LOANS ORIGINATED
16
$119,932
82
$130,042
88
$138,723
9
$80,446
15
$144,375
8
$99,274
APPLICATIONS APPROVED, NOT ACCEPTED
0
$0
10
$126,705
13
$101,512
1
$10,680
4
$140,108
0
$0
APPLICATIONS DENIED
4
$171,148
17
$139,572
55
$124,224
7
$59,056
3
$98,393
4
$138,100
APPLICATIONS WITHDRAWN
0
$0
9
$142,296
28
$122,225
4
$31,728
1
$147,380
2
$140,440
FILES CLOSED FOR INCOMPLETENESS
0
$0
1
$142,510
7
$106,359
0
$0
0
$0
0
$0
Aggregated Statistics For Year 2006 (Based on 4 partial tracts)
A) FHA, FSA/RHS & VA Home Purchase Loans
B) Conventional Home Purchase Loans
C) Refinancings
D) Home Improvement Loans
F) Non-occupant Loans on < 5 Family Dwellings (A B C & D)
G) Loans On Manufactured Home Dwelling (A B C & D)
Number
Average Value
Number
Average Value
Number
Average Value
Number
Average Value
Number
Average Value
Number
Average Value
LOANS ORIGINATED
12
$98,967
86
$112,730
74
$108,025
8
$17,500
17
$107,474
3
$51,057
APPLICATIONS APPROVED, NOT ACCEPTED
0
$0
17
$96,998
18
$78,788
1
$193,310
1
$94,100
0
$0
APPLICATIONS DENIED
2
$99,095
14
$87,935
50
$120,651
3
$30,427
0
$0
0
$0
APPLICATIONS WITHDRAWN
1
$133,500
5
$68,674
22
$104,995
1
$80,980
4
$140,175
0
$0
FILES CLOSED FOR INCOMPLETENESS
0
$0
2
$100,205
8
$128,092
0
$0
0
$0
0
$0
Aggregated Statistics For Year 2005 (Based on 4 partial tracts)
A) FHA, FSA/RHS & VA Home Purchase Loans
B) Conventional Home Purchase Loans
C) Refinancings
D) Home Improvement Loans
E) Loans on Dwellings For 5+ Families
F) Non-occupant Loans on < 5 Family Dwellings (A B C & D)
G) Loans On Manufactured Home Dwelling (A B C & D)
Number
Average Value
Number
Average Value
Number
Average Value
Number
Average Value
Number
Average Value
Number
Average Value
Number
Average Value
LOANS ORIGINATED
18
$110,704
71
$104,410
101
$120,487
7
$27,326
1
$178,360
12
$69,322
7
$83,329
APPLICATIONS APPROVED, NOT ACCEPTED
1
$71,560
14
$73,098
9
$163,740
0
$0
0
$0
0
$0
3
$43,977
APPLICATIONS DENIED
2
$88,645
15
$91,810
63
$138,254
8
$63,995
1
$179,420
3
$196,303
3
$45,567
APPLICATIONS WITHDRAWN
0
$0
14
$81,707
44
$110,558
6
$116,975
0
$0
2
$99,860
4
$80,635
FILES CLOSED FOR INCOMPLETENESS
0
$0
2
$116,945
14
$137,824
1
$160,200
0
$0
0
$0
0
$0
Aggregated Statistics For Year 2004 (Based on 4 partial tracts)
A) FHA, FSA/RHS & VA Home Purchase Loans
B) Conventional Home Purchase Loans
C) Refinancings
D) Home Improvement Loans
F) Non-occupant Loans on < 5 Family Dwellings (A B C & D)
G) Loans On Manufactured Home Dwelling (A B C & D)
Detailed PMIC statistics for the following Tracts:0001.01
, 0001.02
2002 - 2018 National Fire Incident Reporting System (NFIRS) incidents
According to the data from the years 2002 - 2018 the average number of fire incidents per year is 11. The highest number of fires - 32 took place in 2010, and the least - 4 in 2011. The data has a declining trend.
When looking into fire subcategories, the most reports belonged to: Outside Fires (51.9%), and Structure Fires (31.7%).
Fire incident types reported to NFIRS in Zip Code 84320


 Nearest zip codes: 84333, 83237, 84338, 84335, 84308, 84318.


 According to the data from the years 2002 - 2018 the average number of fire incidents per year is 11. The highest number of fires - 32 took place in 2010, and the least - 4 in 2011. The data has a declining trend.
 When looking into fire subcategories, the most reports belonged to: Outside Fires (51.9%), and Structure Fires (31.7%).