Estimated zip code population in 2022: 6,089 Zip code population in 2010: 5,046 Zip code population in 2000: 4,479
Houses and condos: 1,749 Renter-occupied apartments: 170
% of renters here:
10%
State:
29%
March 2022 cost of living index in zip code 84339: 88.8 (less than average, U.S. average is 100)
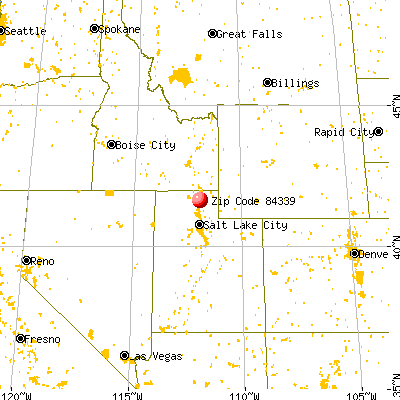
Land area: 56.4 sq. mi. Water area: 0.1 sq. mi.
Population density: 108 people per square mile
(very low).
OSM Map
General Map
Google Map
MSN Map
OSM Map
General Map
Google Map
MSN Map
OSM Map
General Map
Google Map
MSN Map
OSM Map
General Map
Google Map
MSN Map
Please wait while loading the map...
Real estate property taxes paid for housing units in 2022:
This zip code:
0.4% ($1,930)
Utah:
0.5% ($2,376)
Median real estate property taxes paid for housing units with mortgages in 2022: $2,110 (0.4%) Median real estate property taxes paid for housing units with no mortgage in 2022: $1,652 (0.4%)
Estimated median house/condo value in 2022: $440,563
84339:
$440,563
Utah:
$499,500
According to our research of Utah and other state lists, there were 3 registered sex offenders living in 84339 zip code as of May 28, 2024. The ratio of all residents to sex offenders in zip code 84339 is 1,657 to 1. The ratio of registered sex offenders to all residents in this zip code is much lower than the state average.
Median resident age:
This zip code:
30.7 years
Utah median age:
32.1 years
Average household size:
This zip code:
3.5 people
Utah:
3.0 people
Averages for the 2020 tax year for zip code 84339, filed in 2021:
Average Adjusted Gross Income (AGI) in 2020: $96,437 (Individual Income Tax Returns)
Here:
$96,437
State:
$81,660
Salary/wage: $65,733 (reported on 86.4% of returns)
Here:
$65,733
State:
$63,027
(% of AGI for various income ranges: 1231.7% for AGIs below $25k, 3891.7% for AGIs $25k-50k, 6767.4% for AGIs $50k-75k, 9120.0% for AGIs $75k-100k, 16673.0% for AGIs $100k-200k, 75380.0% for AGIs over 200k)
Taxable interest for individuals: $1,562 (reported on 35.4% of returns)
This zip code:
$1,562
Utah:
$2,255
(% of AGI for various income ranges: 18.8% for AGIs below $25k, 19.1% for AGIs $25k-50k, 35.2% for AGIs $50k-75k, 46.8% for AGIs $75k-100k, 122.7% for AGIs $100k-200k, 1550.0% for AGIs over 200k)
Ordinary dividends: $3,653 (reported on 17.7% of returns)
Here:
$3,653
State:
$7,362
(% of AGI for various income ranges: 7.3% for AGIs below $25k, 24.9% for AGIs $25k-50k, 33.7% for AGIs $50k-75k, 92.3% for AGIs $75k-100k, 99.7% for AGIs $100k-200k, 2140.0% for AGIs over 200k)
Net capital gain/loss in AGI: +$30,054 (reported on 19.8% of returns)
Here:
+$30,054
State:
+$43,433
(% of AGI for various income ranges: 8.1% for AGIs below $25k, 46.0% for AGIs $25k-50k, 119.6% for AGIs $50k-75k, 299.1% for AGIs $75k-100k, 482.3% for AGIs $100k-200k, 29495.0% for AGIs over 200k)
Profit/loss from business: +$6,395 (reported on 16.9% of returns)
Here:
+$6,395
State:
+$9,957
(% of AGI for various income ranges: 102.5% for AGIs below $25k, 133.1% for AGIs $25k-50k, 120.7% for AGIs $50k-75k, 109.5% for AGIs $75k-100k, 257.3% for AGIs $100k-200k, 812.5% for AGIs over 200k)
Taxable individual retirement arrangement distribution: $18,922 (reported on 9.5% of returns)
84339:
$18,922
Utah:
$21,167
(% of AGI for various income ranges: 52.3% for AGIs below $25k, 169.7% for AGIs $25k-50k, 191.1% for AGIs $50k-75k, 399.5% for AGIs $75k-100k, 704.0% for AGIs $100k-200k)
Total itemized deductions: $42,692 (reported on 15.2% of returns)
Here:
$42,692
State:
$41,056
(% of AGI for various income ranges: 145.6% for AGIs below $25k, 210.4% for AGIs $50k-75k, 465.9% for AGIs $75k-100k, 2069.3% for AGIs $100k-200k, 18240.0% for AGIs over 200k)
Charity contributions: $25,668 (reported on 14.0% of returns)
Here:
$25,668
State:
$22,261
(% of AGI for various income ranges: 31.9% for AGIs below $25k, 82.6% for AGIs $50k-75k, 189.5% for AGIs $75k-100k, 955.0% for AGIs $100k-200k, 12672.5% for AGIs over 200k)
Taxes paid: $8,100 (reported on 15.2% of returns)
84339:
$8,100
State:
$7,985
(% of AGI for various income ranges: 20.0% for AGIs below $25k, 40.0% for AGIs $50k-75k, 100.9% for AGIs $75k-100k, 534.7% for AGIs $100k-200k, 2417.5% for AGIs over 200k)
Earned income credit: $2,277 (reported on 9.1% of returns)
Here:
$2,277
State:
$2,169
(% of AGI for various income ranges: 46.2% for AGIs below $25k, 79.7% for AGIs $25k-50k)
Percentage of individuals using paid preparers for their 2020 taxes: 95.1%
Here:
95%
State:
94%
(% for various income ranges: 92.4% for AGIs below $25k, 95.7% for AGIs $25k-50k, 97.4% for AGIs $50k-75k, 93.5% for AGIs $75k-100k, 95.8% for AGIs $100k-200k, 100.0% for AGIs over 200k)
Averages for the 2012 tax year for zip code 84339, filed in 2013:
Average Adjusted Gross Income (AGI) in 2012: $67,572 (Individual Income Tax Returns)
Here:
$67,572
State:
$60,327
Salary/wage: $51,259 (reported on 87.3% of returns)
Here:
$51,259
State:
$48,762
(% of AGI for various income ranges: 79.1% for AGIs below $25k, 79.9% for AGIs $25k-50k, 78.8% for AGIs $50k-75k, 81.9% for AGIs $75k-100k, 76.9% for AGIs $100k-200k, 29.8% for AGIs over 200k)
Taxable interest for individuals: $809 (reported on 44.7% of returns)
This zip code:
$809
Utah:
$1,534
(% of AGI for various income ranges: 1.5% for AGIs below $25k, 0.6% for AGIs $25k-50k, 0.4% for AGIs $50k-75k, 0.4% for AGIs $75k-100k, 0.6% for AGIs $100k-200k, 0.4% for AGIs over 200k)
Ordinary dividends: $1,766 (reported on 14.7% of returns)
Here:
$1,766
State:
$5,711
(% of AGI for various income ranges: 0.6% for AGIs below $25k, 0.8% for AGIs $25k-50k, 0.3% for AGIs $50k-75k, 0.5% for AGIs $75k-100k, 0.4% for AGIs $100k-200k, 0.1% for AGIs over 200k)
Net capital gain/loss in AGI: +$18,093 (reported on 13.7% of returns)
Here:
+$18,093
State:
+$23,734
(% of AGI for various income ranges: 1.1% for AGIs below $25k, 0.7% for AGIs $25k-50k, 0.7% for AGIs $50k-75k, 0.5% for AGIs $75k-100k, 0.7% for AGIs $100k-200k, 12.1% for AGIs over 200k)
Profit/loss from business: +$4,675 (reported on 16.2% of returns)
Here:
+$4,675
State:
+$8,845
(% of AGI for various income ranges: 4.6% for AGIs below $25k, 1.9% for AGIs $25k-50k, 1.2% for AGIs $50k-75k, 0.2% for AGIs $75k-100k, 1.9% for AGIs $100k-200k)
Taxable individual retirement arrangement distribution: $14,300 (reported on 9.6% of returns)
84339:
$14,300
Utah:
$15,565
(% of AGI for various income ranges: 2.7% for AGIs below $25k, 2.3% for AGIs $25k-50k, 2.0% for AGIs $50k-75k, 2.6% for AGIs $75k-100k, 3.8% for AGIs $100k-200k)
Total itemized deductions: $25,833 (22% of AGI, reported on 43.1% of returns)
Here:
$25,833
State:
$25,197
Here:
22.3% of AGI
State:
22.4% of AGI
(% of AGI for various income ranges: 6.4% for AGIs below $25k, 12.0% for AGIs $25k-50k, 17.6% for AGIs $50k-75k, 20.4% for AGIs $75k-100k, 20.4% for AGIs $100k-200k, 13.9% for AGIs over 200k)
Charity contributions: $10,301 (reported on 40.1% of returns)
Here:
$10,301
State:
$8,502
(% of AGI for various income ranges: 1.4% for AGIs below $25k, 3.3% for AGIs $25k-50k, 5.8% for AGIs $50k-75k, 7.1% for AGIs $75k-100k, 7.7% for AGIs $100k-200k, 6.5% for AGIs over 200k)
Taxes paid: $6,729 (reported on 43.1% of returns)
84339:
$6,729
State:
$7,001
(% of AGI for various income ranges: 0.9% for AGIs below $25k, 2.0% for AGIs $25k-50k, 3.8% for AGIs $50k-75k, 5.2% for AGIs $75k-100k, 5.3% for AGIs $100k-200k, 4.9% for AGIs over 200k)
Earned income credit: $1,992 (reported on 13.2% of returns)
Here:
$1,992
State:
$2,259
(% of AGI for various income ranges: 3.8% for AGIs below $25k, 1.6% for AGIs $25k-50k)
Percentage of individuals using paid preparers for their 2012 taxes: 58.4%
Here:
58%
State:
51%
(% for various income ranges: 50.8% for AGIs below $25k, 59.1% for AGIs $25k-50k, 61.1% for AGIs $50k-75k, 57.1% for AGIs $75k-100k, 68.2% for AGIs $100k-200k, 83.3% for AGIs over 200k)
Averages for the 2004 tax year for zip code 84339, filed in 2005:
Average Adjusted Gross Income (AGI) in 2004: $42,297 (Individual Income Tax Returns)
Here:
$42,297
State:
$45,498
Salary/wage: $37,499 (reported on 88.2% of returns)
Here:
$37,499
State:
$38,975
(% of AGI for various income ranges: 114.6% for AGIs below $10k, 76.5% for AGIs $10k-25k, 84.7% for AGIs $25k-50k, 82.5% for AGIs $50k-75k, 77.4% for AGIs $75k-100k, 66.1% for AGIs over 100k)
Taxable interest for individuals: $1,198 (reported on 51.7% of returns)
This zip code:
$1,198
Utah:
$1,445
(% of AGI for various income ranges: 3.4% for AGIs below $10k, 2.9% for AGIs $10k-25k, 1.0% for AGIs $25k-50k, 1.3% for AGIs $50k-75k, 1.2% for AGIs $75k-100k, 1.6% for AGIs over 100k)
Taxable dividends: $836 (reported on 18.2% of returns)
Here:
$836
State:
$3,152
(% of AGI for various income ranges: 1.2% for AGIs below $10k, 0.6% for AGIs $10k-25k, 0.4% for AGIs $25k-50k, 0.3% for AGIs $50k-75k, 0.2% for AGIs $75k-100k, 0.4% for AGIs over 100k)
Net capital gain/loss: +$4,727 (reported on 18.3% of returns)
Here:
+$4,727
State:
+$14,059
(% of AGI for various income ranges: 1.7% for AGIs below $10k, 1.0% for AGIs $10k-25k, 0.8% for AGIs $25k-50k, 0.5% for AGIs $50k-75k, 2.3% for AGIs $75k-100k, 5.1% for AGIs over 100k)
Profit/loss from business: +$2,789 (reported on 17.6% of returns)
Here:
+$2,789
State:
+$6,903
(% of AGI for various income ranges: -6.9% for AGIs below $10k, 3.7% for AGIs $10k-25k, 1.2% for AGIs $25k-50k, 1.2% for AGIs $50k-75k, 1.7% for AGIs $75k-100k, 0.4% for AGIs over 100k)
IRA payment deduction: $3,227 (reported on 2.7% of returns)
84339:
$3,227
Utah:
$2,970
Total itemized deductions: $17,983 (26% of AGI, reported on 42.0% of returns)
Here:
$17,983
State:
$20,312
Here:
25.5% of AGI
State:
24.9% of AGI
(% of AGI for various income ranges: 13.0% for AGIs $10k-25k, 14.7% for AGIs $25k-50k, 21.2% for AGIs $50k-75k, 20.6% for AGIs $75k-100k, 18.2% for AGIs over 100k)
Charity contributions deductions: $6,511 (9% of AGI, reported on 38.7% of returns)
Here:
$6,511
State:
$6,250
Here:
9.0% of AGI
State:
7.4% of AGI
(% of AGI for various income ranges: 3.4% for AGIs $10k-25k, 3.7% for AGIs $25k-50k, 7.2% for AGIs $50k-75k, 6.8% for AGIs $75k-100k, 7.4% for AGIs over 100k)
Total tax: $4,451 (reported on 72.7% of returns)
84339:
$4,451
State:
$6,523
(% of AGI for various income ranges: 2.9% for AGIs below $10k, 3.8% for AGIs $10k-25k, 4.5% for AGIs $25k-50k, 5.6% for AGIs $50k-75k, 8.0% for AGIs $75k-100k, 14.4% for AGIs over 100k)
Earned income credit: $1,713 (reported on 11.9% of returns)
Here:
$1,713
State:
$1,703
Percentage of individuals using paid preparers for their 2004 taxes: 60.9%
Here:
61%
State:
53%
(% for various income ranges: 47.9% for AGIs below $10k, 62.1% for AGIs $10k-25k, 65.7% for AGIs $25k-50k, 62.9% for AGIs $50k-75k, 62.5% for AGIs $75k-100k, 70.9% for AGIs over 100k)
Household received Food Stamps/SNAP in the past 12 months: 21 Household did not receive Food Stamps/SNAP in the past 12 months: 1,726
Women who had a birth in the past 12 months: 21 (22 now married, 0 unmarried) Women who did not have a birth in the past 12 months: 1,442 (830 now married, 607 unmarried)
Housing units in zip code 84339 with a mortgage: 1,031 (139 second mortgage, 97 both second mortgage and home equity loan) Houses without a mortgage: 79
Median monthly owner costs for units with a mortgage: $1,599 Median monthly owner costs for units without a mortgage: $441
Residents with income below the poverty level in 2022:
This zip code:
3.6%
Whole state:
8.2%
Residents with income below 50% of the poverty level in 2022:
This zip code:
2.8%
Whole state:
4.3%
Median number of rooms in houses and condos:
Here:
8.3
State:
7.6
Median number of rooms in apartments:
Here:
6.1
State:
4.3
Notable locations in this zip code not listed on our city pages
In group quarters: 26 (-1 institutionalized population)
Size of family households: 608 2-persons, 159 3-persons, 213 4-persons, 285 5-persons, 173 6-persons, 125 7-or-more-persons
Size of nonfamily households: 141 1-person, 20 2-persons
2,077 married couples with children.
59 single-parent households (4 men, 55 women).
96.9% of residents of 84339 zip code speak English at home.
1.2% of residents speak Spanish at home (74% very well, 26% well).
1.3% of residents speak Asian or Pacific Island language at home (100% very well).
Foreign born population: 132 (2.2%) (48.5% of them are naturalized citizens)
This zip code:
2.2%
Whole state:
8.6%
62%Honduras
14%Uruguay
13%El Salvador
1%Malaysia
29%English
9%American
9%European
4%German
3%British
3%Irish
2%Danish
Year of entry for the foreign-born population
162010 or later
352000 to 2009
01990 to 1999
85Before 1990
Facilities with environmental interests located in this zip code:
JENSEN HISTORICAL FARM (4025 S. HIGHWAY 89-91 in WELLSVILLE, UT)
(Integrated Compliance Information System) - ICIS-08-1991-0113, FORMAL ENFORCEMENT ACTION
LLOYD FACER/FORMER A & J EARTH PRODUCTS (NORTH MI. MARKER 3, SR 23 in WELLSVILLE, UT)
AIR MINOR (AIRS/AFS) Business SIC classification: CONSTRUCTION SAND AND GRAVEL
Housing units lacking complete plumbing facilities: 1.4%
76.5%Utility gas
11.3%Bottled, tank, or LP gas
9.2%Electricity
2.0%Fuel oil, kerosene, etc.
0.7%Other fuel
Population in 1990: 2,461. Population change in the 1990s: +2,018 (+82.0%).
Place of birth for U.S.-born residents:
This state: 4,246
Northeast: 246
Midwest: 191
South: 238
West: 1,004
57% of the 84339 zip code residents lived in the same house 5 years ago. Out of people who lived in different houses, 67% lived in this county. Out of people who lived in different counties, 50% lived in Utah.
98% of the 84339 zip code residents lived in the same house 1 year ago. Out of people who lived in different houses, 58% moved from this county. Out of people who lived in different houses, 48% moved from different county within same state. Out of people who lived in different houses, 22% moved from abroad.
Private vs. public school enrollment:
Students in private schools in grades 1 to 8 (elementary and middle school): 91
Here:
7.7%
Utah:
7.2%
Students in private schools in grades 9 to 12 (high school): 22
Here:
3.8%
Utah:
5.3%
Students in private undergraduate colleges: 19
Here:
6.8%
Utah:
26.7%
Occupation by median earnings in the past 12 months ($)
110,599Computer and mathematical occupations
72,122Architecture and engineering occupations
66,314Life, physical, and social science occupations
59,577Community and social service occupations
59,256Construction and extraction occupations
58,693Installation, maintenance, and repair occupations
Companies with federal contracts located in this zip code:
AUTONOMOUS SOLUTIONS INC (1946 S 1600 W in WELLSVILLE, UT; small business) : $3,056,920 in 16 contractsfrom 2002 to 2006
Contracts for Other Research and Development -- Applied Research and Exploratory Development (R&D), Defense Tank - Automotive -- Basic Research (R&D), Other Defense -- Applied Research and Exploratory Development (R&D), Other Research and Development -- Basic Research (R&D), and moreby Army, Navy Signed by year:2000: $0; 2001: $0; 2002: $95,000; 2003: $551,301; 2004: $1,116,422; 2005: $702,490; 2006: $591,707.
Biggest contracts:
$599,090 with Army for Other Research and Development -- Applied Research and Exploratory Development (R&D). Signed on 2004-09-29. Completion date: 2006-12-04.
$431,981, same as above.Signed on 2003-12-04. Completion date: 2005-12-05.
$364,969 with Army for Defense Tank - Automotive -- Basic Research (R&D). Signed on 2006-02-13. Completion date: 2007-05-04.
$364,940, same as above.Signed on 2005-04-29. Completion date: 2007-05-04.
COUNTERMEASURES TACTICAL INSTI (55 EAST MAIN STREET in WELLSVILLE, UT; small business) : $285,809 in 3 contractsfrom 2003 to 2004
$97,500 with Army for Surface Motor Vehicles -- Basic Research (R&D). Taking place in CO. Signed on 2003-10-22. Completion date: 2003-11-06.
$96,809 with Army for Other Education and Training Services. Taking place in IN. Signed on 2004-05-27. Completion date: 2004-06-16.
$91,500 with Army for Invalid code: AS27. Taking place in CO. Signed on 2004-01-04. Completion date: 2003-12-05.
Rex s. richards electrical ( in Wellsville, UT; small business) : $818 in 2 contractsin 2005
$483 with Agricultural Research Service for Maintenance, Repair or Alteration of Real Property -- Government-Owned Contractor-Operated (GOCO) R&D Facilities. Signed on 2005-05-09. Completion date: 2005-06-08.
$335, same as above.Signed on 2005-07-12. Completion date: 2005-07-19.
Top industries in this zip code by the number of employees in 2005:
Construction: New Single-Family Housing Construction (except Operative Builders) (10-19 employees: 2 establishments, 1-4 employees: 9 establishments)
Professional, Scientific, and Technical Services: Research and Development in the Physical, Engineering, and Life Sciences (20-49: 1)
Construction: Commercial and Institutional Building Construction (20-49: 1)
Construction: Poured Concrete Foundation and Structure Contractors (10-19: 1, 5-9: 1, 1-4: 1)
Construction: Painting and Wall Covering Contractors (10-19: 1, 1-4: 2)
Arts, Entertainment, and Recreation: Historical Sites (10-19: 1)
Accommodation and Food Services: Limited-Service Restaurants (10-19: 1)
2002 - 2018 National Fire Incident Reporting System (NFIRS) incidents
According to the data from the years 2002 - 2018 the average number of fires per year is 15. The highest number of fires - 42 took place in 2010, and the least - 1 in 2016. The data has a growing trend.
When looking into fire subcategories, the most incidents belonged to: Outside Fires (35.4%), and Structure Fires (31.5%).
Fire incident types reported to NFIRS in Zip Code 84339


 Nearest zip codes: 84325, 84302, 84326, 84328, 84324, 84321.


 According to the data from the years 2002 - 2018 the average number of fires per year is 15. The highest number of fires - 42 took place in 2010, and the least - 1 in 2016. The data has a growing trend.
 When looking into fire subcategories, the most incidents belonged to: Outside Fires (35.4%), and Structure Fires (31.5%).