Estimated zip code population in 2022: 3,074 Zip code population in 2010: 3,067 Zip code population in 2000: 3,523
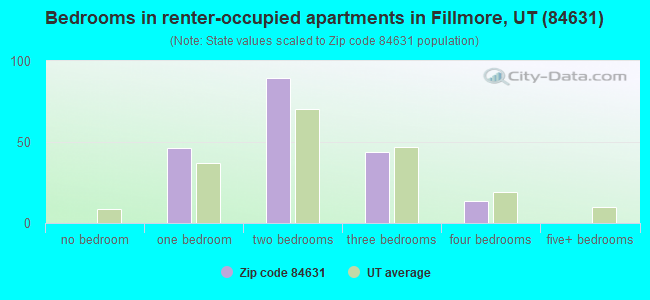
Houses and condos: 1,042 Renter-occupied apartments: 193
% of renters here:
21%
State:
29%
March 2022 cost of living index in zip code 84631: 83.0 (low, U.S. average is 100)
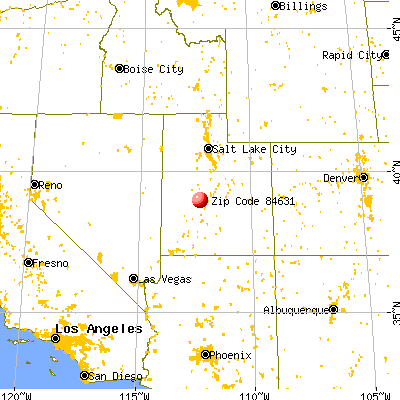
Land area: 165.5 sq. mi. Water area: 0.0 sq. mi.
Population density: 19 people per square mile
(very low).
OSM Map
General Map
Google Map
MSN Map
OSM Map
General Map
Google Map
MSN Map
OSM Map
General Map
Google Map
MSN Map
OSM Map
General Map
Google Map
MSN Map
Please wait while loading the map...
Real estate property taxes paid for housing units in 2022:
This zip code:
0.4% ($1,244)
Utah:
0.5% ($2,376)
Median real estate property taxes paid for housing units with mortgages in 2022: $1,276 (0.4%) Median real estate property taxes paid for housing units with no mortgage in 2022: $1,193 (0.4%)
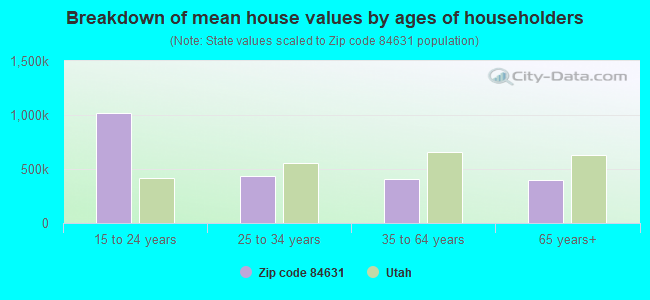
Estimated median house/condo value in 2022: $289,184
84631:
$289,184
Utah:
$499,500
According to our research of Utah and other state lists, there were 9 registered sex offenders living in 84631 zip code as of May 28, 2024. The ratio of all residents to sex offenders in zip code 84631 is 368 to 1. The ratio of registered sex offenders to all residents in this zip code is near the state average.
Median resident age:
This zip code:
36.5 years
Utah median age:
32.1 years
Average household size:
This zip code:
3.3 people
Utah:
3.0 people
Averages for the 2020 tax year for zip code 84631, filed in 2021:
Average Adjusted Gross Income (AGI) in 2020: $54,310 (Individual Income Tax Returns)
Here:
$54,310
State:
$81,660
Salary/wage: $46,377 (reported on 85.2% of returns)
Here:
$46,377
State:
$63,027
(% of AGI for various income ranges: 1412.5% for AGIs below $25k, 4324.4% for AGIs $25k-50k, 6646.1% for AGIs $50k-75k, 9334.0% for AGIs $75k-100k, 17808.6% for AGIs $100k-200k)
Taxable interest for individuals: $1,658 (reported on 24.4% of returns)
This zip code:
$1,658
Utah:
$2,255
(% of AGI for various income ranges: 33.4% for AGIs below $25k, 16.8% for AGIs $25k-50k, 38.3% for AGIs $50k-75k, 30.0% for AGIs $75k-100k, 228.6% for AGIs $100k-200k)
Ordinary dividends: $2,273 (reported on 8.1% of returns)
Here:
$2,273
State:
$7,362
(% of AGI for various income ranges: 21.2% for AGIs $25k-50k, 12.2% for AGIs $50k-75k, 250.0% for AGIs $100k-200k)
Net capital gain/loss in AGI: +$13,807 (reported on 11.1% of returns)
Here:
+$13,807
State:
+$43,433
(% of AGI for various income ranges: 5.0% for AGIs below $25k, 17.2% for AGIs $25k-50k, 95.6% for AGIs $50k-75k, 2628.6% for AGIs $100k-200k)
Profit/loss from business: +$6,319 (reported on 15.6% of returns)
Here:
+$6,319
State:
+$9,957
(% of AGI for various income ranges: 68.8% for AGIs below $25k, 122.0% for AGIs $25k-50k, 150.6% for AGIs $50k-75k, 41.0% for AGIs $75k-100k, 700.0% for AGIs $100k-200k)
Taxable individual retirement arrangement distribution: $9,500 (reported on 6.7% of returns)
84631:
$9,500
Utah:
$21,167
(% of AGI for various income ranges: 146.4% for AGIs $25k-50k, 489.0% for AGIs $75k-100k)
Total itemized deductions: $34,290 (reported on 7.4% of returns)
Here:
$34,290
State:
$41,056
(% of AGI for various income ranges: 474.4% for AGIs $50k-75k, 623.0% for AGIs $75k-100k, 2788.6% for AGIs $100k-200k)
Charity contributions: $17,111 (reported on 6.7% of returns)
Here:
$17,111
State:
$22,261
(% of AGI for various income ranges: 243.3% for AGIs $50k-75k, 1574.3% for AGIs $100k-200k)
Taxes paid: $6,850 (reported on 7.4% of returns)
84631:
$6,850
State:
$7,985
(% of AGI for various income ranges: 58.9% for AGIs $50k-75k, 118.0% for AGIs $75k-100k, 658.6% for AGIs $100k-200k)
Earned income credit: $2,432 (reported on 16.3% of returns)
Here:
$2,432
State:
$2,169
(% of AGI for various income ranges: 88.8% for AGIs below $25k, 100.4% for AGIs $25k-50k)
Percentage of individuals using paid preparers for their 2020 taxes: 93.3%
Here:
93%
State:
94%
(% for various income ranges: 91.1% for AGIs below $25k, 94.1% for AGIs $25k-50k, 96.0% for AGIs $50k-75k, 93.3% for AGIs $75k-100k, 92.3% for AGIs $100k-200k, 100.0% for AGIs over 200k)
Averages for the 2012 tax year for zip code 84631, filed in 2013:
Average Adjusted Gross Income (AGI) in 2012: $44,721 (Individual Income Tax Returns)
Here:
$44,721
State:
$60,327
Salary/wage: $37,038 (reported on 88.0% of returns)
Here:
$37,038
State:
$48,762
(% of AGI for various income ranges: 79.6% for AGIs below $25k, 82.4% for AGIs $25k-50k, 78.6% for AGIs $50k-75k, 76.6% for AGIs $75k-100k, 55.8% for AGIs $100k-200k)
Taxable interest for individuals: $985 (reported on 33.3% of returns)
This zip code:
$985
Utah:
$1,534
(% of AGI for various income ranges: 1.0% for AGIs below $25k, 0.6% for AGIs $25k-50k, 0.2% for AGIs $50k-75k, 0.3% for AGIs $75k-100k, 1.5% for AGIs $100k-200k)
Ordinary dividends: $1,542 (reported on 10.3% of returns)
Here:
$1,542
State:
$5,711
(% of AGI for various income ranges: 0.9% for AGIs below $25k, 0.2% for AGIs $25k-50k, 0.3% for AGIs $50k-75k, 0.6% for AGIs $100k-200k)
Net capital gain/loss in AGI: +$4,710 (reported on 8.5% of returns)
Here:
+$4,710
State:
+$23,734
(% of AGI for various income ranges: 0.4% for AGIs $25k-50k, 3.2% for AGIs $100k-200k)
Profit/loss from business: +$4,515 (reported on 17.1% of returns)
Here:
+$4,515
State:
+$8,845
(% of AGI for various income ranges: 6.1% for AGIs below $25k, 2.0% for AGIs $25k-50k, 1.3% for AGIs $50k-75k, 1.3% for AGIs $100k-200k)
Taxable individual retirement arrangement distribution: $7,788 (reported on 6.8% of returns)
84631:
$7,788
Utah:
$15,565
Total itemized deductions: $20,071 (25% of AGI, reported on 29.1% of returns)
Here:
$20,071
State:
$25,197
Here:
25.1% of AGI
State:
22.4% of AGI
(% of AGI for various income ranges: 9.5% for AGIs below $25k, 9.6% for AGIs $25k-50k, 13.5% for AGIs $50k-75k, 14.1% for AGIs $75k-100k, 15.9% for AGIs $100k-200k)
Charity contributions: $7,693 (reported on 25.6% of returns)
Here:
$7,693
State:
$8,502
(% of AGI for various income ranges: 1.6% for AGIs below $25k, 2.3% for AGIs $25k-50k, 4.2% for AGIs $50k-75k, 5.1% for AGIs $75k-100k, 6.8% for AGIs $100k-200k)
Taxes paid: $4,765 (reported on 29.1% of returns)
84631:
$4,765
State:
$7,001
(% of AGI for various income ranges: 1.0% for AGIs below $25k, 1.8% for AGIs $25k-50k, 2.6% for AGIs $50k-75k, 3.5% for AGIs $75k-100k, 5.1% for AGIs $100k-200k)
Earned income credit: $2,130 (reported on 19.7% of returns)
Here:
$2,130
State:
$2,259
(% of AGI for various income ranges: 5.8% for AGIs below $25k, 1.5% for AGIs $25k-50k)
Percentage of individuals using paid preparers for their 2012 taxes: 64.1%
Here:
64%
State:
51%
(% for various income ranges: 61.2% for AGIs below $25k, 66.7% for AGIs $25k-50k, 68.2% for AGIs $50k-75k, 60.0% for AGIs $75k-100k, 66.7% for AGIs $100k-200k)
Averages for the 2004 tax year for zip code 84631, filed in 2005:
Average Adjusted Gross Income (AGI) in 2004: $33,740 (Individual Income Tax Returns)
Here:
$33,740
State:
$45,498
Salary/wage: $31,559 (reported on 87.5% of returns)
Here:
$31,559
State:
$38,975
(% of AGI for various income ranges: 181.2% for AGIs below $10k, 80.2% for AGIs $10k-25k, 83.8% for AGIs $25k-50k, 81.1% for AGIs $50k-75k, 84.3% for AGIs $75k-100k, 63.7% for AGIs over 100k)
Taxable interest for individuals: $1,396 (reported on 44.4% of returns)
This zip code:
$1,396
Utah:
$1,445
(% of AGI for various income ranges: 11.3% for AGIs below $10k, 3.3% for AGIs $10k-25k, 1.6% for AGIs $25k-50k, 1.0% for AGIs $50k-75k, 0.4% for AGIs $75k-100k, 2.9% for AGIs over 100k)
Taxable dividends: $1,342 (reported on 11.0% of returns)
Here:
$1,342
State:
$3,152
(% of AGI for various income ranges: 1.5% for AGIs below $10k, 0.9% for AGIs $10k-25k, 0.1% for AGIs $25k-50k, 0.2% for AGIs $50k-75k, 1.5% for AGIs over 100k)
Net capital gain/loss: +$5,699 (reported on 11.9% of returns)
Here:
+$5,699
State:
+$14,059
(% of AGI for various income ranges: -0.9% for AGIs below $10k, 1.1% for AGIs $10k-25k, 0.3% for AGIs $25k-50k, 0.6% for AGIs $50k-75k, -0.0% for AGIs $75k-100k, 12.2% for AGIs over 100k)
Profit/loss from business: +$1,281 (reported on 16.1% of returns)
Here:
+$1,281
State:
+$6,903
(% of AGI for various income ranges: 5.8% for AGIs below $10k, -1.4% for AGIs $10k-25k, 1.6% for AGIs $25k-50k, 0.3% for AGIs $50k-75k, 0.8% for AGIs $75k-100k)
IRA payment deduction: $1,909 (reported on 1.1% of returns)
84631:
$1,909
Utah:
$2,970
Total itemized deductions: $16,500 (27% of AGI, reported on 27.8% of returns)
Here:
$16,500
State:
$20,312
Here:
26.7% of AGI
State:
24.9% of AGI
(% of AGI for various income ranges: 7.3% for AGIs $10k-25k, 12.4% for AGIs $25k-50k, 16.4% for AGIs $50k-75k, 16.8% for AGIs $75k-100k, 14.4% for AGIs over 100k)
Charity contributions deductions: $5,897 (9% of AGI, reported on 26.3% of returns)
Here:
$5,897
State:
$6,250
Here:
9.4% of AGI
State:
7.4% of AGI
(% of AGI for various income ranges: 2.3% for AGIs $10k-25k, 3.7% for AGIs $25k-50k, 5.2% for AGIs $50k-75k, 5.9% for AGIs $75k-100k, 6.7% for AGIs over 100k)
Total tax: $3,585 (reported on 64.6% of returns)
84631:
$3,585
State:
$6,523
(% of AGI for various income ranges: 4.3% for AGIs below $10k, 3.3% for AGIs $10k-25k, 4.5% for AGIs $25k-50k, 6.3% for AGIs $50k-75k, 8.9% for AGIs $75k-100k, 15.0% for AGIs over 100k)
Earned income credit: $1,436 (reported on 17.5% of returns)
Here:
$1,436
State:
$1,703
Percentage of individuals using paid preparers for their 2004 taxes: 58.8%
Here:
59%
State:
53%
(% for various income ranges: 55.6% for AGIs below $10k, 61.7% for AGIs $10k-25k, 58.2% for AGIs $25k-50k, 57.6% for AGIs $50k-75k, 58.9% for AGIs $75k-100k, 73.3% for AGIs over 100k)
Household received Food Stamps/SNAP in the past 12 months: 28 Household did not receive Food Stamps/SNAP in the past 12 months: 897
Women who had a birth in the past 12 months: 39 (40 now married, 0 unmarried) Women who did not have a birth in the past 12 months: 640 (225 now married, 417 unmarried)
Housing units in zip code 84631 with a mortgage: 356 (16 second mortgage, 18 both second mortgage and home equity loan) Median monthly owner costs for units with a mortgage: $1,363 Median monthly owner costs for units without a mortgage: $326
Residents with income below the poverty level in 2022:
This zip code:
7.3%
Whole state:
8.2%
Residents with income below 50% of the poverty level in 2022:
This zip code:
5.6%
Whole state:
4.3%
Median number of rooms in houses and condos:
Here:
7.6
State:
7.6
Median number of rooms in apartments:
Here:
4.2
State:
4.3
Notable locations in this zip code not listed on our city pages
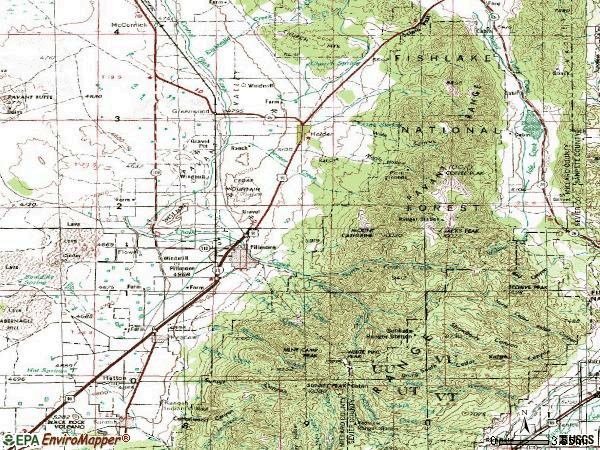
Notable locations in zip code 84631: Meadow Creek Campground (A), Wagons West RV Campground (B), Old State Capitol (C), Fillmore Fire Department (D), Meadow Fire Department (E). Display/hide their locations on the map
Parks in zip code 84631 include: Black Cedar Hill Wildlife Management Area (1), Kanosh Wildlife Management Area (2). Display/hide their locations on the map
In group quarters: 58 (-1 institutionalized population)
Size of family households: 316 2-persons, 118 3-persons, 78 4-persons, 41 5-persons, 127 6-persons, 57 7-or-more-persons
Size of nonfamily households: 173 1-person, 4 2-persons
722 married couples with children.
115 single-parent households (63 men, 52 women).
80.2% of residents of 84631 zip code speak English at home.
16.4% of residents speak Spanish at home (25% very well, 22% well, 27% not well, 26% not at all).
0.5% of residents speak other Indo-European language at home (100% very well).
3.6% of residents speak Asian or Pacific Island language at home (80% very well, 20% well).
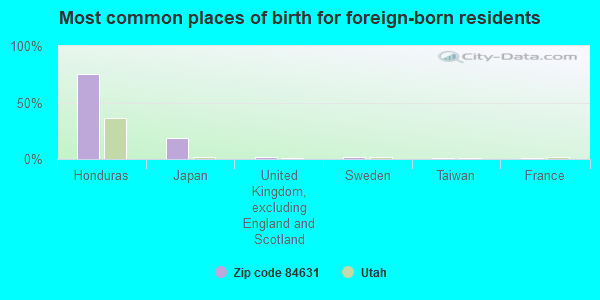
Foreign born population: 444 (14.4%) (32.7% of them are naturalized citizens)
This zip code:
14.4%
Whole state:
8.6%
75%Honduras
19%Japan
2%United Kingdom, excluding England and Scotland
1%Sweden
1%Taiwan
1%France
0%Germany
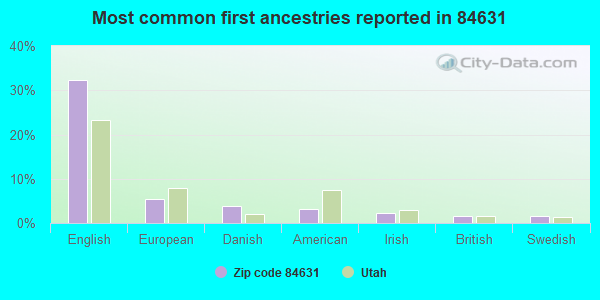
32%English
5%European
4%Danish
3%American
2%Irish
2%British
2%Swedish
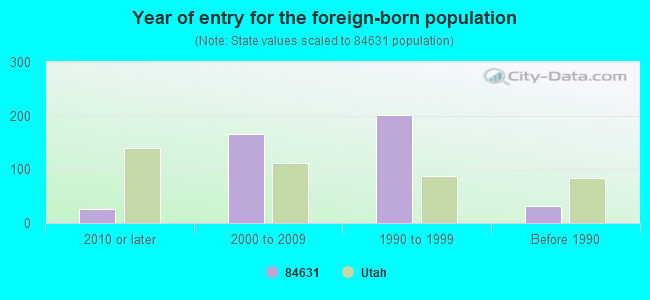
Year of entry for the foreign-born population
262010 or later
1652000 to 2009
2011990 to 1999
32Before 1990
Facilities with environmental interests located in this zip code:
MILLARD HIGH SCHOOL (200 WEST EAGLE AVENUE in FILLMORE, UT)
AIR MINOR (AIRS/AFS) STATE MASTER (Utah compliance and permitting operations) - AQ CORE-1, , UST DATABASE-4, UNDERGROUND STORAGE TANK PROGRAM (National Center for Education Statistics) - STATE ID-17 708 Business SIC classification: COLLEGES, UNIVERSITIES, AND PROFESSIONAL SCHOOLS Organizations: MILLARD SCHOOL DISTRICT (SCHOOL DISTRICT)
FLOWELL ELECTRIC ASSOCIATION INCORPORATED (495 NORTH 3200 WEST in FILLMORE, UT)
STATE MASTER (Utah compliance and permitting operations) - UST DATABASE-4, UNDERGROUND STORAGE TANK PROGRAM (Integrated Compliance Information System) - ICIS-08-1987-0159, FORMAL ENFORCEMENT ACTION COMPLIANCE ACTIVITY (Tracking inspections of insecticide, fungicide, and rodenticide, and toxic substances) Business SIC classification: ELECTRIC SERVICES
FILLMORE MIDDLE (435 S 500 W in FILLMORE, UT)
COMPLIANCE ACTIVITY (Tracking inspections of insecticide, fungicide, and rodenticide, and toxic substances) (National Center for Education Statistics) - STATE ID-17 320 Organizations: MILLARD SCHOOL DISTRICT (SCHOOL DISTRICT)
Alternative names: FILLMORE MIDDLE SCHOOL
FILLMORE ELEM SCH (555 W 400 S in FILLMORE, UT)
(National Center for Education Statistics) - STATE ID-17 112 Organizations: MILLARD SCHOOL DISTRICT (SCHOOL DISTRICT)
KERN RIVER GAS TRANSMISSION COMPANY (15 MILES SOUTH OF FILLMORE in HATTON OFF HWY. 133, UT)
AIR MINOR (AIRS/AFS) Business SIC classification: NATURAL GAS TRANSMISSION
MILLARD HIGH SCHOOL (200 W. CENTER in FILLMORE, UT)
COMPLIANCE ACTIVITY (Tracking inspections of insecticide, fungicide, and rodenticide, and toxic substances)
Housing units lacking complete plumbing facilities: 3.6% Housing units lacking complete kitchen facilities: 4.3%
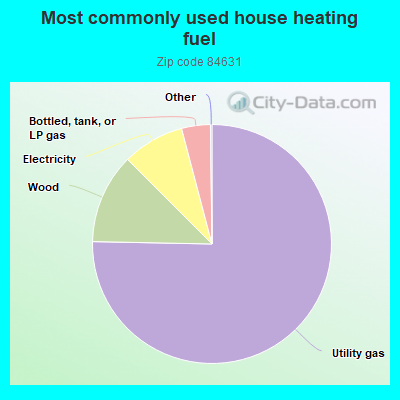
75.4%Utility gas
12.2%Wood
8.4%Electricity
3.9%Bottled, tank, or LP gas
Population in 1990: 3,930.
Place of birth for U.S.-born residents:
This state: 1,948
Northeast: 21
Midwest: 92
South: 40
West: 529
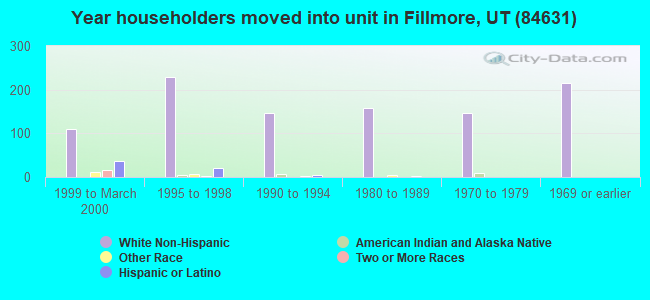
65% of the 84631 zip code residents lived in the same house 5 years ago. Out of people who lived in different houses, 46% lived in this county. Out of people who lived in different counties, 50% lived in Utah.
91% of the 84631 zip code residents lived in the same house 1 year ago. Out of people who lived in different houses, 53% moved from this county. Out of people who lived in different houses, 10% moved from different county within same state. Out of people who lived in different houses, 36% moved from different state.
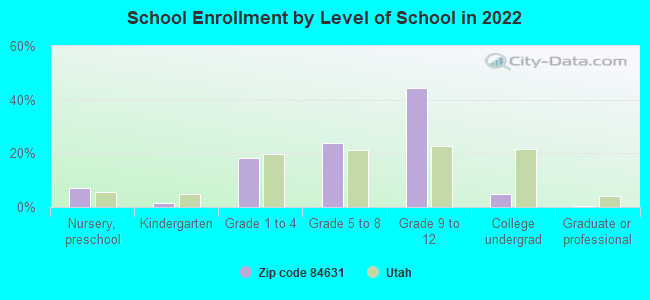
Private vs. public school enrollment:
Students in private schools in grades 1 to 8 (elementary and middle school): 14
Here:
3.4%
Utah:
7.2%
Students in private schools in grades 9 to 12 (high school):
Here:
0.0%
Utah:
5.3%
Students in private undergraduate colleges: 12
Here:
25.5%
Utah:
26.7%
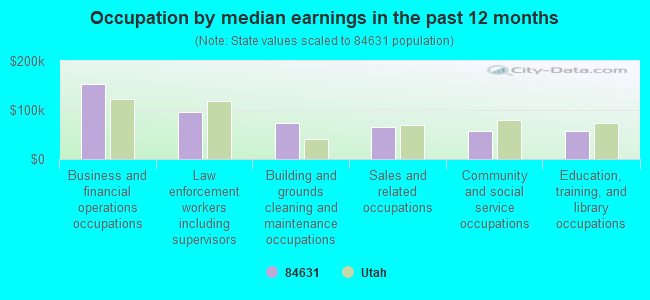
Occupation by median earnings in the past 12 months ($)
153,294Business and financial operations occupations
96,704Law enforcement workers including supervisors
73,174Building and grounds cleaning and maintenance occupations
64,917Sales and related occupations
57,854Community and social service occupations
56,838Education, training, and library occupations
Top industries in this zip code by the number of employees in 2005:
Professional, Scientific, and Technical Services: Engineering Services (50-99: 1)
Health Care and Social Assistance: General Medical and Surgical Hospitals (50-99: 1)
Accommodation and Food Services: Hotels (except Casino Hotels) and Motels (20-49: 1, 10-19: 1)
Accommodation and Food Services: Full-Service Restaurants (20-49: 1)
Mining: All Other Nonmetallic Mineral Mining (10-19: 1)
People in group quarters in 2010:
18 people in local jails and other municipal confinement facilities
11 people in nursing facilities/skilled-nursing facilities
4 people in workers' group living quarters and job corps centers
People in group quarters in 2000:
86 people in local jails and other confinement facilities (including police lockups)
13 people in hospitals/wards and hospices for chronically ill
13 people in other hospitals or wards for chronically ill
Fatal accident statistics in 2014:
Fatal accident count: 1
Vehicles involved in fatal accidents: 1
Fatal accidents caused by drunken drivers: 0
Fatalities: 1
Persons involved in fatal accidents: 2
Pedestrians involved in fatal accidents: 0
Fatal accident statistics in 2013:
Fatal accident count: 1
Vehicles involved in fatal accidents: 1
Fatal accidents caused by drunken drivers: 0
Fatalities: 1
Persons involved in fatal accidents: 1
Pedestrians involved in fatal accidents: 0
2002 - 2018 National Fire Incident Reporting System (NFIRS) incidents
Based on the data from the years 2002 - 2018 the average number of fires per year is 11. The highest number of reported fires - 38 took place in 2018, and the least - 0 in 2009. The data has a rising trend.
When looking into fire subcategories, the most reports belonged to: Outside Fires (55.2%), and Structure Fires (24.3%).
Fire incident types reported to NFIRS in Zip Code 84631


 Nearest zip codes: 84636, 84637, 84656, 84724, 84739, 84766.


 Based on the data from the years 2002 - 2018 the average number of fires per year is 11. The highest number of reported fires - 38 took place in 2018, and the least - 0 in 2009. The data has a rising trend.
 When looking into fire subcategories, the most reports belonged to: Outside Fires (55.2%), and Structure Fires (24.3%).