Estimated zip code population in 2022: 564 Zip code population in 2010: 790 Zip code population in 2000: 852
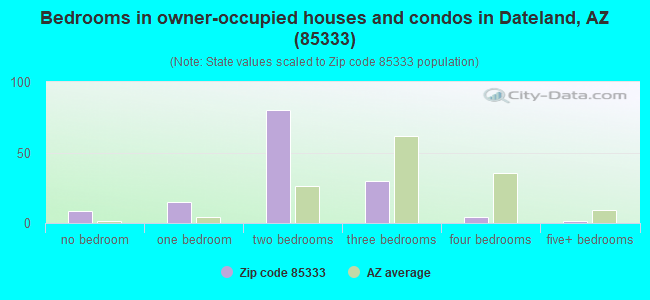
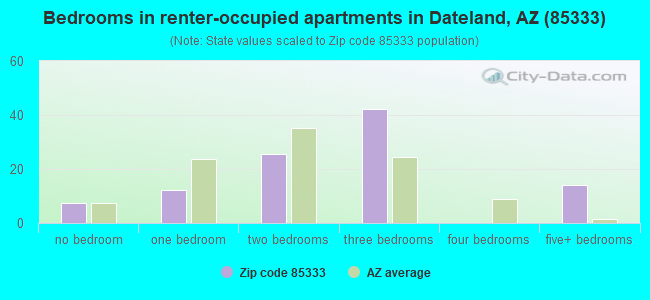
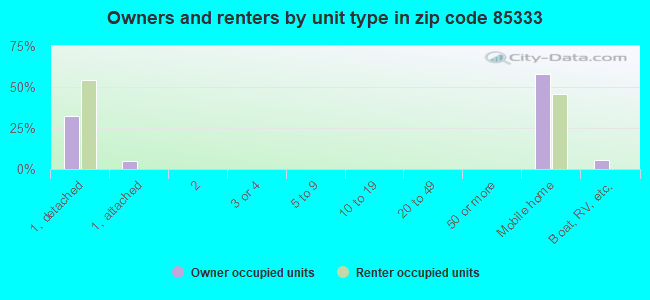
Houses and condos: 367 Renter-occupied apartments: 100
% of renters here:
42%
State:
33%
March 2022 cost of living index in zip code 85333: 91.9 (less than average, U.S. average is 100)
Land area: 724.5 sq. mi. Water area: 0.1 sq. mi.
Population density: 0.778 people per square mile
(very low).
OSM Map
General Map
Google Map
MSN Map
OSM Map
General Map
Google Map
MSN Map
OSM Map
General Map
Google Map
MSN Map
OSM Map
General Map
Google Map
MSN Map
Please wait while loading the map...
Real estate property taxes paid for housing units in 2022:
This zip code:
0.3% ($571)
Arizona:
0.4% ($1,786)
Median real estate property taxes paid for housing units with mortgages in 2022: $800 (0.3%) Median real estate property taxes paid for housing units with no mortgage in 2022: $263 (0.2%)
Business Search- 14 Million verified businesses
Males: 241
(42.9%)
Females: 322
(57.1%)
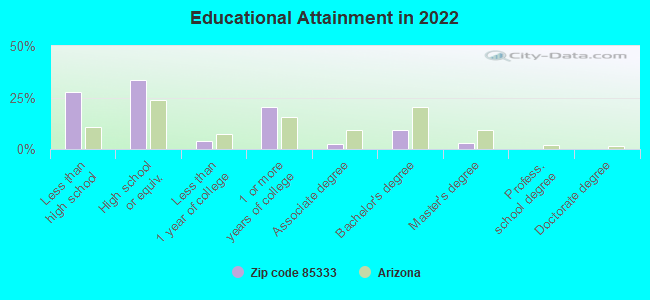
For population 25 years and over in 85333:
High school or higher: 71.5%
Bachelor's degree or higher: 12.5%
Graduate or professional degree: 3.2%
Unemployed: 0.7%
Mean travel time to work (commute): 27.1 minutes
For population 15 years and over in 85333:
Never married: 16.7%
Now married: 50.7%
Separated: 3.1%
Widowed: 20.0%
Divorced: 9.6%
Zip code 85333 compared to state average:
Median house value below state average.
Unemployed percentage significantly below state average.
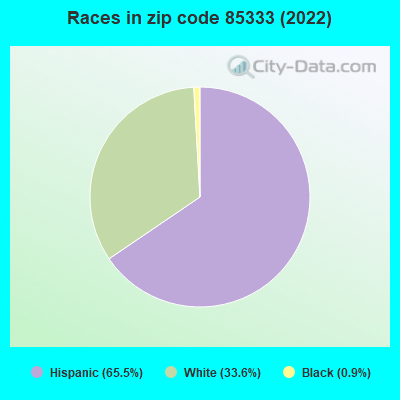
Black race population percentage significantly below state average.
Hispanic race population percentage above state average.
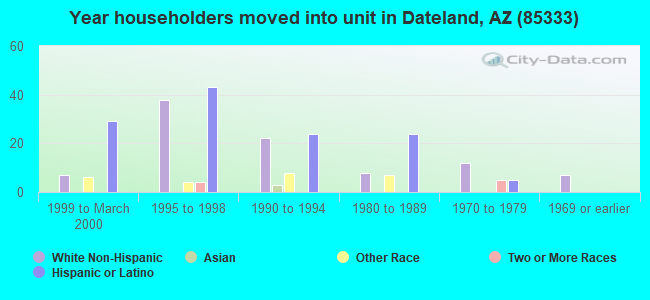
Length of stay since moving in significantly above state average.
Number of rooms per house below state average.
Percentage of population with a bachelor's degree or higher significantly below state average.
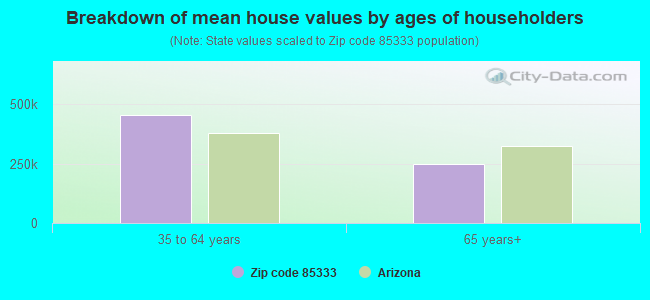
Estimated median house/condo value in 2022: $227,217
85333:
$227,217
Arizona:
$402,800
According to our research of Arizona and other state lists, there was 1 registered sex offender living in 85333 zip code as of May 28, 2024. The ratio of all residents to sex offenders in zip code 85333 is 596 to 1. The ratio of registered sex offenders to all residents in this zip code is near the state average.
Median resident age:
This zip code:
40.5 years
Arizona median age:
38.8 years
Average household size:
This zip code:
2.4 people
Arizona:
2.5 people
Averages for the 2020 tax year for zip code 85333, filed in 2021:
Average Adjusted Gross Income (AGI) in 2020: $35,028 (Individual Income Tax Returns)
Here:
$35,028
State:
$73,499
Salary/wage: $31,167 (reported on 83.3% of returns)
Here:
$31,167
State:
$59,499
(% of AGI for various income ranges: 1492.0% for AGIs below $25k, 5357.5% for AGIs $25k-50k, 8930.0% for AGIs $50k-75k)
Earned income credit: $2,367 (reported on 33.3% of returns)
Here:
$2,367
State:
$2,383
(% of AGI for various income ranges: 166.0% for AGIs below $25k, 147.5% for AGIs $25k-50k)
Percentage of individuals using paid preparers for their 2020 taxes: 88.9%
Here:
89%
State:
93%
(% for various income ranges: 85.7% for AGIs below $25k, 85.7% for AGIs $25k-50k, 100.0% for AGIs $50k-75k)
Averages for the 2012 tax year for zip code 85333, filed in 2013:
Average Adjusted Gross Income (AGI) in 2012: $30,959 (Individual Income Tax Returns)
Here:
$30,959
State:
$57,644
Salary/wage: $26,815 (reported on 90.9% of returns)
Here:
$26,815
State:
$47,932
(% of AGI for various income ranges: 77.1% for AGIs below $25k, 89.8% for AGIs $25k-50k, 69.1% for AGIs $50k-75k)
Earned income credit: $2,444 (reported on 40.9% of returns)
Here:
$2,444
State:
$2,432
(% of AGI for various income ranges: 9.7% for AGIs below $25k, 2.4% for AGIs $25k-50k)
Percentage of individuals using paid preparers for their 2012 taxes: 77.3%
Here:
77%
State:
52%
(% for various income ranges: 66.7% for AGIs below $25k, 85.7% for AGIs $25k-50k, 100.0% for AGIs $50k-75k)
Averages for the 2004 tax year for zip code 85333, filed in 2005:
Average Adjusted Gross Income (AGI) in 2004: $21,862 (Individual Income Tax Returns)
Here:
$21,862
State:
$50,097
Salary/wage: $20,041 (reported on 91.9% of returns)
Here:
$20,041
State:
$42,146
(% of AGI for various income ranges: 94.6% for AGIs below $10k, 81.0% for AGIs $10k-25k, 94.0% for AGIs $25k-50k, 67.5% for AGIs $50k-75k)
Taxable interest for individuals: $568 (reported on 17.6% of returns)
This zip code:
$568
Arizona:
$2,374
Profit/loss from business: +$3,286 (reported on 6.7% of returns)
Here:
+$3,286
State:
+$11,088
Total tax: $2,234 (reported on 44.8% of returns)
85333:
$2,234
State:
$8,323
(% of AGI for various income ranges: 1.8% for AGIs below $10k, 2.6% for AGIs $10k-25k, 3.5% for AGIs $25k-50k, 11.1% for AGIs $50k-75k)
Earned income credit: $2,255 (reported on 44.8% of returns)
Here:
$2,255
State:
$1,786
Percentage of individuals using paid preparers for their 2004 taxes: 62.4%
Here:
62%
State:
60%
(% for various income ranges: 54.5% for AGIs below $10k, 57.7% for AGIs $10k-25k, 73.2% for AGIs $25k-50k, 76.9% for AGIs $50k-75k)
Household received Food Stamps/SNAP in the past 12 months: 23 Household did not receive Food Stamps/SNAP in the past 12 months: 216
Women who had a birth in the past 12 months: 30 (23 now married, 6 unmarried) Women who did not have a birth in the past 12 months: 70 (42 now married, 27 unmarried)
Housing units in zip code 85333 with a mortgage: 71 Median monthly owner costs for units with a mortgage: $1,075 Median monthly owner costs for units without a mortgage: $408
Residents with income below the poverty level in 2022:
This zip code:
21.2%
Whole state:
12.5%
Residents with income below 50% of the poverty level in 2022:
This zip code:
12.0%
Whole state:
6.0%
Median number of rooms in houses and condos:
Here:
4.0
State:
6.0
Median number of rooms in apartments:
Here:
4.5
State:
4.1
Notable locations in this zip code not listed on our city pages
Notable locations in zip code 85333: San Bernardino (A), Alpha (B), Horn Cotton Gin (C), White Wing Ranch (D), Ironwood Ranch (E), Jordan Ranch (F), Bunyan Substation (G), Hyder Substation (H), Rest Area Eighty-four T Two (I), Yolo Ranch (J), Horn Railroad Station (K). Display/hide their locations on the map
Size of family households: 64 2-persons, 17 3-persons, 37 4-persons, 13 5-persons, 9 7-or-more-persons
Size of nonfamily households: 87 1-person, 8 2-persons
76 married couples with children.
13 single-parent households (13 women).
55.0% of residents of 85333 zip code speak English at home.
45.7% of residents speak Spanish at home (61% very well, 14% well, 14% not well, 11% not at all).
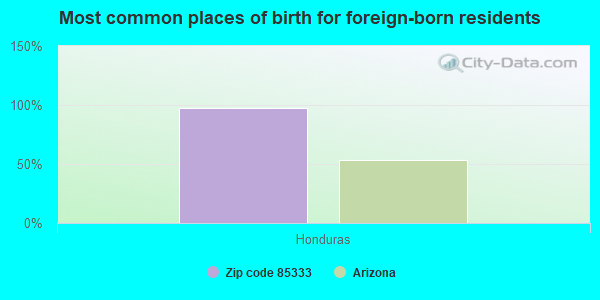
Foreign born population: 87 (15.5%) (25.7% of them are naturalized citizens)
This zip code:
15.5%
Whole state:
13.1%
98%Honduras
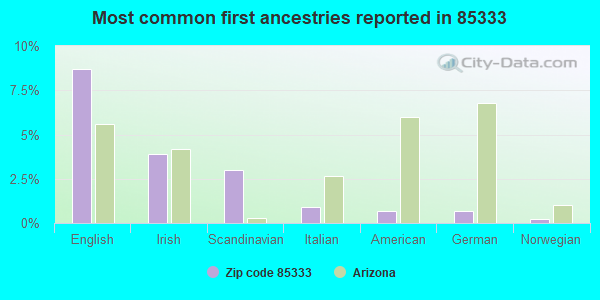
9%English
4%Irish
3%Scandinavian
1%Italian
1%American
1%German
0%Norwegian
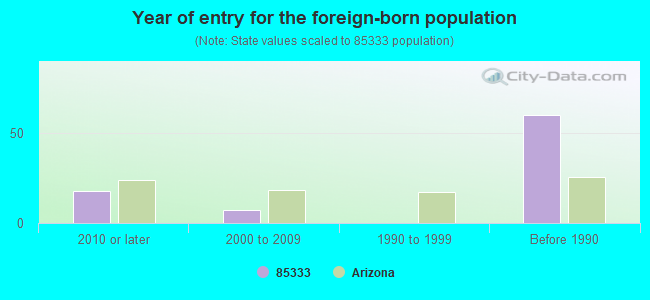
Year of entry for the foreign-born population
182010 or later
72000 to 2009
01990 to 1999
60Before 1990
Public school in in zip code 85333 not listed on the city page:
SENTINEL ELEMENTARY SCHOOL (Location: 53802 OLD U.S. HIGHWAY)
Facilities with environmental interests located in this zip code:
DATELAND ELEMENTARY SCHOOL (AVE 64E & I-8 in DATELAND, AZ)
(National Center for Education Statistics) - STATE ID-101 Organizations: HYDER ELEMENTARY DISTRICT (SCHOOL DISTRICT)
DATELAND UTILITES (PO BOX 57 in DATELAND, AZ)
(Integrated Compliance Information System) - ICIS-09-2000-0092, FORMAL ENFORCEMENT ACTION Business SIC classification: WATER SUPPLY
WESTERN TECHNOLOGIES INC (T4N R20W SE QTR OF NW QTR OF in DATELAND, AZ)
(Resource Conservation and Recovery Act (tracking hazardous waste))
DESERT ART BRONZE FOUNDRY INC (3 MILES NORTH OF HYDER AZ in DATELAND, AZ)
Conditionally Exempt Small Quantity Generators, less than 100 kg/month of hazardous waste (Resource Conservation and Recovery Act (tracking hazardous waste)) - notification Organizations: JACK PRICE (CONTACT/OWNER)
WESTERN ROCK PRODUCTS AZTEC QUARRY (DATELAND RV PARK in DATELAND, AZ)
CRITERIA AND HAZARDOUS AIR POLLUTANT INVENTORY (Inventory of air pollution sources) Business SIC classification: MISCELLANEOUS NONMETALLIC MINERALS, EXCEPT FUELS
Housing units lacking complete plumbing facilities: 7.2% Housing units lacking complete kitchen facilities: 0.7%
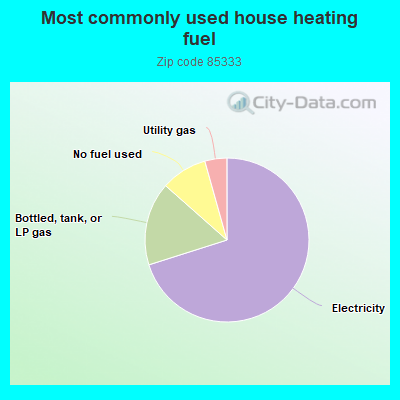
70.8%Electricity
16.6%Bottled, tank, or LP gas
9.2%No fuel used
4.4%Utility gas
Population in 1990: 659. Population change in the 1990s: +193 (+29.3%).
Place of birth for U.S.-born residents:
This state: 327
Northeast: 31
Midwest: 14
South: 28
West: 73
65% of the 85333 zip code residents lived in the same house 5 years ago. Out of people who lived in different houses, 63% lived in this county. Out of people who lived in different counties, 50% lived in Arizona.
99% of the 85333 zip code residents lived in the same house 1 year ago. Out of people who lived in different houses, 200% moved from this county. Out of people who lived in different houses, 150% moved from different state.
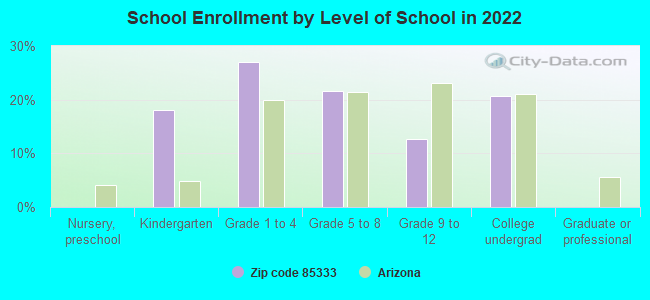
Private vs. public school enrollment:
Students in private schools in grades 1 to 8 (elementary and middle school):
Here:
0.0%
Arizona:
10.4%
Students in private schools in grades 9 to 12 (high school):
Here:
0.0%
Arizona:
8.8%
Students in private undergraduate colleges:
Here:
0.0%
Arizona:
13.1%
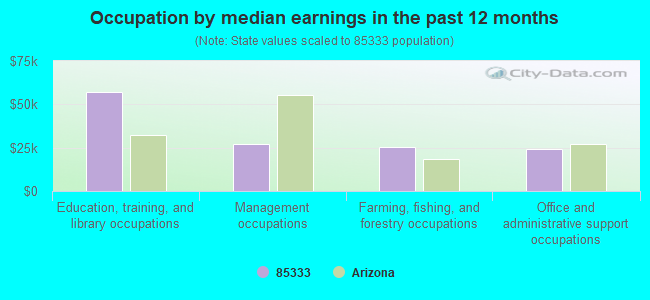
Occupation by median earnings in the past 12 months ($)
57,046Education, training, and library occupations
26,994Management occupations
25,167Farming, fishing, and forestry occupations
23,962Office and administrative support occupations
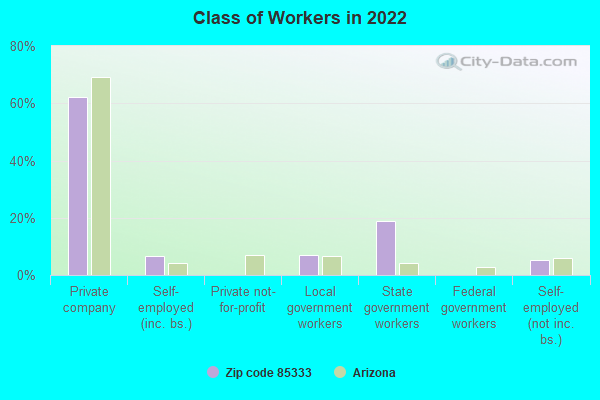
Top industries in this zip code by the number of employees in 2005:
Information: Cellular and Other Wireless Telecommunications (1-4 employees: 1 establishment)
Accommodation and Food Services: Drinking Places (Alcoholic Beverages) (1-4: 1)
People in group quarters in 2010:
5 people in other noninstitutional facilities
People in group quarters in 2000:
74 people in agriculture workers' dormitories on farms
Fatal accident statistics in 2014:
Fatal accident count: 1
Vehicles involved in fatal accidents: 2
Fatal accidents caused by drunken drivers: 0
Fatalities: 1
Persons involved in fatal accidents: 5
Pedestrians involved in fatal accidents: 0
Fatal accident statistics in 2012:
Fatal accident count: 1
Vehicles involved in fatal accidents: 2
Fatal accidents caused by drunken drivers: 0
Fatalities: 1
Persons involved in fatal accidents: 3
Pedestrians involved in fatal accidents: 0
Home Mortgage Disclosure Act Aggregated Statistics For Year 2009 (Based on 2 partial tracts)
C) Refinancings
G) Loans On Manufactured Home Dwelling (A B C & D)
Number
Average Value
Number
Average Value
LOANS ORIGINATED
1
$21,140
1
$21,140
APPLICATIONS APPROVED, NOT ACCEPTED
0
$0
0
$0
APPLICATIONS DENIED
0
$0
0
$0
APPLICATIONS WITHDRAWN
0
$0
0
$0
FILES CLOSED FOR INCOMPLETENESS
0
$0
0
$0
Aggregated Statistics For Year 2008 (Based on 2 partial tracts)
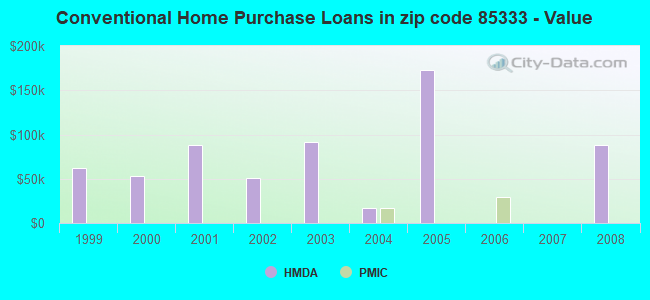
B) Conventional Home Purchase Loans
C) Refinancings
G) Loans On Manufactured Home Dwelling (A B C & D)
Number
Average Value
Number
Average Value
Number
Average Value
LOANS ORIGINATED
2
$88,295
1
$68,180
1
$58,630
APPLICATIONS APPROVED, NOT ACCEPTED
0
$0
0
$0
0
$0
APPLICATIONS DENIED
0
$0
0
$0
0
$0
APPLICATIONS WITHDRAWN
0
$0
0
$0
0
$0
FILES CLOSED FOR INCOMPLETENESS
0
$0
1
$30,000
0
$0
Aggregated Statistics For Year 2007 (Based on 2 partial tracts)
C) Refinancings
D) Home Improvement Loans
G) Loans On Manufactured Home Dwelling (A B C & D)
Number
Average Value
Number
Average Value
Number
Average Value
LOANS ORIGINATED
0
$0
0
$0
0
$0
APPLICATIONS APPROVED, NOT ACCEPTED
1
$63,410
1
$16,360
1
$2,050
APPLICATIONS DENIED
5
$128,860
3
$68,180
6
$91,588
APPLICATIONS WITHDRAWN
0
$0
0
$0
0
$0
FILES CLOSED FOR INCOMPLETENESS
0
$0
0
$0
0
$0
Aggregated Statistics For Year 2006 (Based on 2 partial tracts)
A) FHA, FSA/RHS & VA Home Purchase Loans
B) Conventional Home Purchase Loans
C) Refinancings
D) Home Improvement Loans
F) Non-occupant Loans on < 5 Family Dwellings (A B C & D)
G) Loans On Manufactured Home Dwelling (A B C & D)
Number
Average Value
Number
Average Value
Number
Average Value
Number
Average Value
Number
Average Value
Number
Average Value
LOANS ORIGINATED
1
$89,320
0
$0
2
$96,475
1
$55,230
1
$55,230
1
$89,320
APPLICATIONS APPROVED, NOT ACCEPTED
0
$0
0
$0
0
$0
0
$0
0
$0
0
$0
APPLICATIONS DENIED
0
$0
0
$0
3
$33,637
1
$127,500
0
$0
3
$45,453
APPLICATIONS WITHDRAWN
0
$0
1
$136,360
1
$184,090
1
$102,950
0
$0
0
$0
FILES CLOSED FOR INCOMPLETENESS
0
$0
2
$144,885
0
$0
0
$0
0
$0
0
$0
Aggregated Statistics For Year 2005 (Based on 2 partial tracts)
B) Conventional Home Purchase Loans
C) Refinancings
D) Home Improvement Loans
F) Non-occupant Loans on < 5 Family Dwellings (A B C & D)
G) Loans On Manufactured Home Dwelling (A B C & D)
Number
Average Value
Number
Average Value
Number
Average Value
Number
Average Value
Number
Average Value
LOANS ORIGINATED
1
$173,180
1
$91,360
0
$0
0
$0
0
$0
APPLICATIONS APPROVED, NOT ACCEPTED
3
$80,907
1
$100,910
0
$0
1
$40,910
3
$80,907
APPLICATIONS DENIED
3
$88,407
1
$102,270
1
$27,270
3
$72,953
5
$61,634
APPLICATIONS WITHDRAWN
2
$50,110
1
$98,180
0
$0
1
$36,140
1
$77,040
FILES CLOSED FOR INCOMPLETENESS
0
$0
0
$0
0
$0
0
$0
0
$0
Aggregated Statistics For Year 2004 (Based on 2 partial tracts)
A) FHA, FSA/RHS & VA Home Purchase Loans
B) Conventional Home Purchase Loans
C) Refinancings
G) Loans On Manufactured Home Dwelling (A B C & D)
Number
Average Value
Number
Average Value
Number
Average Value
Number
Average Value
LOANS ORIGINATED
0
$0
1
$17,050
0
$0
0
$0
APPLICATIONS APPROVED, NOT ACCEPTED
0
$0
0
$0
1
$51,820
0
$0
APPLICATIONS DENIED
1
$65,450
1
$90,680
3
$67,953
1
$81,820
APPLICATIONS WITHDRAWN
0
$0
0
$0
0
$0
0
$0
FILES CLOSED FOR INCOMPLETENESS
0
$0
1
$66,820
0
$0
0
$0
Aggregated Statistics For Year 2003 (Based on 2 partial tracts)
A) FHA, FSA/RHS & VA Home Purchase Loans
B) Conventional Home Purchase Loans
C) Refinancings
F) Non-occupant Loans on < 5 Family Dwellings (A B C & D)
Number
Average Value
Number
Average Value
Number
Average Value
Number
Average Value
LOANS ORIGINATED
2
$76,360
2
$92,045
5
$61,090
1
$27,950
APPLICATIONS APPROVED, NOT ACCEPTED
0
$0
1
$64,770
3
$73,633
0
$0
APPLICATIONS DENIED
0
$0
2
$79,770
3
$51,590
0
$0
APPLICATIONS WITHDRAWN
0
$0
1
$90,000
3
$82,270
0
$0
FILES CLOSED FOR INCOMPLETENESS
0
$0
0
$0
0
$0
0
$0
Aggregated Statistics For Year 2002 (Based on 2 partial tracts)
A) FHA, FSA/RHS & VA Home Purchase Loans
B) Conventional Home Purchase Loans
C) Refinancings
D) Home Improvement Loans
F) Non-occupant Loans on < 5 Family Dwellings (A B C & D)
Number
Average Value
Number
Average Value
Number
Average Value
Number
Average Value
Number
Average Value
LOANS ORIGINATED
0
$0
1
$51,140
4
$82,668
0
$0
1
$45,680
APPLICATIONS APPROVED, NOT ACCEPTED
0
$0
1
$49,090
2
$86,250
0
$0
0
$0
APPLICATIONS DENIED
0
$0
0
$0
2
$131,585
1
$10,230
0
$0
APPLICATIONS WITHDRAWN
1
$48,410
0
$0
1
$27,950
0
$0
0
$0
FILES CLOSED FOR INCOMPLETENESS
0
$0
0
$0
0
$0
0
$0
0
$0
Aggregated Statistics For Year 2001 (Based on 2 partial tracts)
B) Conventional Home Purchase Loans
C) Refinancings
D) Home Improvement Loans
F) Non-occupant Loans on < 5 Family Dwellings (A B C & D)
Number
Average Value
Number
Average Value
Number
Average Value
Number
Average Value
LOANS ORIGINATED
4
$87,612
1
$53,180
0
$0
0
$0
APPLICATIONS APPROVED, NOT ACCEPTED
3
$73,863
1
$63,410
1
$26,590
2
$91,020
APPLICATIONS DENIED
1
$66,130
1
$64,770
0
$0
0
$0
APPLICATIONS WITHDRAWN
0
$0
0
$0
0
$0
0
$0
FILES CLOSED FOR INCOMPLETENESS
0
$0
0
$0
0
$0
0
$0
Aggregated Statistics For Year 2000 (Based on 2 partial tracts)
A) FHA, FSA/RHS & VA Home Purchase Loans
B) Conventional Home Purchase Loans
C) Refinancings
D) Home Improvement Loans
F) Non-occupant Loans on < 5 Family Dwellings (A B C & D)
Number
Average Value
Number
Average Value
Number
Average Value
Number
Average Value
Number
Average Value
LOANS ORIGINATED
0
$0
3
$52,953
1
$43,640
0
$0
0
$0
APPLICATIONS APPROVED, NOT ACCEPTED
0
$0
1
$90,680
0
$0
0
$0
0
$0
APPLICATIONS DENIED
1
$66,130
3
$57,953
2
$61,020
1
$7,500
1
$66,820
APPLICATIONS WITHDRAWN
0
$0
1
$95,450
1
$17,050
0
$0
0
$0
FILES CLOSED FOR INCOMPLETENESS
0
$0
1
$57,950
0
$0
0
$0
0
$0
Aggregated Statistics For Year 1999 (Based on 1 partial tract)

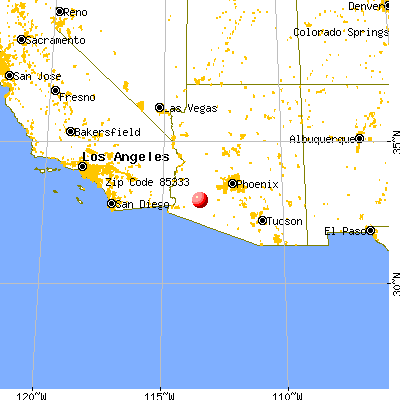


 Nearest zip codes: 85322, 85354, 85347, 85337, 85352, 85343.
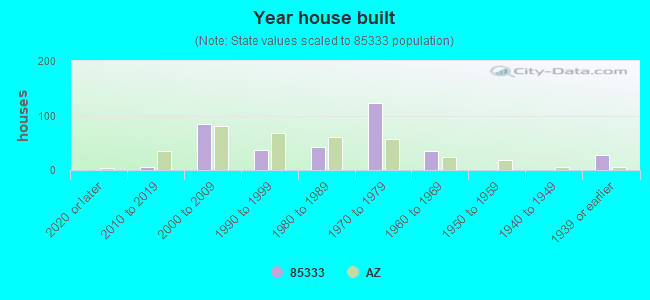


 (Location: 53802 OLD U.S. HIGHWAY)