Estimated zip code population in 2022: 4,631 Zip code population in 2010: 4,735 Zip code population in 2000: 5,320
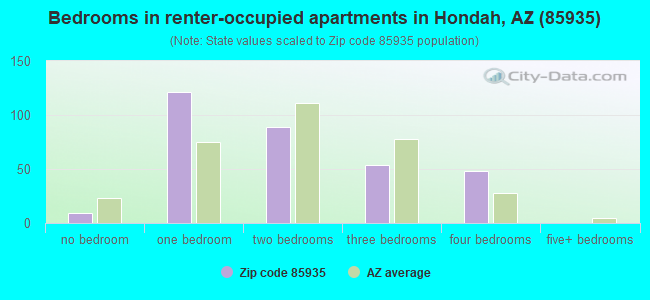
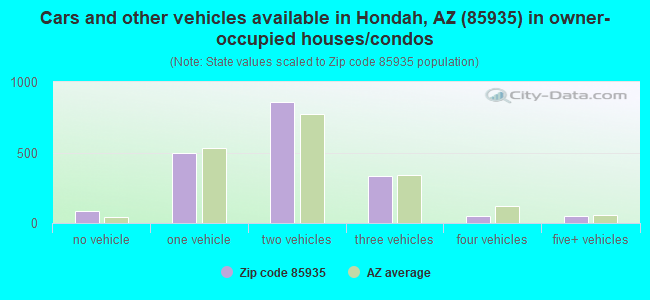
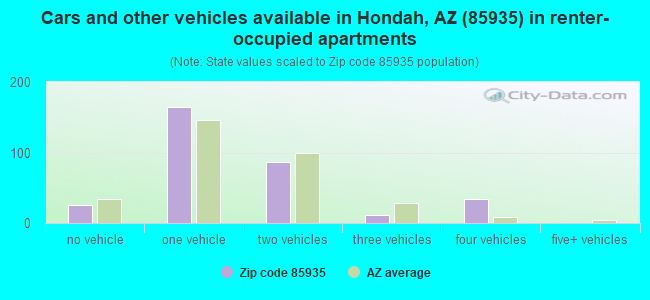
Houses and condos: 5,973 Renter-occupied apartments: 319
% of renters here:
15%
State:
33%
March 2022 cost of living index in zip code 85935: 86.9 (less than average, U.S. average is 100)
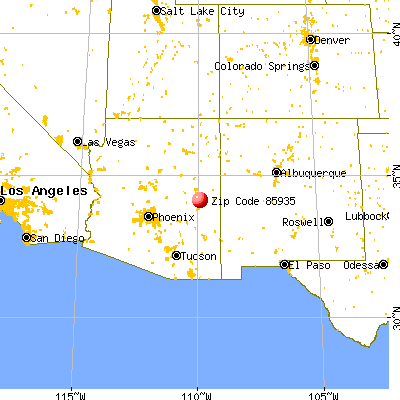
Land area: 48.3 sq. mi. Water area: 0.1 sq. mi.
Population density: 96 people per square mile
(very low).
OSM Map
General Map
Google Map
MSN Map
OSM Map
General Map
Google Map
MSN Map
OSM Map
General Map
Google Map
MSN Map
OSM Map
General Map
Google Map
MSN Map
Please wait while loading the map...
Real estate property taxes paid for housing units in 2022:
This zip code:
0.6% ($2,165)
Arizona:
0.4% ($1,786)
Median real estate property taxes paid for housing units with mortgages in 2022: $1,447 (0.4%) Median real estate property taxes paid for housing units with no mortgage in 2022: $2,594 (0.5%)
Business Search- 14 Million verified businesses
Males: 2,271
(49.0%)
Females: 2,360
(51.0%)
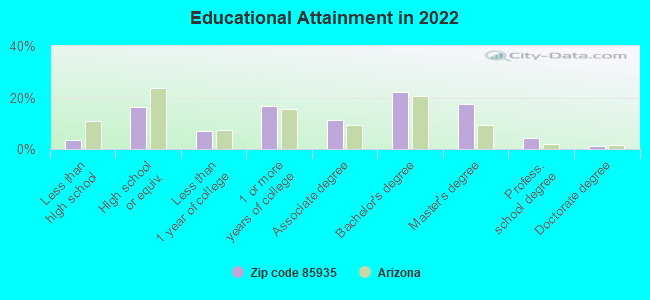
For population 25 years and over in 85935:
High school or higher: 96.7%
Bachelor's degree or higher: 45.3%
Graduate or professional degree: 23.0%
Unemployed: 2.7%
Mean travel time to work (commute): 24.0 minutes
For population 15 years and over in 85935:
Never married: 17.0%
Now married: 65.8%
Separated: 1.5%
Widowed: 4.6%
Divorced: 11.0%
Zip code 85935 compared to state average:
Black race population percentage significantly below state average.
Hispanic race population percentage significantly below state average.
Median age significantly above state average.
Foreign-born population percentage significantly below state average.
Renting percentage below state average.
Length of stay since moving in significantly above state average.
Number of college students below state average.
Percentage of population with a bachelor's degree or higher above state average.
Estimated median house/condo value in 2022: $393,275
85935:
$393,275
Arizona:
$402,800
According to our research of Arizona and other state lists, there were 2 registered sex offenders living in 85935 zip code as of May 28, 2024. The ratio of all residents to sex offenders in zip code 85935 is 2,568 to 1. The ratio of registered sex offenders to all residents in this zip code is much lower than the state average.
Median resident age:
This zip code:
61.1 years
Arizona median age:
38.8 years
Average household size:
This zip code:
2.1 people
Arizona:
2.5 people
Averages for the 2020 tax year for zip code 85935, filed in 2021:
Average Adjusted Gross Income (AGI) in 2020: $77,582 (Individual Income Tax Returns)
Here:
$77,582
State:
$73,499
Salary/wage: $54,637 (reported on 68.2% of returns)
Here:
$54,637
State:
$59,499
(% of AGI for various income ranges: 1240.2% for AGIs below $25k, 3108.2% for AGIs $25k-50k, 5229.4% for AGIs $50k-75k, 8005.5% for AGIs $75k-100k, 16193.1% for AGIs $100k-200k, 49352.5% for AGIs over 200k)
Taxable interest for individuals: $2,541 (reported on 33.2% of returns)
This zip code:
$2,541
Arizona:
$2,325
(% of AGI for various income ranges: 31.9% for AGIs below $25k, 45.6% for AGIs $25k-50k, 64.4% for AGIs $50k-75k, 123.6% for AGIs $75k-100k, 338.8% for AGIs $100k-200k, 1795.0% for AGIs over 200k)
Ordinary dividends: $6,894 (reported on 23.4% of returns)
Here:
$6,894
State:
$8,711
(% of AGI for various income ranges: 61.6% for AGIs below $25k, 64.1% for AGIs $25k-50k, 128.3% for AGIs $50k-75k, 333.6% for AGIs $75k-100k, 675.6% for AGIs $100k-200k, 3212.5% for AGIs over 200k)
Net capital gain/loss in AGI: +$20,378 (reported on 23.4% of returns)
Here:
+$20,378
State:
+$31,332
(% of AGI for various income ranges: 22.3% for AGIs below $25k, 58.5% for AGIs $25k-50k, 169.4% for AGIs $50k-75k, 478.2% for AGIs $75k-100k, 1273.8% for AGIs $100k-200k, 17562.5% for AGIs over 200k)
Profit/loss from business: +$11,384 (reported on 17.3% of returns)
Here:
+$11,384
State:
+$13,214
(% of AGI for various income ranges: 131.4% for AGIs below $25k, 261.8% for AGIs $25k-50k, 114.4% for AGIs $50k-75k, 343.6% for AGIs $75k-100k, 638.8% for AGIs $100k-200k, 2877.5% for AGIs over 200k)
Taxable individual retirement arrangement distribution: $26,135 (reported on 15.9% of returns)
85935:
$26,135
Arizona:
$23,364
(% of AGI for various income ranges: 83.5% for AGIs below $25k, 244.7% for AGIs $25k-50k, 415.0% for AGIs $50k-75k, 1104.5% for AGIs $75k-100k, 2389.4% for AGIs $100k-200k, 4775.0% for AGIs over 200k)
Total itemized deductions: $31,341 (reported on 12.6% of returns)
Here:
$31,341
State:
$36,308
(% of AGI for various income ranges: 171.2% for AGIs below $25k, 432.8% for AGIs $50k-75k, 1052.7% for AGIs $75k-100k, 1950.6% for AGIs $100k-200k, 6670.0% for AGIs over 200k)
Charity contributions: $11,043 (reported on 9.8% of returns)
Here:
$11,043
State:
$11,955
(% of AGI for various income ranges: 92.8% for AGIs $50k-75k, 198.2% for AGIs $75k-100k, 500.0% for AGIs $100k-200k, 2835.0% for AGIs over 200k)
Taxes paid: $6,889 (reported on 12.6% of returns)
85935:
$6,889
State:
$6,820
(% of AGI for various income ranges: 29.5% for AGIs below $25k, 91.1% for AGIs $50k-75k, 205.5% for AGIs $75k-100k, 450.0% for AGIs $100k-200k, 1557.5% for AGIs over 200k)
Earned income credit: $2,482 (reported on 15.4% of returns)
Here:
$2,482
State:
$2,383
(% of AGI for various income ranges: 111.9% for AGIs below $25k, 99.4% for AGIs $25k-50k)
Percentage of individuals using paid preparers for their 2020 taxes: 93.5%
Here:
93%
State:
93%
(% for various income ranges: 89.6% for AGIs below $25k, 95.7% for AGIs $25k-50k, 96.4% for AGIs $50k-75k, 95.2% for AGIs $75k-100k, 94.7% for AGIs $100k-200k, 92.3% for AGIs over 200k)
Averages for the 2012 tax year for zip code 85935, filed in 2013:
Average Adjusted Gross Income (AGI) in 2012: $57,495 (Individual Income Tax Returns)
Here:
$57,495
State:
$57,644
Salary/wage: $44,714 (reported on 73.4% of returns)
Here:
$44,714
State:
$47,932
(% of AGI for various income ranges: 66.3% for AGIs below $25k, 65.8% for AGIs $25k-50k, 58.0% for AGIs $50k-75k, 61.6% for AGIs $75k-100k, 57.0% for AGIs $100k-200k, 40.6% for AGIs over 200k)
Taxable interest for individuals: $2,786 (reported on 36.2% of returns)
This zip code:
$2,786
Arizona:
$2,064
(% of AGI for various income ranges: 1.3% for AGIs below $25k, 1.8% for AGIs $25k-50k, 1.8% for AGIs $50k-75k, 0.8% for AGIs $75k-100k, 2.1% for AGIs $100k-200k, 2.1% for AGIs over 200k)
Ordinary dividends: $5,827 (reported on 24.1% of returns)
Here:
$5,827
State:
$7,268
(% of AGI for various income ranges: 3.4% for AGIs below $25k, 1.9% for AGIs $25k-50k, 1.7% for AGIs $50k-75k, 1.9% for AGIs $75k-100k, 2.4% for AGIs $100k-200k, 3.8% for AGIs over 200k)
Net capital gain/loss in AGI: +$9,033 (reported on 21.1% of returns)
Here:
+$9,033
State:
+$15,530
(% of AGI for various income ranges: 0.8% for AGIs $25k-50k, 0.2% for AGIs $50k-75k, 0.2% for AGIs $75k-100k, 1.8% for AGIs $100k-200k, 15.5% for AGIs over 200k)
Profit/loss from business: +$6,719 (reported on 18.1% of returns)
Here:
+$6,719
State:
+$12,323
(% of AGI for various income ranges: 5.5% for AGIs below $25k, 2.9% for AGIs $25k-50k, 2.2% for AGIs $50k-75k, 0.4% for AGIs $75k-100k, 2.9% for AGIs $100k-200k)
Taxable individual retirement arrangement distribution: $16,171 (reported on 17.6% of returns)
85935:
$16,171
Arizona:
$18,280
(% of AGI for various income ranges: 4.7% for AGIs below $25k, 4.5% for AGIs $25k-50k, 5.3% for AGIs $50k-75k, 5.6% for AGIs $75k-100k, 7.6% for AGIs $100k-200k)
Total itemized deductions: $23,222 (24% of AGI, reported on 39.7% of returns)
Here:
$23,222
State:
$23,651
Here:
24.4% of AGI
State:
20.6% of AGI
(% of AGI for various income ranges: 17.4% for AGIs below $25k, 14.9% for AGIs $25k-50k, 16.5% for AGIs $50k-75k, 13.9% for AGIs $75k-100k, 18.7% for AGIs $100k-200k, 13.3% for AGIs over 200k)
Charity contributions: $4,167 (reported on 32.2% of returns)
Here:
$4,167
State:
$4,114
(% of AGI for various income ranges: 0.7% for AGIs below $25k, 1.3% for AGIs $25k-50k, 2.2% for AGIs $50k-75k, 2.0% for AGIs $75k-100k, 3.3% for AGIs $100k-200k, 2.8% for AGIs over 200k)
Taxes paid: $6,100 (reported on 39.2% of returns)
85935:
$6,100
State:
$6,509
(% of AGI for various income ranges: 3.1% for AGIs below $25k, 3.0% for AGIs $25k-50k, 3.7% for AGIs $50k-75k, 3.5% for AGIs $75k-100k, 4.9% for AGIs $100k-200k, 5.3% for AGIs over 200k)
Earned income credit: $2,043 (reported on 18.6% of returns)
Here:
$2,043
State:
$2,432
(% of AGI for various income ranges: 6.2% for AGIs below $25k, 1.2% for AGIs $25k-50k)
Percentage of individuals using paid preparers for their 2012 taxes: 61.8%
Here:
62%
State:
52%
(% for various income ranges: 56.2% for AGIs below $25k, 60.0% for AGIs $25k-50k, 61.3% for AGIs $50k-75k, 68.4% for AGIs $75k-100k, 72.0% for AGIs $100k-200k, 83.3% for AGIs over 200k)
Averages for the 2004 tax year for zip code 85935, filed in 2005:
Average Adjusted Gross Income (AGI) in 2004: $57,688 (Individual Income Tax Returns)
Here:
$57,688
State:
$50,097
Salary/wage: $46,689 (reported on 75.2% of returns)
Here:
$46,689
State:
$42,146
(% of AGI for various income ranges: 163.1% for AGIs below $10k, 67.1% for AGIs $10k-25k, 66.8% for AGIs $25k-50k, 56.8% for AGIs $50k-75k, 60.8% for AGIs $75k-100k, 57.8% for AGIs over 100k)
Taxable interest for individuals: $2,895 (reported on 49.1% of returns)
This zip code:
$2,895
Arizona:
$2,374
(% of AGI for various income ranges: 10.8% for AGIs below $10k, 3.0% for AGIs $10k-25k, 2.3% for AGIs $25k-50k, 2.7% for AGIs $50k-75k, 1.9% for AGIs $75k-100k, 2.4% for AGIs over 100k)
Taxable dividends: $3,116 (reported on 31.4% of returns)
Here:
$3,116
State:
$3,888
(% of AGI for various income ranges: 9.1% for AGIs below $10k, 2.5% for AGIs $10k-25k, 1.4% for AGIs $25k-50k, 1.5% for AGIs $50k-75k, 2.4% for AGIs $75k-100k, 1.5% for AGIs over 100k)
Net capital gain/loss: +$11,630 (reported on 28.3% of returns)
Here:
+$11,630
State:
+$17,569
(% of AGI for various income ranges: -10.5% for AGIs below $10k, 0.9% for AGIs $10k-25k, 1.2% for AGIs $25k-50k, 2.2% for AGIs $50k-75k, 4.8% for AGIs $75k-100k, 9.7% for AGIs over 100k)
Profit/loss from business: +$11,961 (reported on 19.2% of returns)
Here:
+$11,961
State:
+$11,088
(% of AGI for various income ranges: 17.8% for AGIs below $10k, 5.5% for AGIs $10k-25k, 4.1% for AGIs $25k-50k, 4.2% for AGIs $50k-75k, 4.1% for AGIs $75k-100k, 3.4% for AGIs over 100k)
IRA payment deduction: $3,343 (reported on 3.1% of returns)
85935:
$3,343
Arizona:
$3,023
Self-employed pension: $10,839 (reported on 1.4% of returns)
Here:
$10,839
Arizona:
$15,785
Total itemized deductions: $20,557 (22% of AGI, reported on 44.3% of returns)
Here:
$20,557
State:
$19,781
Here:
21.8% of AGI
State:
21.8% of AGI
(% of AGI for various income ranges: 49.5% for AGIs below $10k, 17.7% for AGIs $10k-25k, 18.3% for AGIs $25k-50k, 19.7% for AGIs $50k-75k, 17.8% for AGIs $75k-100k, 12.3% for AGIs over 100k)
Charity contributions deductions: $3,340 (3% of AGI, reported on 38.7% of returns)
Here:
$3,340
State:
$3,389
Here:
3.3% of AGI
State:
3.5% of AGI
(% of AGI for various income ranges: 2.7% for AGIs below $10k, 1.9% for AGIs $10k-25k, 2.3% for AGIs $25k-50k, 2.5% for AGIs $50k-75k, 3.0% for AGIs $75k-100k, 2.0% for AGIs over 100k)
Total tax: $10,774 (reported on 76.2% of returns)
85935:
$10,774
State:
$8,323
(% of AGI for various income ranges: 5.2% for AGIs below $10k, 3.8% for AGIs $10k-25k, 6.1% for AGIs $25k-50k, 8.9% for AGIs $50k-75k, 9.8% for AGIs $75k-100k, 21.7% for AGIs over 100k)
Earned income credit: $1,760 (reported on 13.7% of returns)
Here:
$1,760
State:
$1,786
Percentage of individuals using paid preparers for their 2004 taxes: 66.2%
Here:
66%
State:
60%
(% for various income ranges: 58.7% for AGIs below $10k, 61.0% for AGIs $10k-25k, 67.4% for AGIs $25k-50k, 68.4% for AGIs $50k-75k, 73.2% for AGIs $75k-100k, 77.3% for AGIs over 100k)
Likely homosexual households (counted as self-reported same-sex unmarried-partner households)
Lesbian couples: 0.5% of all households
Gay men: 0.0% of all households
Household received Food Stamps/SNAP in the past 12 months: 123 Household did not receive Food Stamps/SNAP in the past 12 months: 2,048
Women who had a birth in the past 12 months: 1 (0 now married, 1 unmarried) Women who did not have a birth in the past 12 months: 818 (339 now married, 478 unmarried)
Housing units in zip code 85935 with a mortgage: 775 (64 second mortgage, 36 both second mortgage and home equity loan) Houses without a mortgage: 16
Median monthly owner costs for units with a mortgage: $1,482 Median monthly owner costs for units without a mortgage: $451
Residents with income below the poverty level in 2022:
This zip code:
7.4%
Whole state:
12.5%
Residents with income below 50% of the poverty level in 2022:
This zip code:
4.4%
Whole state:
6.0%
Median number of rooms in houses and condos:
Here:
5.8
State:
6.0
Median number of rooms in apartments:
Here:
3.9
State:
4.1
Notable locations in this zip code not listed on our city pages
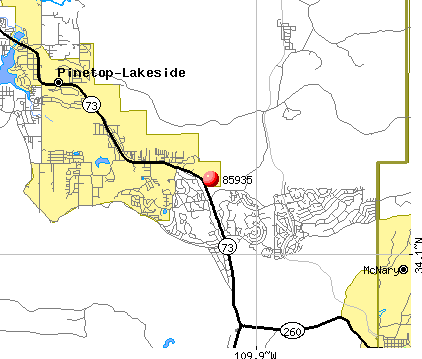
Notable locations in zip code 85935: Cooley Ranch (A), Bootleg Lake Campground (B), Cooley Lake Campground (C), Woodland Campground (D), Pinetop Country Club (E), Pinetop Lakes Country Club (F), White Mountain Country Club (G), White Mountain Apache Tribe Hon - Dah Regional Wastewater Treatment Facility (H), Arizona Game and Fish Region One Office (I), Pinetop Fire Department Station Number 120 (J), Pinetop Fire Department Station Number 110 (K). Display/hide their locations on the map
Churches in zip code 85935 include: First Baptist Church of Pinetop (A), Community Presbyterian Church (B), Saint Mary of the Angels Catholic Community (C). Display/hide their locations on the map
Reservoirs: Bootleg Lake (A), Section Two Tank (B), Buckhorn Tank (C), Largo Tank Number Two (D), Largo Tank (E), Section 15 Tank (F), Thompson Tank (G), Fantasia Tank (H). Display/hide their locations on the map
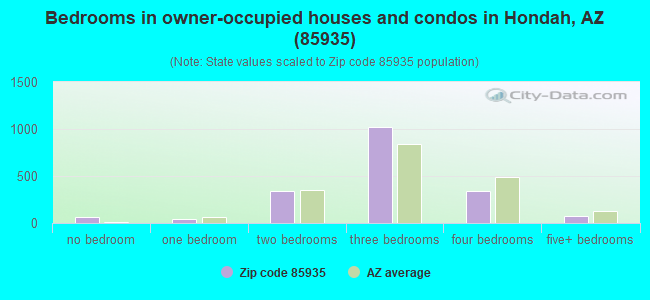
Size of family households: 999 2-persons, 211 3-persons, 163 4-persons, 106 5-persons
Size of nonfamily households: 602 1-person, 90 2-persons
352 married couples with children.
74 single-parent households (9 men, 65 women).
87.6% of residents of 85935 zip code speak English at home.
5.2% of residents speak Spanish at home (75% very well, 13% well, 6% not well, 6% not at all).
3.0% of residents speak other Indo-European language at home (64% very well, 36% well).
4.7% of residents speak other language at home (94% very well, 6% not well).
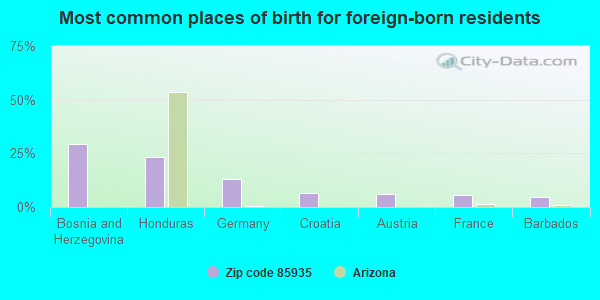
Foreign born population: 204 (4.4%) (78.3% of them are naturalized citizens)
This zip code:
4.4%
Whole state:
13.1%
29%Bosnia and Herzegovina
23%Honduras
13%Germany
7%Croatia
6%Austria
6%France
5%Barbados
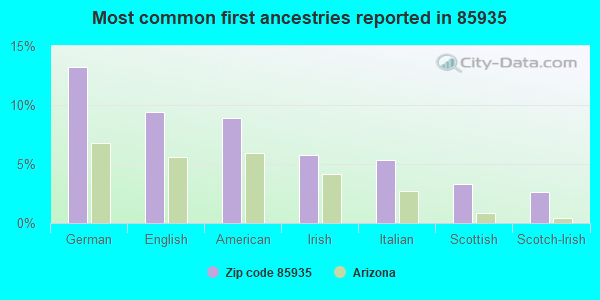
13%German
9%English
9%American
6%Irish
5%Italian
3%Scottish
3%Scotch-Irish
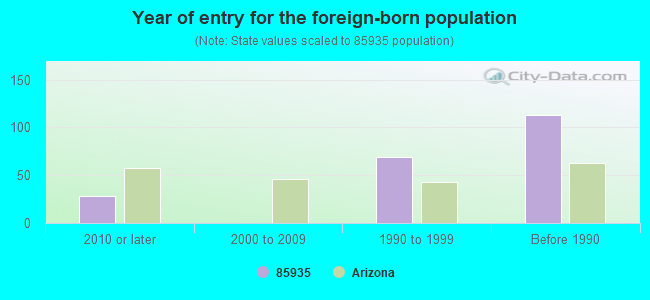
Year of entry for the foreign-born population
282010 or later
02000 to 2009
691990 to 1999
113Before 1990
Facilities with environmental interests located in this zip code:
HARVEYS LAUNDRY AND DRY CLEANERS (WHITE MT VILLAGE SHOPPING CTR in PINETOP, AZ)
(Resource Conservation and Recovery Act (tracking hazardous waste)) Organizations: CLIFFORD & VIRGINIA HARVEY (CONTACT/OWNER)
WHITE MOUNTAIN APACHE TRIBE (HIGHWAY 73 & 260 in PINETOP, AZ) . Tribal Land
(Resource Conservation and Recovery Act (tracking hazardous waste)) Alternative names: HON-DAH CASINO
Housing units lacking complete plumbing facilities: 0.8% Housing units lacking complete kitchen facilities: 2.1%
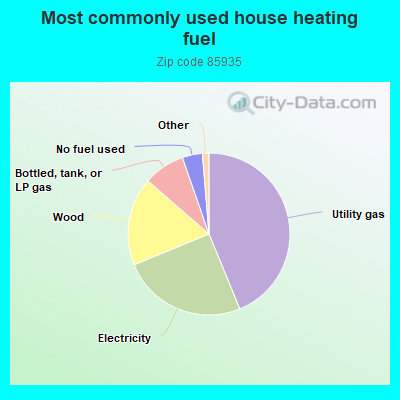
43.8%Utility gas
25.0%Electricity
17.6%Wood
8.3%Bottled, tank, or LP gas
4.0%No fuel used
0.7%Fuel oil, kerosene, etc.
0.7%Other fuel
Population in 1990: 1,938. Population change in the 1990s: +3,382 (+174.5%).
Place of birth for U.S.-born residents:
This state: 1,766
Northeast: 448
Midwest: 742
South: 413
West: 1,030
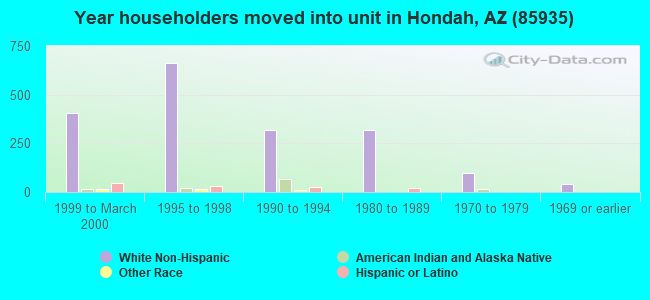
44% of the 85935 zip code residents lived in the same house 5 years ago. Out of people who lived in different houses, 39% lived in this county. Out of people who lived in different counties, 50% lived in Arizona.
79% of the 85935 zip code residents lived in the same house 1 year ago. Out of people who lived in different houses, 34% moved from this county. Out of people who lived in different houses, 49% moved from different county within same state. Out of people who lived in different houses, 8% moved from different state. Out of people who lived in different houses, 3% moved from abroad.
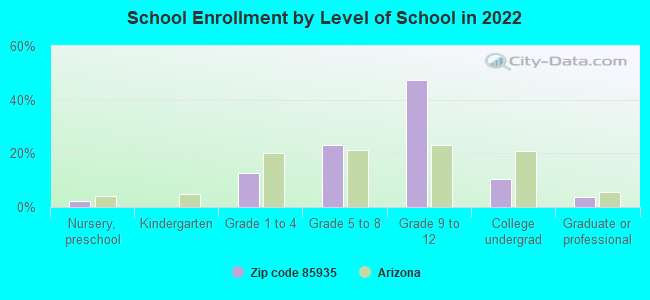
Private vs. public school enrollment:
Students in private schools in grades 1 to 8 (elementary and middle school): 14
Here:
6.3%
Arizona:
10.4%
Students in private schools in grades 9 to 12 (high school):
Here:
0.0%
Arizona:
8.8%
Students in private undergraduate colleges:
Here:
0.0%
Arizona:
13.1%
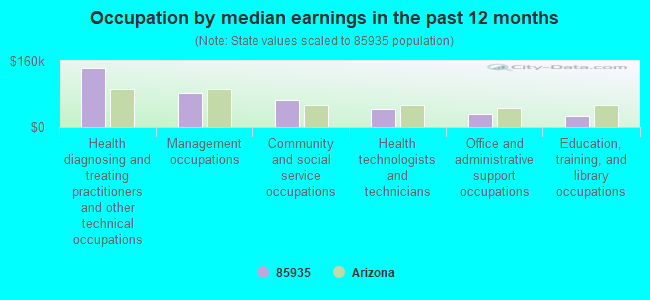
Occupation by median earnings in the past 12 months ($)
142,508Health diagnosing and treating practitioners and other technical occupations
81,441Management occupations
65,439Community and social service occupations
42,548Health technologists and technicians
30,538Office and administrative support occupations
27,324Education, training, and library occupations
Top industries in this zip code by the number of employees in 2005:
Accommodation and Food Services: Casino Hotels (250-499 employees: 1 establishment)
Accommodation and Food Services: Limited-Service Restaurants (50-99: 1, 20-49: 2)
Real Estate and Rental and Leasing: Offices of Real Estate Agents and Brokers (20-49: 1, 5-9: 1, 1-4: 16)
Health Care and Social Assistance: Offices of Physicians (except Mental Health Specialists) (20-49: 1, 10-19: 1, 1-4: 5)
Other Services (except Public Administration): Other Similar Organizations (except Business, Professional, Labor, and Political Organizations) (10-19: 3, 5-9: 1, 1-4: 2)
Arts, Entertainment, and Recreation: Golf Courses and Country Clubs (10-19: 3)
Construction: New Single-Family Housing Construction (except Operative Builders) (5-9: 4, 1-4: 8)
People in group quarters in 2010:
17 people in other noninstitutional facilities
People in group quarters in 2000:
6 people in homes for the mentally retarded
Fatal accident statistics in 2014:
Fatal accident count: 3
Vehicles involved in fatal accidents: 3
Fatal accidents caused by drunken drivers: 1
Fatalities: 3
Persons involved in fatal accidents: 4
Pedestrians involved in fatal accidents: 2
Fatal accident statistics in 2013:
Fatal accident count: 1
Vehicles involved in fatal accidents: 2
Fatal accidents caused by drunken drivers: 0
Fatalities: 1
Persons involved in fatal accidents: 3
Pedestrians involved in fatal accidents: 0
2004 - 2018 National Fire Incident Reporting System (NFIRS) incidents
Based on the data from the years 2004 - 2018 the average number of fire incidents per year is 21. The highest number of reported fire incidents - 38 took place in 2006, and the least - 6 in 2012. The data has a dropping trend.
When looking into fire subcategories, the most reports belonged to: Structure Fires (46.3%), and Outside Fires (43.5%).
Fire incident types reported to NFIRS in Zip Code 85935


 Nearest zip codes: 85929, 85930, 85901, 85940, 85941, 85912.


 Based on the data from the years 2004 - 2018 the average number of fire incidents per year is 21. The highest number of reported fire incidents - 38 took place in 2006, and the least - 6 in 2012. The data has a dropping trend.
 When looking into fire subcategories, the most reports belonged to: Structure Fires (46.3%), and Outside Fires (43.5%).