Estimated zip code population in 2022: 2,199 Zip code population in 2010: 1,637 Zip code population in 2000: 986
Houses and condos: 1,406 Renter-occupied apartments: 105
% of renters here:
9%
State:
33%
March 2022 cost of living index in zip code 86332: 85.8 (less than average, U.S. average is 100)
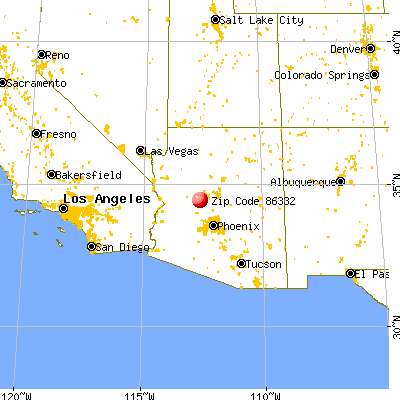
Land area: 488.5 sq. mi. Water area: 0.0 sq. mi.
Population density: 5 people per square mile
(very low).
OSM Map
General Map
Google Map
MSN Map
OSM Map
General Map
Google Map
MSN Map
OSM Map
General Map
Google Map
MSN Map
OSM Map
General Map
Google Map
MSN Map
Please wait while loading the map...
Real estate property taxes paid for housing units in 2022:
This zip code:
0.4% ($817)
Arizona:
0.4% ($1,786)
Median real estate property taxes paid for housing units with mortgages in 2022: $1,015 (0.5%) Median real estate property taxes paid for housing units with no mortgage in 2022: $718 (0.3%)
Business Search- 14 Million verified businesses
Males: 1,242
(56.5%)
Females: 957
(43.5%)
For population 25 years and over in 86332:
High school or higher: 84.6%
Bachelor's degree or higher: 13.2%
Graduate or professional degree: 4.1%
Unemployed: 1.9%
Mean travel time to work (commute): 39.1 minutes
For population 15 years and over in 86332:
Never married: 17.5%
Now married: 46.3%
Separated: 0.8%
Widowed: 9.9%
Divorced: 25.6%
Zip code 86332 compared to state average:
Median household income below state average.
Median house value below state average.
Unemployed percentage below state average.
Black race population percentage significantly below state average.
Hispanic race population percentage below state average.
Median age significantly above state average.
Foreign-born population percentage significantly below state average.
Renting percentage significantly below state average.
Length of stay since moving in significantly above state average.
Number of rooms per house below state average.
Number of college students below state average.
Percentage of population with a bachelor's degree or higher below state average.
Estimated median house/condo value in 2022: $209,797
86332:
$209,797
Arizona:
$402,800
According to our research of Arizona and other state lists, there were 3 registered sex offenders living in 86332 zip code as of May 28, 2024. The ratio of all residents to sex offenders in zip code 86332 is 578 to 1. The ratio of registered sex offenders to all residents in this zip code is near the state average.
Median resident age:
This zip code:
62.0 years
Arizona median age:
38.8 years
Average household size:
This zip code:
1.9 people
Arizona:
2.5 people
Averages for the 2020 tax year for zip code 86332, filed in 2021:
Average Adjusted Gross Income (AGI) in 2020: $51,369 (Individual Income Tax Returns)
Here:
$51,369
State:
$73,499
Salary/wage: $37,913 (reported on 68.7% of returns)
Here:
$37,913
State:
$59,499
(% of AGI for various income ranges: 990.6% for AGIs below $25k, 3441.7% for AGIs $25k-50k, 6391.7% for AGIs $50k-75k, 7510.0% for AGIs $75k-100k, 18130.0% for AGIs $100k-200k)
Taxable interest for individuals: $2,300 (reported on 25.4% of returns)
This zip code:
$2,300
Arizona:
$2,325
(% of AGI for various income ranges: 22.2% for AGIs below $25k, 19.2% for AGIs $25k-50k, 56.7% for AGIs $50k-75k, 980.0% for AGIs $100k-200k)
Ordinary dividends: $4,500 (reported on 10.4% of returns)
Here:
$4,500
State:
$8,711
(% of AGI for various income ranges: 13.9% for AGIs below $25k, 97.5% for AGIs $25k-50k, 576.7% for AGIs $100k-200k)
Net capital gain/loss in AGI: +$8,500 (reported on 13.4% of returns)
Here:
+$8,500
State:
+$31,332
(% of AGI for various income ranges: 15.0% for AGIs below $25k, 109.2% for AGIs $25k-50k, 2023.3% for AGIs $100k-200k)
Profit/loss from business: +$7,244 (reported on 13.4% of returns)
Here:
+$7,244
State:
+$13,214
(% of AGI for various income ranges: 155.6% for AGIs below $25k, 83.3% for AGIs $25k-50k, 453.3% for AGIs $50k-75k)
Taxable individual retirement arrangement distribution: $22,144 (reported on 13.4% of returns)
86332:
$22,144
Arizona:
$23,364
(% of AGI for various income ranges: 215.6% for AGIs below $25k, 1098.3% for AGIs $50k-75k, 3153.3% for AGIs $100k-200k)
Total itemized deductions: $37,850 (reported on 3.0% of returns)
Here:
$37,850
State:
$36,308
(% of AGI for various income ranges: 2523.3% for AGIs $75k-100k)
Taxes paid: $6,000 (reported on 4.5% of returns)
86332:
$6,000
State:
$6,820
(% of AGI for various income ranges: 600.0% for AGIs $75k-100k)
Earned income credit: $1,958 (reported on 17.9% of returns)
Here:
$1,958
State:
$2,383
(% of AGI for various income ranges: 78.3% for AGIs below $25k, 78.3% for AGIs $25k-50k)
Percentage of individuals using paid preparers for their 2020 taxes: 92.5%
Here:
93%
State:
93%
(% for various income ranges: 92.6% for AGIs below $25k, 94.1% for AGIs $25k-50k, 90.0% for AGIs $50k-75k, 100.0% for AGIs $75k-100k, 87.5% for AGIs $100k-200k)
Averages for the 2012 tax year for zip code 86332, filed in 2013:
Average Adjusted Gross Income (AGI) in 2012: $40,775 (Individual Income Tax Returns)
Here:
$40,775
State:
$57,644
Salary/wage: $34,631 (reported on 67.3% of returns)
Here:
$34,631
State:
$47,932
(% of AGI for various income ranges: 64.7% for AGIs below $25k, 50.4% for AGIs $25k-50k, 61.4% for AGIs $50k-75k, 57.8% for AGIs $75k-100k, 54.3% for AGIs $100k-200k)
Taxable interest for individuals: $2,162 (reported on 30.8% of returns)
This zip code:
$2,162
Arizona:
$2,064
(% of AGI for various income ranges: 0.8% for AGIs below $25k, 0.5% for AGIs $25k-50k, 0.2% for AGIs $50k-75k, 1.0% for AGIs $75k-100k, 4.7% for AGIs $100k-200k)
Ordinary dividends: $2,700 (reported on 15.4% of returns)
Here:
$2,700
State:
$7,268
(% of AGI for various income ranges: 1.3% for AGIs below $25k, 1.7% for AGIs $25k-50k, 2.8% for AGIs $75k-100k)
Net capital gain/loss in AGI: +$2,900 (reported on 9.6% of returns)
Here:
+$2,900
State:
+$15,530
Profit/loss from business: +$4,362 (reported on 15.4% of returns)
Here:
+$4,362
State:
+$12,323
Taxable individual retirement arrangement distribution: $12,700 (reported on 15.4% of returns)
86332:
$12,700
Arizona:
$18,280
Total itemized deductions: $19,892 (28% of AGI, reported on 25.0% of returns)
Here:
$19,892
State:
$23,651
Here:
28.4% of AGI
State:
20.6% of AGI
(% of AGI for various income ranges: 14.1% for AGIs below $25k, 9.8% for AGIs $25k-50k, 13.8% for AGIs $50k-75k, 13.1% for AGIs $75k-100k, 11.1% for AGIs $100k-200k)
Charity contributions: $2,200 (reported on 21.2% of returns)
Here:
$2,200
State:
$4,114
(% of AGI for various income ranges: 1.5% for AGIs $25k-50k, 1.7% for AGIs $50k-75k, 2.7% for AGIs $75k-100k)
Taxes paid: $4,585 (reported on 25.0% of returns)
86332:
$4,585
State:
$6,509
(% of AGI for various income ranges: 1.7% for AGIs below $25k, 1.6% for AGIs $25k-50k, 2.4% for AGIs $50k-75k, 2.7% for AGIs $75k-100k, 4.9% for AGIs $100k-200k)
Earned income credit: $2,300 (reported on 19.2% of returns)
Here:
$2,300
State:
$2,432
(% of AGI for various income ranges: 5.3% for AGIs below $25k, 1.2% for AGIs $25k-50k)
Percentage of individuals using paid preparers for their 2012 taxes: 46.2%
Here:
46%
State:
52%
(% for various income ranges: 34.6% for AGIs below $25k, 50.0% for AGIs $25k-50k, 71.4% for AGIs $50k-75k, 100.0% for AGIs $75k-100k)
Averages for the 2004 tax year for zip code 86332, filed in 2005:
Average Adjusted Gross Income (AGI) in 2004: $32,323 (Individual Income Tax Returns)
Here:
$32,323
State:
$50,097
Salary/wage: $28,380 (reported on 68.5% of returns)
Here:
$28,380
State:
$42,146
(% of AGI for various income ranges: 196.3% for AGIs below $10k, 59.7% for AGIs $10k-25k, 61.2% for AGIs $25k-50k, 65.2% for AGIs $50k-75k, 66.4% for AGIs $75k-100k, 41.9% for AGIs over 100k)
Taxable interest for individuals: $992 (reported on 45.8% of returns)
This zip code:
$992
Arizona:
$2,374
(% of AGI for various income ranges: 16.0% for AGIs below $10k, 2.5% for AGIs $10k-25k, 1.2% for AGIs $25k-50k, 0.7% for AGIs $50k-75k, 0.6% for AGIs $75k-100k, 1.5% for AGIs over 100k)
Taxable dividends: $2,145 (reported on 21.6% of returns)
Here:
$2,145
State:
$3,888
(% of AGI for various income ranges: 20.2% for AGIs below $10k, 2.1% for AGIs $10k-25k, 1.2% for AGIs $25k-50k, 0.9% for AGIs $50k-75k, 2.4% for AGIs $75k-100k)
Net capital gain/loss: +$4,132 (reported on 21.0% of returns)
Here:
+$4,132
State:
+$17,569
(% of AGI for various income ranges: -18.4% for AGIs below $10k, 0.8% for AGIs $10k-25k, -0.3% for AGIs $25k-50k, 3.1% for AGIs $50k-75k, 13.6% for AGIs $75k-100k)
Profit/loss from business: +$4,424 (reported on 18.3% of returns)
Here:
+$4,424
State:
+$11,088
(% of AGI for various income ranges: 1.8% for AGIs below $10k, 5.6% for AGIs $10k-25k, 5.3% for AGIs $25k-50k, 0.9% for AGIs $50k-75k)
Total itemized deductions: $15,562 (30% of AGI, reported on 28.2% of returns)
Here:
$15,562
State:
$19,781
Here:
30.0% of AGI
State:
21.8% of AGI
(% of AGI for various income ranges: 73.0% for AGIs below $10k, 14.6% for AGIs $10k-25k, 12.1% for AGIs $25k-50k, 13.5% for AGIs $50k-75k, 17.7% for AGIs $75k-100k, 8.7% for AGIs over 100k)
Charity contributions deductions: $2,168 (4% of AGI, reported on 23.1% of returns)
Here:
$2,168
State:
$3,389
Here:
4.1% of AGI
State:
3.5% of AGI
(% of AGI for various income ranges: 4.9% for AGIs below $10k, 1.4% for AGIs $10k-25k, 0.9% for AGIs $25k-50k, 1.9% for AGIs $50k-75k, 3.1% for AGIs $75k-100k, 0.7% for AGIs over 100k)
Total tax: $4,182 (reported on 67.9% of returns)
86332:
$4,182
State:
$8,323
(% of AGI for various income ranges: 9.2% for AGIs below $10k, 3.6% for AGIs $10k-25k, 6.3% for AGIs $25k-50k, 8.6% for AGIs $50k-75k, 9.8% for AGIs $75k-100k, 15.9% for AGIs over 100k)
Earned income credit: $1,695 (reported on 17.5% of returns)
Here:
$1,695
State:
$1,786
Percentage of individuals using paid preparers for their 2004 taxes: 62.5%
Here:
63%
State:
60%
(% for various income ranges: 54.7% for AGIs below $10k, 64.4% for AGIs $10k-25k, 62.3% for AGIs $25k-50k, 71.2% for AGIs $50k-75k, 75.0% for AGIs $75k-100k, 55.6% for AGIs over 100k)
Reservoirs: Ash Tank (A), Shaw Tank (B), LF Tank (C), Mine Tank (D), Carter Tank (E), South Tank (F), Wilhoit Tank (G), West Trick Tank (H). Display/hide their locations on the map
Streams, rivers, and creeks: Cellar Springs Creek (A), Bland Creek (B), Indian Springs Creek (C), Mescal Creek (D), Sheppard Wash (E), Middlewater Creek (F), Milk Creek (G), Minnehaha Creek (H), Towers Creek (I). Display/hide their locations on the map
In group quarters: 1 (-1 institutionalized population)
Size of family households: 396 2-persons, 100 3-persons, 30 4-persons, 39 5-persons, 16 6-persons
Size of nonfamily households: 535 1-person, 60 2-persons
136 married couples with children.
76 single-parent households (53 men, 23 women).
98.5% of residents of 86332 zip code speak English at home.
2.2% of residents speak Spanish at home (100% very well).
0.3% of residents speak other Indo-European language at home (100% very well).
Foreign born population: 55 (2.5%) (83.9% of them are naturalized citizens)
This zip code:
2.5%
Whole state:
13.1%
92%Croatia
9%Honduras
6%Sweden
17%American
16%English
11%Irish
10%German
3%Czech
3%Dutch
2%Scotch-Irish
Year of entry for the foreign-born population
02010 or later
52000 to 2009
01990 to 1999
64Before 1990
Public school in in zip code 86332 not listed on the city page:
Facilities with environmental interests located in this zip code:
ZONIA MINE, ZONIA CO INC (STATE ROUTE 1 in KIRKLAND, AZ)
National Pollutant Discharge Elimination System NON-MAJOR (Tracking pollutant discharge elimination systems) - permit National Pollutant Discharge Elimination System NON-MAJOR (Tracking pollutant discharge elimination systems) - permit Business SIC classification: COPPER ORES
Housing units lacking complete plumbing facilities: 0.9% Housing units lacking complete kitchen facilities: 2.4%
43.8%Bottled, tank, or LP gas
36.0%Electricity
14.7%Wood
3.9%No fuel used
0.9%Fuel oil, kerosene, etc.
0.6%Utility gas
Population in 1990: 186. Population change in the 1990s: +800 (+430.1%).
Place of birth for U.S.-born residents:
This state: 625
Northeast: 118
Midwest: 604
South: 156
West: 621
54% of the 86332 zip code residents lived in the same house 5 years ago. Out of people who lived in different houses, 49% lived in this county. Out of people who lived in different counties, 50% lived in Arizona.
92% of the 86332 zip code residents lived in the same house 1 year ago. Out of people who lived in different houses, 8% moved from this county. Out of people who lived in different houses, 67% moved from different county within same state. Out of people who lived in different houses, 34% moved from different state.
Private vs. public school enrollment:
Students in private schools in grades 1 to 8 (elementary and middle school):
Here:
0.0%
Arizona:
10.4%
Students in private schools in grades 9 to 12 (high school):
Here:
0.0%
Arizona:
8.8%
Students in private undergraduate colleges: 8
Here:
27.1%
Arizona:
13.1%
Occupation by median earnings in the past 12 months ($)
117,063Computer and mathematical occupations
81,043Business and financial operations occupations
77,820Installation, maintenance, and repair occupations
70,660Management occupations
70,636Education, training, and library occupations
67,552Healthcare support occupations
Top industries in this zip code by the number of employees in 2005:
Accommodation and Food Services: Full-Service Restaurants (10-19 employees: 2 establishments)
Accommodation and Food Services: RV (Recreational Vehicle) Parks and Campgrounds (10-19: 1)
Construction: New Single-Family Housing Construction (except Operative Builders) (1-4: 3)
Construction: Site Preparation Contractors (1-4: 2)
Professional, Scientific, and Technical Services: All Other Legal Services (1-4: 1)
Construction: Masonry Contractors (1-4: 1)
Information: Libraries and Archives (1-4: 1)
People in group quarters in 2010:
2 people in workers' group living quarters and job corps centers
Fatal accident statistics in 2013:
Fatal accident count: 1
Vehicles involved in fatal accidents: 1
Fatal accidents caused by drunken drivers: 1
Fatalities: 1
Persons involved in fatal accidents: 2
Pedestrians involved in fatal accidents: 0
Fatal accident statistics in 2011:
Fatal accident count: 3
Vehicles involved in fatal accidents: 3
Fatal accidents caused by drunken drivers: 3
Fatalities: 3
Persons involved in fatal accidents: 5
Pedestrians involved in fatal accidents: 0
Home Mortgage Disclosure Act Aggregated Statistics For Year 2009 (Based on 4 partial tracts)
A) FHA, FSA/RHS & VA Home Purchase Loans
B) Conventional Home Purchase Loans
C) Refinancings
D) Home Improvement Loans
F) Non-occupant Loans on < 5 Family Dwellings (A B C & D)
G) Loans On Manufactured Home Dwelling (A B C & D)
Number
Average Value
Number
Average Value
Number
Average Value
Number
Average Value
Number
Average Value
Number
Average Value
LOANS ORIGINATED
19
$178,118
43
$177,618
175
$207,159
5
$159,974
53
$202,306
14
$103,790
APPLICATIONS APPROVED, NOT ACCEPTED
1
$58,020
7
$213,417
10
$169,645
0
$0
4
$186,828
2
$75,185
APPLICATIONS DENIED
1
$144,740
12
$143,332
81
$203,373
7
$77,873
17
$183,201
13
$78,032
APPLICATIONS WITHDRAWN
4
$239,778
8
$147,758
31
$227,360
4
$182,420
7
$268,064
4
$108,855
FILES CLOSED FOR INCOMPLETENESS
0
$0
1
$111,520
12
$232,772
2
$254,920
0
$0
1
$46,470
Aggregated Statistics For Year 2008 (Based on 4 partial tracts)
A) FHA, FSA/RHS & VA Home Purchase Loans
B) Conventional Home Purchase Loans
C) Refinancings
D) Home Improvement Loans
F) Non-occupant Loans on < 5 Family Dwellings (A B C & D)
G) Loans On Manufactured Home Dwelling (A B C & D)
Number
Average Value
Number
Average Value
Number
Average Value
Number
Average Value
Number
Average Value
Number
Average Value
LOANS ORIGINATED
10
$171,577
43
$263,308
118
$220,334
10
$126,453
42
$239,836
23
$104,719
APPLICATIONS APPROVED, NOT ACCEPTED
1
$63,570
7
$199,571
25
$265,210
1
$46,470
5
$198,156
4
$92,130
APPLICATIONS DENIED
3
$209,310
15
$229,699
99
$255,987
15
$98,054
17
$229,673
16
$91,209
APPLICATIONS WITHDRAWN
1
$80,510
9
$217,229
49
$244,395
3
$117,043
7
$280,190
5
$113,782
FILES CLOSED FOR INCOMPLETENESS
0
$0
1
$111,000
15
$232,229
1
$106,560
2
$253,650
1
$140,300
Aggregated Statistics For Year 2007 (Based on 4 partial tracts)
A) FHA, FSA/RHS & VA Home Purchase Loans
B) Conventional Home Purchase Loans
C) Refinancings
D) Home Improvement Loans
E) Loans on Dwellings For 5+ Families
F) Non-occupant Loans on < 5 Family Dwellings (A B C & D)
G) Loans On Manufactured Home Dwelling (A B C & D)
Number
Average Value
Number
Average Value
Number
Average Value
Number
Average Value
Number
Average Value
Number
Average Value
Number
Average Value
LOANS ORIGINATED
6
$163,833
107
$210,762
168
$203,429
19
$113,794
1
$1,853,030
73
$207,602
36
$95,567
APPLICATIONS APPROVED, NOT ACCEPTED
0
$0
12
$168,571
26
$221,447
8
$101,456
0
$0
4
$214,188
8
$118,084
APPLICATIONS DENIED
3
$114,740
30
$201,807
96
$200,128
17
$103,862
1
$781,650
17
$214,344
24
$91,871
APPLICATIONS WITHDRAWN
1
$204,790
15
$218,510
46
$243,975
4
$173,662
0
$0
7
$179,224
8
$110,592
FILES CLOSED FOR INCOMPLETENESS
0
$0
4
$199,078
24
$241,919
2
$71,340
0
$0
2
$287,000
2
$117,810
Aggregated Statistics For Year 2006 (Based on 4 partial tracts)
A) FHA, FSA/RHS & VA Home Purchase Loans
B) Conventional Home Purchase Loans
C) Refinancings
D) Home Improvement Loans
E) Loans on Dwellings For 5+ Families
F) Non-occupant Loans on < 5 Family Dwellings (A B C & D)
G) Loans On Manufactured Home Dwelling (A B C & D)
Number
Average Value
Number
Average Value
Number
Average Value
Number
Average Value
Number
Average Value
Number
Average Value
Number
Average Value
LOANS ORIGINATED
5
$122,900
209
$202,328
174
$212,604
24
$82,020
1
$677,430
100
$234,932
36
$101,742
APPLICATIONS APPROVED, NOT ACCEPTED
1
$176,420
24
$221,881
39
$187,574
7
$91,313
1
$1,283,200
11
$186,269
6
$92,845
APPLICATIONS DENIED
1
$194,470
42
$183,710
92
$158,083
28
$95,819
0
$0
23
$170,684
28
$85,311
APPLICATIONS WITHDRAWN
0
$0
32
$185,099
61
$169,536
8
$123,980
0
$0
13
$155,918
6
$89,383
FILES CLOSED FOR INCOMPLETENESS
0
$0
4
$143,442
19
$186,101
4
$149,672
0
$0
3
$252,470
1
$48,250
Aggregated Statistics For Year 2005 (Based on 4 partial tracts)
A) FHA, FSA/RHS & VA Home Purchase Loans
B) Conventional Home Purchase Loans
C) Refinancings
D) Home Improvement Loans
F) Non-occupant Loans on < 5 Family Dwellings (A B C & D)
G) Loans On Manufactured Home Dwelling (A B C & D)
Number
Average Value
Number
Average Value
Number
Average Value
Number
Average Value
Number
Average Value
Number
Average Value
LOANS ORIGINATED
7
$128,253
228
$188,197
196
$181,906
27
$161,554
117
$188,652
41
$85,684
APPLICATIONS APPROVED, NOT ACCEPTED
1
$84,660
23
$171,082
28
$178,536
4
$60,458
11
$158,009
7
$88,384
APPLICATIONS DENIED
1
$162,290
48
$158,333
93
$148,762
25
$85,556
11
$162,799
22
$87,502
APPLICATIONS WITHDRAWN
1
$54,760
34
$196,446
43
$155,742
6
$162,418
10
$219,844
6
$90,132
FILES CLOSED FOR INCOMPLETENESS
0
$0
7
$162,047
38
$177,842
1
$46,770
5
$159,854
5
$78,914
Aggregated Statistics For Year 2004 (Based on 4 partial tracts)
A) FHA, FSA/RHS & VA Home Purchase Loans
B) Conventional Home Purchase Loans
C) Refinancings
D) Home Improvement Loans
E) Loans on Dwellings For 5+ Families
F) Non-occupant Loans on < 5 Family Dwellings (A B C & D)
G) Loans On Manufactured Home Dwelling (A B C & D)


 Nearest zip codes: 85362, 86303, 86338, 86313, 85332, 86301.


 (Students: 66, Location: 14200 W. KIRKLAND/HILLSIDE RD.)


