Estimated zip code population in 2022: 1,549 Zip code population in 2010: 2,224 Zip code population in 2000: 2,329
Houses and condos: 1,416 Renter-occupied apartments: 64
% of renters here:
7%
State:
33%
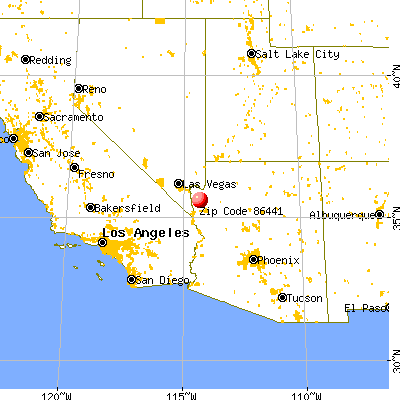
March 2022 cost of living index in zip code 86441: 84.6 (less than average, U.S. average is 100)
Land area: 510.6 sq. mi. Water area: 3.7 sq. mi.
Population density: 3 people per square mile
(very low).
OSM Map
General Map
Google Map
MSN Map
OSM Map
General Map
Google Map
MSN Map
OSM Map
General Map
Google Map
MSN Map
OSM Map
General Map
Google Map
MSN Map
Please wait while loading the map...
Real estate property taxes paid for housing units in 2022:
This zip code:
0.4% ($496)
Arizona:
0.4% ($1,786)
Median real estate property taxes paid for housing units with mortgages in 2022: $547 (0.2%) Median real estate property taxes paid for housing units with no mortgage in 2022: $453 (0.4%)
Averages for the 2020 tax year for zip code 86441, filed in 2021:
Average Adjusted Gross Income (AGI) in 2020: $34,264 (Individual Income Tax Returns)
Here:
$34,264
State:
$73,499
Salary/wage: $29,989 (reported on 60.7% of returns)
Here:
$29,989
State:
$59,499
(% of AGI for various income ranges: 854.5% for AGIs below $25k, 2566.5% for AGIs $25k-50k, 8736.7% for AGIs $50k-75k)
Taxable interest for individuals: $540 (reported on 16.4% of returns)
This zip code:
$540
Arizona:
$2,325
(% of AGI for various income ranges: 8.5% for AGIs below $25k, 12.4% for AGIs $25k-50k, 53.3% for AGIs $50k-75k)
Ordinary dividends: $1,967 (reported on 4.9% of returns)
Here:
$1,967
State:
$8,711
(% of AGI for various income ranges: 34.7% for AGIs $25k-50k)
Net capital gain/loss in AGI: +$3,660 (reported on 8.2% of returns)
Here:
+$3,660
State:
+$31,332
(% of AGI for various income ranges: 107.6% for AGIs $25k-50k)
Profit/loss from business: +$7,138 (reported on 13.1% of returns)
Here:
+$7,138
State:
+$13,214
(% of AGI for various income ranges: 142.0% for AGIs below $25k, 168.8% for AGIs $25k-50k)
Taxable individual retirement arrangement distribution: $6,725 (reported on 6.6% of returns)
86441:
$6,725
Arizona:
$23,364
(% of AGI for various income ranges: 158.2% for AGIs $25k-50k)
Earned income credit: $1,907 (reported on 24.6% of returns)
Here:
$1,907
State:
$2,383
(% of AGI for various income ranges: 84.0% for AGIs below $25k, 69.4% for AGIs $25k-50k)
Percentage of individuals using paid preparers for their 2020 taxes: 91.8%
Here:
92%
State:
93%
(% for various income ranges: 93.1% for AGIs below $25k, 90.5% for AGIs $25k-50k, 80.0% for AGIs $50k-75k, 100.0% for AGIs $75k-100k, 100.0% for AGIs $100k-200k)
Averages for the 2012 tax year for zip code 86441, filed in 2013:
Average Adjusted Gross Income (AGI) in 2012: $31,475 (Individual Income Tax Returns)
Here:
$31,475
State:
$57,644
Salary/wage: $28,216 (reported on 61.5% of returns)
Here:
$28,216
State:
$47,932
(% of AGI for various income ranges: 54.0% for AGIs below $25k, 55.9% for AGIs $25k-50k, 62.7% for AGIs $50k-75k, 49.1% for AGIs $75k-100k)
Taxable interest for individuals: $662 (reported on 25.0% of returns)
This zip code:
$662
Arizona:
$2,064
(% of AGI for various income ranges: 1.6% for AGIs below $25k, 0.3% for AGIs $25k-50k, 0.6% for AGIs $50k-75k)
Ordinary dividends: $1,740 (reported on 9.6% of returns)
Here:
$1,740
State:
$7,268
Profit/loss from business: +$3,340 (reported on 9.6% of returns)
Here:
+$3,340
State:
+$12,323
Taxable individual retirement arrangement distribution: $12,767 (reported on 5.8% of returns)
86441:
$12,767
Arizona:
$18,280
Total itemized deductions: $19,171 (35% of AGI, reported on 13.5% of returns)
Here:
$19,171
State:
$23,651
Here:
35.5% of AGI
State:
20.6% of AGI
Charity contributions: $3,375 (reported on 7.7% of returns)
Here:
$3,375
State:
$4,114
Taxes paid: $3,014 (reported on 13.5% of returns)
86441:
$3,014
State:
$6,509
Earned income credit: $1,891 (reported on 21.2% of returns)
Here:
$1,891
State:
$2,432
(% of AGI for various income ranges: 4.9% for AGIs below $25k, 0.8% for AGIs $25k-50k)
Percentage of individuals using paid preparers for their 2012 taxes: 51.9%
Here:
52%
State:
52%
(% for various income ranges: 46.4% for AGIs below $25k, 50.0% for AGIs $25k-50k, 66.7% for AGIs $50k-75k, 75.0% for AGIs $75k-100k)
Averages for the 2004 tax year for zip code 86441, filed in 2005:
Average Adjusted Gross Income (AGI) in 2004: $23,806 (Individual Income Tax Returns)
Here:
$23,806
State:
$50,097
Salary/wage: $21,545 (reported on 68.2% of returns)
Here:
$21,545
State:
$42,146
(% of AGI for various income ranges: 68.7% for AGIs below $10k, 52.3% for AGIs $10k-25k, 64.5% for AGIs $25k-50k, 66.5% for AGIs $50k-75k, 62.7% for AGIs $75k-100k)
Taxable interest for individuals: $1,398 (reported on 33.7% of returns)
This zip code:
$1,398
Arizona:
$2,374
(% of AGI for various income ranges: 8.7% for AGIs below $10k, 2.5% for AGIs $10k-25k, 2.0% for AGIs $25k-50k, 0.5% for AGIs $50k-75k, 0.3% for AGIs $75k-100k)
Taxable dividends: $852 (reported on 10.5% of returns)
Here:
$852
State:
$3,888
Net capital gain/loss: +$5,094 (reported on 11.0% of returns)
Here:
+$5,094
State:
+$17,569
Profit/loss from business: +$5,413 (reported on 10.8% of returns)
Here:
+$5,413
State:
+$11,088
Total itemized deductions: $15,059 (37% of AGI, reported on 17.4% of returns)
Here:
$15,059
State:
$19,781
Here:
36.5% of AGI
State:
21.8% of AGI
(% of AGI for various income ranges: 9.0% for AGIs $10k-25k, 12.8% for AGIs $25k-50k, 12.8% for AGIs $50k-75k, 11.8% for AGIs $75k-100k)
Charity contributions deductions: $2,184 (5% of AGI, reported on 13.1% of returns)
Here:
$2,184
State:
$3,389
Here:
5.3% of AGI
State:
3.5% of AGI
Total tax: $2,408 (reported on 63.7% of returns)
86441:
$2,408
State:
$8,323
(% of AGI for various income ranges: 2.0% for AGIs below $10k, 3.4% for AGIs $10k-25k, 6.5% for AGIs $25k-50k, 8.1% for AGIs $50k-75k, 11.3% for AGIs $75k-100k)
Earned income credit: $1,524 (reported on 21.7% of returns)
Here:
$1,524
State:
$1,786
Percentage of individuals using paid preparers for their 2004 taxes: 57.1%
Here:
57%
State:
60%
(% for various income ranges: 52.9% for AGIs below $10k, 56.0% for AGIs $10k-25k, 57.0% for AGIs $25k-50k, 65.9% for AGIs $50k-75k, 85.0% for AGIs $75k-100k)
Household received Food Stamps/SNAP in the past 12 months: 44 Household did not receive Food Stamps/SNAP in the past 12 months: 811
Women who did not have a birth in the past 12 months: 196 (125 now married, 70 unmarried)
Housing units in zip code 86441 with a mortgage: 238 Median monthly owner costs for units with a mortgage: $850 Median monthly owner costs for units without a mortgage: $221
Residents with income below the poverty level in 2022:
This zip code:
15.6%
Whole state:
12.5%
Residents with income below 50% of the poverty level in 2022:
This zip code:
10.5%
Whole state:
6.0%
Median number of rooms in houses and condos:
Here:
5.0
State:
6.0
Median number of rooms in apartments:
Here:
4.5
State:
4.1
Notable locations in this zip code not listed on our city pages
Notable locations in zip code 86441: Turkeytrack Ranch (A), Kemple Camp (B), Cow Camp (C), Miller Ranch (D), Mohave County Library District Dolan Springs Library (E), Lake Mohave Ranchos Fire Department (F). Display/hide their locations on the map
Churches in zip code 86441 include: Dolan Springs Baptist Church (A), Our Lady of the Desert Mission (B), The Church of Jesus Christ of Latter Day Saints (C). Display/hide their locations on the map
Size of family households: 477 2-persons, 80 3-persons, 20 5-persons
Size of nonfamily households: 274 1-person, 8 2-persons
72 married couples with children.
0 single-parent households ().
93.8% of residents of 86441 zip code speak English at home.
7.6% of residents speak Spanish at home (88% very well, 12% well).
Foreign born population: 194 (12.5%) (66.9% of them are naturalized citizens)
This zip code:
12.5%
Whole state:
13.1%
21%Chile
18%Honduras
17%Malaysia
12%El Salvador
8%Japan
18%English
15%German
4%Scottish
3%Irish
3%European
3%Norwegian
2%Scotch-Irish
Year of entry for the foreign-born population
02010 or later
452000 to 2009
541990 to 1999
79Before 1990
Facilities with environmental interests located in this zip code:
DEA ENVIRO SOLV (CYCLOPTIC RD ROLLING RIDGE R in DOLAN SPRINGS, AZ)
(Resource Conservation and Recovery Act (tracking hazardous waste)) Organizations: D E A (CONTACT/OWNER)
Housing units lacking complete plumbing facilities: 27.3% Housing units lacking complete kitchen facilities: 5.8%
66.3%Electricity
24.8%Bottled, tank, or LP gas
7.4%Wood
1.7%Utility gas
Population in 1990: 68. Population change in the 1990s: +2,261 (+3325.0%).
Place of birth for U.S.-born residents:
This state: 79
Northeast: 97
Midwest: 297
South: 253
West: 639
49% of the 86441 zip code residents lived in the same house 5 years ago. Out of people who lived in different houses, 14% lived in this county. Out of people who lived in different counties, 50% lived in Arizona.
94% of the 86441 zip code residents lived in the same house 1 year ago. Out of people who lived in different houses, 23% moved from this county. Out of people who lived in different houses, 97% moved from different state.
Private vs. public school enrollment:
Students in private schools in grades 1 to 8 (elementary and middle school):
Here:
0.0%
Arizona:
10.4%
Students in private undergraduate colleges:
Here:
0.0%
Arizona:
13.1%
Top industries in this zip code by the number of employees in 2005:
Construction: Poured Concrete Foundation and Structure Contractors (10-19 employees: 1 establishment)
Other Services (except Public Administration): Civic and Social Organizations (5-9: 1)
Accommodation and Food Services: Limited-Service Restaurants (5-9: 1)
Construction: Electrical Contractors (1-4: 1)
Construction: All Other Specialty Trade Contractors (1-4: 1)
Construction: Water and Sewer Line and Related Structures Construction (1-4: 1)
Finance and Insurance: Commercial Banking (1-4: 1)
Fatal accident statistics in 2014:
Fatal accident count: 2
Vehicles involved in fatal accidents: 2
Fatal accidents caused by drunken drivers: 1
Fatalities: 2
Persons involved in fatal accidents: 3
Pedestrians involved in fatal accidents: 0
Fatal accident statistics in 2013:
Fatal accident count: 1
Vehicles involved in fatal accidents: 1
Fatal accidents caused by drunken drivers: 0
Fatalities: 1
Persons involved in fatal accidents: 1
Pedestrians involved in fatal accidents: 0
Home Mortgage Disclosure Act Aggregated Statistics For Year 2009 (Based on 4 partial tracts)
A) FHA, FSA/RHS & VA Home Purchase Loans
B) Conventional Home Purchase Loans
C) Refinancings
D) Home Improvement Loans
F) Non-occupant Loans on < 5 Family Dwellings (A B C & D)
G) Loans On Manufactured Home Dwelling (A B C & D)
Number
Average Value
Number
Average Value
Number
Average Value
Number
Average Value
Number
Average Value
Number
Average Value
LOANS ORIGINATED
17
$122,871
14
$103,183
23
$116,135
1
$103,630
9
$100,906
8
$100,045
APPLICATIONS APPROVED, NOT ACCEPTED
0
$0
1
$71,170
4
$104,290
1
$42,450
1
$97,810
1
$65,880
APPLICATIONS DENIED
5
$85,404
6
$113,900
30
$132,802
6
$39,772
4
$108,212
12
$70,084
APPLICATIONS WITHDRAWN
2
$75,540
2
$80,120
10
$149,457
3
$36,627
2
$107,590
3
$74,640
FILES CLOSED FOR INCOMPLETENESS
0
$0
0
$0
3
$178,740
1
$123,330
0
$0
1
$104,720
Aggregated Statistics For Year 2008 (Based on 4 partial tracts)
A) FHA, FSA/RHS & VA Home Purchase Loans
B) Conventional Home Purchase Loans
C) Refinancings
D) Home Improvement Loans
F) Non-occupant Loans on < 5 Family Dwellings (A B C & D)
G) Loans On Manufactured Home Dwelling (A B C & D)
Number
Average Value
Number
Average Value
Number
Average Value
Number
Average Value
Number
Average Value
Number
Average Value
LOANS ORIGINATED
7
$148,464
19
$157,429
37
$135,965
6
$111,122
13
$134,745
15
$102,182
APPLICATIONS APPROVED, NOT ACCEPTED
0
$0
2
$129,800
6
$117,865
1
$27,050
2
$111,885
4
$99,435
APPLICATIONS DENIED
3
$161,433
12
$152,560
43
$144,827
15
$54,997
7
$142,260
27
$94,230
APPLICATIONS WITHDRAWN
2
$127,150
3
$106,213
19
$158,089
2
$129,645
6
$178,105
8
$115,651
FILES CLOSED FOR INCOMPLETENESS
0
$0
0
$0
5
$172,082
3
$30,823
3
$101,970
2
$46,615
Aggregated Statistics For Year 2007 (Based on 4 partial tracts)
A) FHA, FSA/RHS & VA Home Purchase Loans
B) Conventional Home Purchase Loans
C) Refinancings
D) Home Improvement Loans
F) Non-occupant Loans on < 5 Family Dwellings (A B C & D)
G) Loans On Manufactured Home Dwelling (A B C & D)
Number
Average Value
Number
Average Value
Number
Average Value
Number
Average Value
Number
Average Value
Number
Average Value
LOANS ORIGINATED
5
$161,986
37
$153,633
74
$148,099
13
$91,777
30
$147,655
34
$95,805
APPLICATIONS APPROVED, NOT ACCEPTED
0
$0
6
$133,895
23
$136,468
4
$123,820
9
$131,716
9
$102,384
APPLICATIONS DENIED
3
$138,403
20
$156,310
86
$161,222
19
$74,281
22
$170,977
38
$90,946
APPLICATIONS WITHDRAWN
1
$51,890
6
$125,503
32
$165,972
3
$84,627
5
$179,526
9
$100,189
FILES CLOSED FOR INCOMPLETENESS
0
$0
3
$229,930
12
$234,578
1
$71,590
2
$178,550
0
$0
Aggregated Statistics For Year 2003 (Based on 4 partial tracts)
A) FHA, FSA/RHS & VA Home Purchase Loans
B) Conventional Home Purchase Loans
C) Refinancings
D) Home Improvement Loans
F) Non-occupant Loans on < 5 Family Dwellings (A B C & D)
Number
Average Value
Number
Average Value
Number
Average Value
Number
Average Value
Number
Average Value
LOANS ORIGINATED
3
$108,547
50
$82,253
68
$80,552
2
$19,980
14
$73,280
APPLICATIONS APPROVED, NOT ACCEPTED
0
$0
7
$68,749
13
$77,702
0
$0
2
$48,485
APPLICATIONS DENIED
0
$0
19
$71,982
54
$75,984
6
$23,168
5
$74,910
APPLICATIONS WITHDRAWN
1
$44,000
7
$75,140
28
$77,565
1
$19,980
3
$72,140
FILES CLOSED FOR INCOMPLETENESS
0
$0
2
$55,445
2
$80,745
0
$0
1
$51,280
Aggregated Statistics For Year 2002 (Based on 4 partial tracts)
A) FHA, FSA/RHS & VA Home Purchase Loans
B) Conventional Home Purchase Loans
C) Refinancings
D) Home Improvement Loans
F) Non-occupant Loans on < 5 Family Dwellings (A B C & D)
Number
Average Value
Number
Average Value
Number
Average Value
Number
Average Value
Number
Average Value
LOANS ORIGINATED
1
$96,560
12
$63,035
15
$78,852
0
$0
3
$56,230
APPLICATIONS APPROVED, NOT ACCEPTED
0
$0
4
$65,302
5
$57,718
0
$0
0
$0
APPLICATIONS DENIED
0
$0
6
$80,397
12
$62,323
1
$13,540
3
$78,377
APPLICATIONS WITHDRAWN
0
$0
1
$83,240
8
$86,306
0
$0
1
$50,780
FILES CLOSED FOR INCOMPLETENESS
0
$0
0
$0
0
$0
0
$0
0
$0
Aggregated Statistics For Year 2001 (Based on 4 partial tracts)
B) Conventional Home Purchase Loans
C) Refinancings
D) Home Improvement Loans
F) Non-occupant Loans on < 5 Family Dwellings (A B C & D)
Number
Average Value
Number
Average Value
Number
Average Value
Number
Average Value
LOANS ORIGINATED
4
$54,750
5
$55,288
0
$0
1
$54,940
APPLICATIONS APPROVED, NOT ACCEPTED
2
$29,240
2
$38,915
0
$0
0
$0
APPLICATIONS DENIED
5
$42,334
4
$53,578
0
$0
1
$15,240
APPLICATIONS WITHDRAWN
1
$64,540
3
$71,170
1
$23,310
0
$0
FILES CLOSED FOR INCOMPLETENESS
0
$0
0
$0
0
$0
0
$0
Aggregated Statistics For Year 2000 (Based on 4 partial tracts)
A) FHA, FSA/RHS & VA Home Purchase Loans
B) Conventional Home Purchase Loans
C) Refinancings
D) Home Improvement Loans
F) Non-occupant Loans on < 5 Family Dwellings (A B C & D)
Number
Average Value
Number
Average Value
Number
Average Value
Number
Average Value
Number
Average Value
LOANS ORIGINATED
1
$50,360
4
$50,182
3
$34,453
0
$0
1
$42,380
APPLICATIONS APPROVED, NOT ACCEPTED
0
$0
2
$35,490
0
$0
0
$0
0
$0
APPLICATIONS DENIED
0
$0
6
$49,530
4
$50,685
1
$17,090
1
$39,920
APPLICATIONS WITHDRAWN
0
$0
1
$89,250
3
$58,413
0
$0
1
$31,810
FILES CLOSED FOR INCOMPLETENESS
0
$0
0
$0
0
$0
0
$0
0
$0
Aggregated Statistics For Year 1999 (Based on 3 partial tracts)
A) FHA, FSA/RHS & VA Home Purchase Loans
B) Conventional Home Purchase Loans
C) Refinancings
D) Home Improvement Loans
F) Non-occupant Loans on < 5 Family Dwellings (A B C & D)


 Nearest zip codes: 86431, 86445, 86413, 86409, 86443, 86429.


