Estimated zip code population in 2022: 1,472 Zip code population in 2010: 1,237 Zip code population in 2000: 1,358
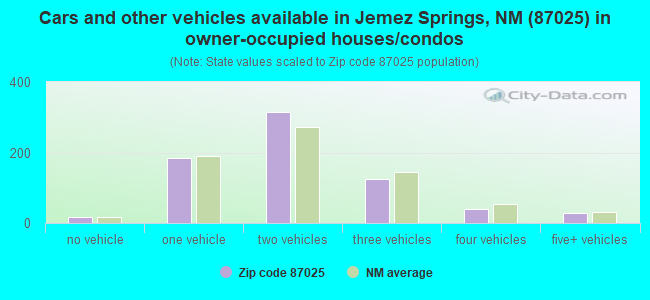
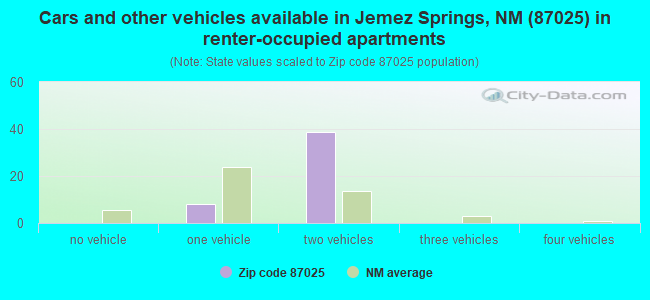
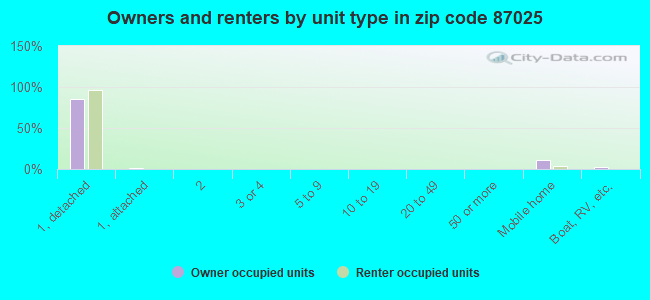
Houses and condos: 1,181 Renter-occupied apartments: 48
% of renters here:
6%
State:
29%
March 2022 cost of living index in zip code 87025: 87.3 (less than average, U.S. average is 100)
Land area: 346.4 sq. mi. Water area: 0.1 sq. mi.
Population density: 4 people per square mile
(very low).
OSM Map
General Map
Google Map
MSN Map
OSM Map
General Map
Google Map
MSN Map
OSM Map
General Map
Google Map
MSN Map
OSM Map
General Map
Google Map
MSN Map
Please wait while loading the map...
Real estate property taxes paid for housing units in 2022:
This zip code:
0.4% ($1,875)
New Mexico:
0.7% ($1,638)
Median real estate property taxes paid for housing units with mortgages in 2022: $1,745 (0.3%) Median real estate property taxes paid for housing units with no mortgage in 2022: $2,465 (0.6%)
Estimated median house/condo value in 2022: $464,479
87025:
$464,479
New Mexico:
$243,100
Median resident age:
This zip code:
54.0 years
New Mexico median age:
39.4 years
Average household size:
This zip code:
1.9 people
New Mexico:
2.4 people
Averages for the 2020 tax year for zip code 87025, filed in 2021:
Average Adjusted Gross Income (AGI) in 2020: $80,730 (Individual Income Tax Returns)
Here:
$80,730
State:
$59,146
Salary/wage: $75,192 (reported on 70.2% of returns)
Here:
$75,192
State:
$48,327
(% of AGI for various income ranges: 675.0% for AGIs below $25k, 3447.1% for AGIs $25k-50k, 5036.0% for AGIs $50k-75k, 11260.0% for AGIs $75k-100k, 15247.0% for AGIs $100k-200k)
Taxable interest for individuals: $467 (reported on 47.4% of returns)
This zip code:
$467
New Mexico:
$1,616
(% of AGI for various income ranges: 9.0% for AGIs below $25k, 38.6% for AGIs $25k-50k, 26.0% for AGIs $50k-75k, 56.7% for AGIs $75k-100k, 48.0% for AGIs $100k-200k)
Ordinary dividends: $2,850 (reported on 24.6% of returns)
Here:
$2,850
State:
$7,816
(% of AGI for various income ranges: 66.0% for AGIs below $25k, 96.0% for AGIs $50k-75k, 285.0% for AGIs $100k-200k)
Net capital gain/loss in AGI: +$9,631 (reported on 22.8% of returns)
Here:
+$9,631
State:
+$19,595
(% of AGI for various income ranges: 71.0% for AGIs below $25k, 348.0% for AGIs $50k-75k, 1007.0% for AGIs $100k-200k)
Profit/loss from business: +$5,127 (reported on 19.3% of returns)
Here:
+$5,127
State:
+$11,430
(% of AGI for various income ranges: 83.0% for AGIs below $25k, 107.1% for AGIs $25k-50k, 406.0% for AGIs $100k-200k)
Taxable individual retirement arrangement distribution: $21,514 (reported on 12.3% of returns)
87025:
$21,514
New Mexico:
$20,970
(% of AGI for various income ranges: 117.0% for AGIs below $25k, 1080.0% for AGIs $50k-75k, 849.0% for AGIs $100k-200k)
Total itemized deductions: $27,200 (reported on 8.8% of returns)
Here:
$27,200
State:
$33,187
(% of AGI for various income ranges: 1360.0% for AGIs $100k-200k)
Charity contributions: $7,450 (reported on 7.0% of returns)
Here:
$7,450
State:
$11,850
(% of AGI for various income ranges: 298.0% for AGIs $100k-200k)
Taxes paid: $7,760 (reported on 8.8% of returns)
87025:
$7,760
State:
$7,150
(% of AGI for various income ranges: 388.0% for AGIs $100k-200k)
Earned income credit: $1,640 (reported on 8.8% of returns)
Here:
$1,640
State:
$2,323
(% of AGI for various income ranges: 82.0% for AGIs below $25k)
Percentage of individuals using paid preparers for their 2020 taxes: 91.2%
Here:
91%
State:
92%
(% for various income ranges: 86.7% for AGIs below $25k, 90.0% for AGIs $25k-50k, 100.0% for AGIs $50k-75k, 83.3% for AGIs $75k-100k, 93.8% for AGIs $100k-200k, 100.0% for AGIs over 200k)
Averages for the 2012 tax year for zip code 87025, filed in 2013:
Average Adjusted Gross Income (AGI) in 2012: $65,402 (Individual Income Tax Returns)
Here:
$65,402
State:
$50,343
Salary/wage: $62,640 (reported on 74.1% of returns)
Here:
$62,640
State:
$41,171
(% of AGI for various income ranges: 62.2% for AGIs below $25k, 67.0% for AGIs $25k-50k, 66.7% for AGIs $50k-75k, 70.9% for AGIs $75k-100k, 96.2% for AGIs $100k-200k)
Taxable interest for individuals: $980 (reported on 51.7% of returns)
This zip code:
$980
New Mexico:
$1,677
(% of AGI for various income ranges: 2.1% for AGIs below $25k, 1.6% for AGIs $25k-50k, 0.7% for AGIs $50k-75k, 0.3% for AGIs $75k-100k, 0.8% for AGIs $100k-200k)
Ordinary dividends: $2,285 (reported on 22.4% of returns)
Here:
$2,285
State:
$6,939
(% of AGI for various income ranges: 4.4% for AGIs below $25k, 0.6% for AGIs $50k-75k, 0.9% for AGIs $75k-100k, 0.8% for AGIs $100k-200k)
Profit/loss from business: +$3,058 (reported on 20.7% of returns)
Here:
+$3,058
State:
+$11,059
(% of AGI for various income ranges: 9.6% for AGIs below $25k, 1.4% for AGIs $50k-75k, 0.6% for AGIs $100k-200k)
Taxable individual retirement arrangement distribution: $12,900 (reported on 10.3% of returns)
87025:
$12,900
New Mexico:
$15,706
Total itemized deductions: $20,486 (19% of AGI, reported on 37.9% of returns)
Here:
$20,486
State:
$21,709
Here:
18.6% of AGI
State:
19.8% of AGI
(% of AGI for various income ranges: 13.2% for AGIs $25k-50k, 8.8% for AGIs $50k-75k, 11.0% for AGIs $75k-100k, 18.1% for AGIs $100k-200k)
Charity contributions: $3,188 (reported on 29.3% of returns)
Here:
$3,188
State:
$4,195
(% of AGI for various income ranges: 0.9% for AGIs $50k-75k, 1.4% for AGIs $75k-100k, 2.6% for AGIs $100k-200k)
Taxes paid: $6,145 (reported on 37.9% of returns)
87025:
$6,145
State:
$6,176
(% of AGI for various income ranges: 2.3% for AGIs $25k-50k, 2.1% for AGIs $50k-75k, 3.3% for AGIs $75k-100k, 6.1% for AGIs $100k-200k)
Earned income credit: $1,760 (reported on 8.6% of returns)
Here:
$1,760
State:
$2,311
(% of AGI for various income ranges: 4.6% for AGIs below $25k)
Percentage of individuals using paid preparers for their 2012 taxes: 41.4%
Here:
41%
State:
50%
(% for various income ranges: 35.3% for AGIs below $25k, 50.0% for AGIs $25k-50k, 40.0% for AGIs $50k-75k, 42.9% for AGIs $75k-100k, 50.0% for AGIs $100k-200k)
Averages for the 2004 tax year for zip code 87025, filed in 2005:
Average Adjusted Gross Income (AGI) in 2004: $52,954 (Individual Income Tax Returns)
Here:
$52,954
State:
$39,572
Salary/wage: $52,707 (reported on 81.4% of returns)
Here:
$52,707
State:
$34,237
(% of AGI for various income ranges: 101.8% for AGIs below $10k, 68.0% for AGIs $10k-25k, 79.1% for AGIs $25k-50k, 74.5% for AGIs $50k-75k, 81.8% for AGIs $75k-100k, 85.3% for AGIs over 100k)
Taxable interest for individuals: $845 (reported on 67.8% of returns)
This zip code:
$845
New Mexico:
$1,873
(% of AGI for various income ranges: 6.0% for AGIs below $10k, 5.5% for AGIs $10k-25k, 1.1% for AGIs $25k-50k, 0.8% for AGIs $50k-75k, 0.7% for AGIs $75k-100k, 0.5% for AGIs over 100k)
Taxable dividends: $1,104 (reported on 26.4% of returns)
Here:
$1,104
State:
$3,554
(% of AGI for various income ranges: 2.9% for AGIs below $10k, 1.1% for AGIs $10k-25k, 0.6% for AGIs $25k-50k, 0.3% for AGIs $50k-75k, 0.5% for AGIs $75k-100k, 0.5% for AGIs over 100k)
Net capital gain/loss: +$2,633 (reported on 18.3% of returns)
Here:
+$2,633
State:
+$10,425
(% of AGI for various income ranges: 2.9% for AGIs below $10k, -0.9% for AGIs $10k-25k, 0.0% for AGIs $25k-50k, 0.4% for AGIs $50k-75k, 0.2% for AGIs $75k-100k, 1.9% for AGIs over 100k)
Profit/loss from business: +$4,630 (reported on 18.2% of returns)
Here:
+$4,630
State:
+$8,875
(% of AGI for various income ranges: 19.2% for AGIs below $10k, 5.6% for AGIs $10k-25k, 2.1% for AGIs $25k-50k, 1.3% for AGIs $50k-75k, 1.4% for AGIs $75k-100k, 0.5% for AGIs over 100k)
IRA payment deduction: $2,056 (reported on 2.7% of returns)
87025:
$2,056
New Mexico:
$2,940
Total itemized deductions: $17,465 (22% of AGI, reported on 46.0% of returns)
Here:
$17,465
State:
$18,103
Here:
21.7% of AGI
State:
21.5% of AGI
(% of AGI for various income ranges: 24.0% for AGIs $10k-25k, 14.5% for AGIs $25k-50k, 14.9% for AGIs $50k-75k, 14.8% for AGIs $75k-100k, 14.8% for AGIs over 100k)
Charity contributions deductions: $2,128 (2% of AGI, reported on 37.1% of returns)
Here:
$2,128
State:
$3,246
Here:
2.5% of AGI
State:
3.6% of AGI
(% of AGI for various income ranges: 0.5% for AGIs $10k-25k, 1.3% for AGIs $25k-50k, 2.0% for AGIs $50k-75k, 1.7% for AGIs $75k-100k, 1.4% for AGIs over 100k)
Total tax: $7,389 (reported on 84.0% of returns)
87025:
$7,389
State:
$6,237
(% of AGI for various income ranges: 4.2% for AGIs below $10k, 4.9% for AGIs $10k-25k, 7.6% for AGIs $25k-50k, 10.0% for AGIs $50k-75k, 12.0% for AGIs $75k-100k, 14.9% for AGIs over 100k)
Earned income credit: $1,219 (reported on 11.1% of returns)
Here:
$1,219
State:
$1,796
Percentage of individuals using paid preparers for their 2004 taxes: 39.5%
Here:
40%
State:
57%
(% for various income ranges: 36.8% for AGIs below $10k, 43.6% for AGIs $10k-25k, 45.2% for AGIs $25k-50k, 40.2% for AGIs $50k-75k, 35.5% for AGIs $75k-100k, 33.0% for AGIs over 100k)
Household received Food Stamps/SNAP in the past 12 months: 54 Household did not receive Food Stamps/SNAP in the past 12 months: 675
Women who had a birth in the past 12 months: 3 (4 now married, 0 unmarried) Women who did not have a birth in the past 12 months: 343 (227 now married, 111 unmarried)
Housing units in zip code 87025 with a mortgage: 397 Median monthly owner costs for units with a mortgage: $2,082 Median monthly owner costs for units without a mortgage: $564
Residents with income below the poverty level in 2022:
This zip code:
6.5%
Whole state:
17.6%
Residents with income below 50% of the poverty level in 2022:
This zip code:
4.0%
Whole state:
9.7%
Median number of rooms in houses and condos:
Here:
5.9
State:
5.9
Median number of rooms in apartments:
Here:
9.8
State:
4.2
Notable locations in this zip code not listed on our city pages
Notable locations in zip code 87025: APS Camp (A), Headquarters Ranch (B), Fenton Ranch (C), Evans-Griffin Place (D), Cañada Cabin (E), Bruce Place (F), Jemez Falls Campgrounds (G), Albemarle (H), Rancho Cañada (I), Redondo Campground (J), Rio las Vacas Cabin (K), Rio las Vacas Campground (L), San Antonio Campground (M), Seven Springs Campground (N), Tent Rock Ranch (O), Triple H Ranch (P), East Fork Recreation Site (Q), Jemez Falls Campground (R), Indian Head Picnic Ground (S), King Tut (T). Display/hide their locations on the map
Streams, rivers, and creeks: Turkey Creek (A), Trail Creek (B), Rito del Indio (C), Rito de las Palomas (D), Rio de las Vacas (E), East Fork Jemez River (F), Jaramillo Creek (G), La Jara Creek (H), Redondo Creek (I). Display/hide their locations on the map
Parks in zip code 87025 include: Fenton Lake State Park (1), Valle Grande Historical Marker (2), Soda Dam Historical Marker (3), Jemez Mountains Historical Marker (4), Fenton Lake State Park (5), Jemez State Monument (6). Display/hide their locations on the map
In group quarters: 46 (-1 institutionalized population)
Size of family households: 398 2-persons, 66 3-persons, 43 4-persons, 8 5-persons
Size of nonfamily households: 219 1-person, 6 2-persons
160 married couples with children.
0 single-parent households ().
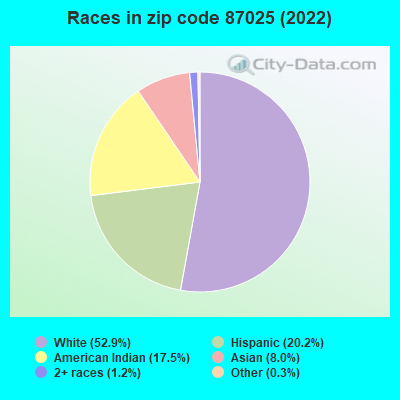
60.4% of residents of 87025 zip code speak English at home.
14.6% of residents speak Spanish at home (77% very well, 23% well).
2.4% of residents speak other Indo-European language at home (81% very well, 19% well).
5.4% of residents speak Asian or Pacific Island language at home (100% well).
10.9% of residents speak other language at home (11% very well, 89% well).
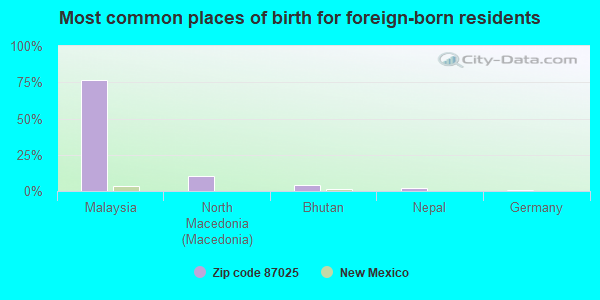
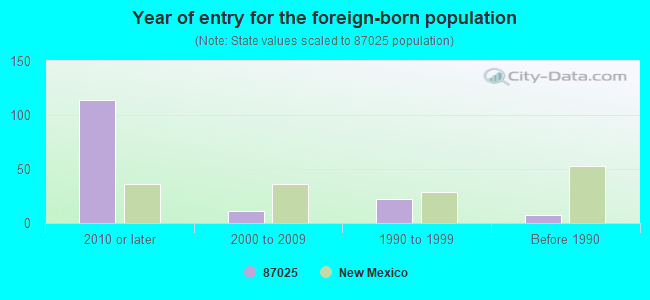
Foreign born population: 141 (9.6%) (24.0% of them are naturalized citizens)
This zip code:
9.6%
Whole state:
9.3%
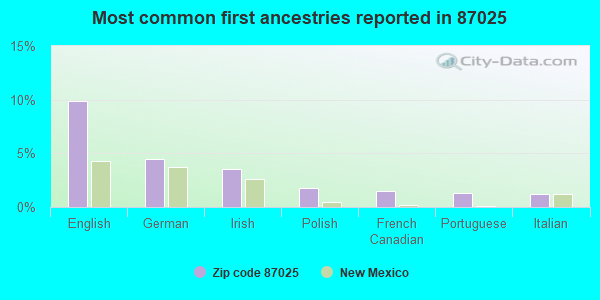
77%Malaysia
11%North Macedonia (Macedonia)
4%Bhutan
2%Nepal
1%Germany
10%English
4%German
4%Irish
2%Polish
1%French Canadian
1%Portuguese
1%Italian
Year of entry for the foreign-born population
1142010 or later
112000 to 2009
221990 to 1999
7Before 1990
Facilities with environmental interests located in this zip code:
JEMEZ SPRINGS, VILLAGE OF (SEC. 34, T18 N, R2 E, AND SEC. 3, T17 N, R2 E in JEMEZ SPRINGS, NM)
(Integrated Compliance Information System) - ICIS-06-1998-0483, FORMAL ENFORCEMENT ACTION National Pollutant Discharge Elimination System NON-MAJOR (Tracking pollutant discharge elimination systems) - permit - ICIS-, ENFORCEMENT/COMPLIANCE ACTIVITY, ICIS-06-2005-1803, ICIS-, Business SIC classification: SEWERAGE SYSTEMS Alternative names: VILLAGE OF JEMEZ SPRINGS
JEMEZ MOUNTAIN ELECTRIC COOP (PO BOX 126 in JEMEZ SPRINGS, NM)
(Resource Conservation and Recovery Act (tracking hazardous waste))
GTE (CONTEL) SWITCHING STATION (17786 HWY 4 in JEMEZ SPRINGS, NM)
COMPLIANCE ACTIVITY (Tracking inspections of insecticide, fungicide, and rodenticide, and toxic substances) Business SIC classification: TELEPHONE COMMUNICATIONS, EXCEPT RADIOTELEPHONE
Housing units lacking complete plumbing facilities: 4.2% Housing units lacking complete kitchen facilities: 5.0%
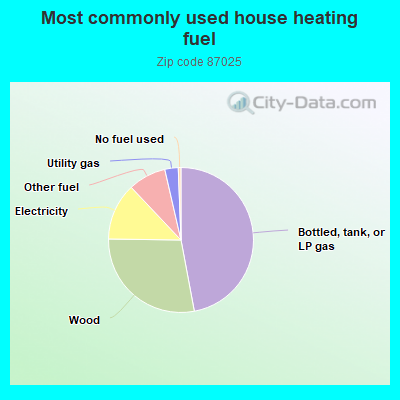
47.3%Bottled, tank, or LP gas
28.3%Wood
12.8%Electricity
8.5%Other fuel
3.0%Utility gas
0.6%No fuel used
Population in 1990: 1. Population change in the 1990s: +1,357 (+135700.0%).
Place of birth for U.S.-born residents:
This state: 596
Northeast: 162
Midwest: 212
South: 219
West: 136
60% of the 87025 zip code residents lived in the same house 5 years ago. Out of people who lived in different houses, 15% lived in this county. Out of people who lived in different counties, 50% lived in New Mexico.
83% of the 87025 zip code residents lived in the same house 1 year ago. Out of people who lived in different houses, 6% moved from this county. Out of people who lived in different houses, 18% moved from different county within same state. Out of people who lived in different houses, 87% moved from different state.
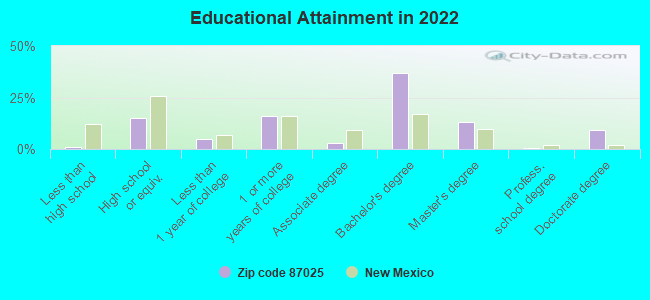
Private vs. public school enrollment:
Students in private schools in grades 1 to 8 (elementary and middle school): 1
Here:
100.0%
New Mexico:
10.2%
Students in private schools in grades 9 to 12 (high school): 3
Here:
2.0%
New Mexico:
10.0%
Students in private undergraduate colleges:
Here:
0.0%
New Mexico:
12.3%
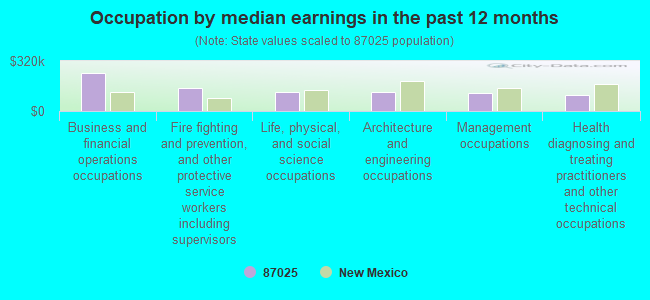
Occupation by median earnings in the past 12 months ($)
242,066Business and financial operations occupations
149,480Fire fighting and prevention, and other protective service workers including supervisors
120,189Life, physical, and social science occupations
119,704Architecture and engineering occupations
113,695Management occupations
104,441Health diagnosing and treating practitioners and other technical occupations
Top industries in this zip code by the number of employees in 2005:
Construction: New Single-Family Housing Construction (except Operative Builders) (10-19: 1, 1-4: 1)
Finance and Insurance: Credit Unions (10-19: 1)
Other Services (except Public Administration): Other Similar Organizations (except Business, Professional, Labor, and Political Organizations) (5-9: 1)
Accommodation and Food Services: Recreational and Vacation Camps (except Campgrounds) (5-9: 1)
Utilities: Electric Power Distribution (5-9: 1)
Accommodation and Food Services: Bed-and-Breakfast Inns (1-4: 2)
Other Services (except Public Administration): Religious Organizations (1-4: 2)
Educational Services: Business and Secretarial Schools (1-4: 1)
Information: Internet Service Providers (1-4: 1)
People in group quarters in 2010:
26 people in other noninstitutional facilities
People in group quarters in 2000:
78 people in religious group quarters
Fatal accident statistics in 2013:
Fatal accident count: 2
Vehicles involved in fatal accidents: 3
Fatal accidents caused by drunken drivers: 0
Fatalities: 2
Persons involved in fatal accidents: 3
Pedestrians involved in fatal accidents: 1
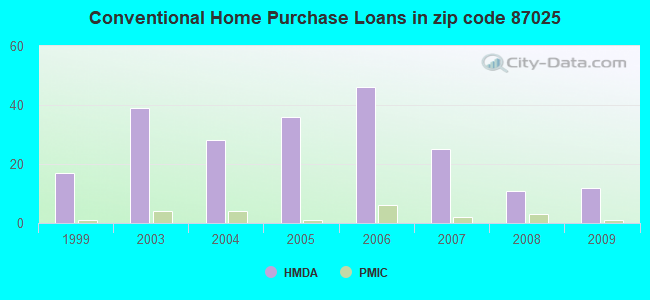
Home Mortgage Disclosure Act Aggregated Statistics For Year 2009 (Based on 4 partial tracts)
A) FHA, FSA/RHS & VA Home Purchase Loans
B) Conventional Home Purchase Loans
C) Refinancings
D) Home Improvement Loans
F) Non-occupant Loans on < 5 Family Dwellings (A B C & D)
G) Loans On Manufactured Home Dwelling (A B C & D)
Number
Average Value
Number
Average Value
Number
Average Value
Number
Average Value
Number
Average Value
Number
Average Value
LOANS ORIGINATED
3
$132,150
12
$140,141
62
$163,474
2
$8,355
13
$132,369
8
$86,504
APPLICATIONS APPROVED, NOT ACCEPTED
0
$0
3
$132,547
11
$213,361
1
$150,420
2
$187,680
1
$213,100
APPLICATIONS DENIED
1
$39,000
3
$118,853
14
$228,921
5
$78,160
3
$148,797
6
$113,030
APPLICATIONS WITHDRAWN
1
$176,120
5
$155,014
13
$158,661
1
$1,390
5
$173,542
2
$101,675
FILES CLOSED FOR INCOMPLETENESS
0
$0
0
$0
2
$104,810
1
$105,160
0
$0
0
$0
Aggregated Statistics For Year 2008 (Based on 4 partial tracts)
A) FHA, FSA/RHS & VA Home Purchase Loans
B) Conventional Home Purchase Loans
C) Refinancings
D) Home Improvement Loans
F) Non-occupant Loans on < 5 Family Dwellings (A B C & D)
G) Loans On Manufactured Home Dwelling (A B C & D)
Number
Average Value
Number
Average Value
Number
Average Value
Number
Average Value
Number
Average Value
Number
Average Value
LOANS ORIGINATED
5
$137,870
11
$186,342
29
$162,688
1
$18,010
9
$159,476
7
$119,681
APPLICATIONS APPROVED, NOT ACCEPTED
1
$87,050
1
$205,430
2
$116,995
1
$2,090
1
$247,210
1
$51,530
APPLICATIONS DENIED
1
$137,190
5
$100,198
16
$161,224
3
$24,373
2
$182,245
9
$86,849
APPLICATIONS WITHDRAWN
0
$0
1
$222,330
7
$205,213
1
$126,050
2
$125,095
1
$83,570
FILES CLOSED FOR INCOMPLETENESS
0
$0
0
$0
1
$188,720
0
$0
0
$0
0
$0
Aggregated Statistics For Year 2007 (Based on 4 partial tracts)
A) FHA, FSA/RHS & VA Home Purchase Loans
B) Conventional Home Purchase Loans
C) Refinancings
D) Home Improvement Loans
F) Non-occupant Loans on < 5 Family Dwellings (A B C & D)
G) Loans On Manufactured Home Dwelling (A B C & D)
Number
Average Value
Number
Average Value
Number
Average Value
Number
Average Value
Number
Average Value
Number
Average Value
LOANS ORIGINATED
2
$132,315
25
$155,298
39
$140,994
8
$73,349
7
$158,381
9
$72,833
APPLICATIONS APPROVED, NOT ACCEPTED
1
$131,620
5
$221,808
6
$165,288
2
$85,240
3
$194,993
2
$104,460
APPLICATIONS DENIED
1
$210,310
6
$136,793
18
$172,622
6
$41,640
1
$140,640
7
$114,050
APPLICATIONS WITHDRAWN
1
$77,300
4
$222,655
15
$166,657
3
$145,083
3
$191,277
1
$142,760
FILES CLOSED FOR INCOMPLETENESS
0
$0
1
$208,220
2
$205,785
0
$0
0
$0
0
$0
Aggregated Statistics For Year 2006 (Based on 4 partial tracts)
A) FHA, FSA/RHS & VA Home Purchase Loans
B) Conventional Home Purchase Loans
C) Refinancings
D) Home Improvement Loans
F) Non-occupant Loans on < 5 Family Dwellings (A B C & D)
G) Loans On Manufactured Home Dwelling (A B C & D)
Number
Average Value
Number
Average Value
Number
Average Value
Number
Average Value
Number
Average Value
Number
Average Value
LOANS ORIGINATED
1
$41,090
46
$145,613
45
$156,526
14
$48,449
19
$124,619
8
$107,332
APPLICATIONS APPROVED, NOT ACCEPTED
0
$0
7
$114,056
2
$144,655
3
$15,787
2
$188,185
2
$122,020
APPLICATIONS DENIED
0
$0
5
$137,124
24
$139,611
20
$56,222
7
$100,533
12
$98,076
APPLICATIONS WITHDRAWN
0
$0
4
$152,865
20
$175,284
3
$155,993
2
$204,400
2
$66,990
FILES CLOSED FOR INCOMPLETENESS
0
$0
0
$0
3
$183,617
1
$34,820
0
$0
0
$0
Aggregated Statistics For Year 2005 (Based on 4 partial tracts)
A) FHA, FSA/RHS & VA Home Purchase Loans
B) Conventional Home Purchase Loans
C) Refinancings
D) Home Improvement Loans
F) Non-occupant Loans on < 5 Family Dwellings (A B C & D)
G) Loans On Manufactured Home Dwelling (A B C & D)
Number
Average Value
Number
Average Value
Number
Average Value
Number
Average Value
Number
Average Value
Number
Average Value
LOANS ORIGINATED
1
$314,080
36
$120,933
54
$120,354
4
$37,605
14
$116,471
12
$71,431
APPLICATIONS APPROVED, NOT ACCEPTED
1
$149,730
5
$150,396
14
$113,584
1
$34,120
1
$68,940
5
$50,758
APPLICATIONS DENIED
0
$0
9
$145,013
34
$131,022
9
$56,072
3
$106,083
9
$90,384
APPLICATIONS WITHDRAWN
0
$0
6
$108,407
16
$173,706
3
$274,847
1
$568,960
1
$115,600
FILES CLOSED FOR INCOMPLETENESS
0
$0
0
$0
3
$172,707
0
$0
0
$0
0
$0
Aggregated Statistics For Year 2004 (Based on 4 partial tracts)
A) FHA, FSA/RHS & VA Home Purchase Loans
B) Conventional Home Purchase Loans
C) Refinancings
D) Home Improvement Loans
F) Non-occupant Loans on < 5 Family Dwellings (A B C & D)
G) Loans On Manufactured Home Dwelling (A B C & D)
Number
Average Value
Number
Average Value
Number
Average Value
Number
Average Value
Number
Average Value
Number
Average Value
LOANS ORIGINATED
1
$127,530
28
$131,992
50
$136,880
7
$18,371
8
$123,262
14
$107,527
APPLICATIONS APPROVED, NOT ACCEPTED
1
$88,440
5
$117,144
6
$137,537
1
$3,480
3
$112,353
3
$79,853
APPLICATIONS DENIED
0
$0
5
$67,444
18
$117,887
5
$14,856
1
$10,450
8
$58,779
APPLICATIONS WITHDRAWN
0
$0
0
$0
17
$162,338
1
$14,620
1
$134,410
1
$164,350
FILES CLOSED FOR INCOMPLETENESS
0
$0
0
$0
5
$121,420
0
$0
0
$0
2
$103,335
Aggregated Statistics For Year 2003 (Based on 4 partial tracts)
A) FHA, FSA/RHS & VA Home Purchase Loans
B) Conventional Home Purchase Loans
C) Refinancings
D) Home Improvement Loans
F) Non-occupant Loans on < 5 Family Dwellings (A B C & D)
Number
Average Value
Number
Average Value
Number
Average Value
Number
Average Value
Number
Average Value
LOANS ORIGINATED
2
$140,675
39
$122,164
128
$134,639
6
$12,418
16
$105,156
APPLICATIONS APPROVED, NOT ACCEPTED
0
$0
2
$78,695
4
$169,400
2
$38,300
1
$68,940
APPLICATIONS DENIED
1
$87,750
12
$62,045
44
$161,179
7
$12,127
1
$172,010
APPLICATIONS WITHDRAWN
0
$0
4
$153,208
26
$153,047
1
$4,870
1
$139,280
FILES CLOSED FOR INCOMPLETENESS
0
$0
0
$0
5
$111,882
1
$17,410
1
$55,710
Aggregated Statistics For Year 1999 (Based on 2 partial tracts)
A) FHA, FSA/RHS & VA Home Purchase Loans
B) Conventional Home Purchase Loans
C) Refinancings
D) Home Improvement Loans
F) Non-occupant Loans on < 5 Family Dwellings (A B C & D)
Detailed PMIC statistics for the following Tracts:0101.01
, 0103.01
2002 - 2018 National Fire Incident Reporting System (NFIRS) incidents
Based on the data from the years 2002 - 2018 the average number of fire incidents per year is 7. The highest number of reported fires - 29 took place in 2016, and the least - 0 in 2004. The data has a growing trend.
When looking into fire subcategories, the most reports belonged to: Outside Fires (49.6%), and Other (25.2%).
Fire incident types reported to NFIRS in Zip Code 87025

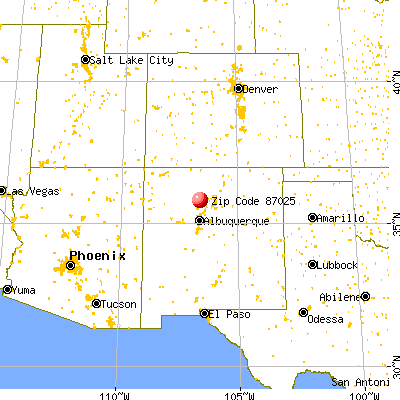


 Nearest zip codes: 87044, 87024, 87012, 87072, 87041, 87544.


 Based on the data from the years 2002 - 2018 the average number of fire incidents per year is 7. The highest number of reported fires - 29 took place in 2016, and the least - 0 in 2004. The data has a growing trend.
 When looking into fire subcategories, the most reports belonged to: Outside Fires (49.6%), and Other (25.2%).