Estimated zip code population in 2022: 3,547 Zip code population in 2010: 3,303 Zip code population in 2000: 3,478
Houses and condos: 1,147 Renter-occupied apartments: 190
% of renters here:
18%
State:
29%
March 2022 cost of living index in zip code 87937: 83.7 (less than average, U.S. average is 100)
Land area: 178.8 sq. mi. Water area: 0.7 sq. mi.
Population density: 20 people per square mile
(very low).
OSM Map
General Map
Google Map
MSN Map
OSM Map
General Map
Google Map
MSN Map
OSM Map
General Map
Google Map
MSN Map
OSM Map
General Map
Google Map
MSN Map
Please wait while loading the map...
Real estate property taxes paid for housing units in 2022:
This zip code:
0.5% ($542)
New Mexico:
0.7% ($1,638)
Median real estate property taxes paid for housing units with mortgages in 2022: $645 (0.4%) Median real estate property taxes paid for housing units with no mortgage in 2022: $455 (0.4%)
Business Search- 14 Million verified businesses
Males: 1,712
(48.3%)
Females: 1,835
(51.7%)
For population 25 years and over in 87937:
High school or higher: 60.2%
Bachelor's degree or higher: 9.4%
Graduate or professional degree: 2.4%
Unemployed: 11.4%
Mean travel time to work (commute): 18.8 minutes
For population 15 years and over in 87937:
Never married: 37.6%
Now married: 48.3%
Separated: 0.4%
Widowed: 6.3%
Divorced: 7.4%
Zip code 87937 compared to state average:
Median house value below state average.
Unemployed percentage above state average.
Black race population percentage significantly below state average.
Hispanic race population percentage above state average.
Foreign-born population percentage significantly above state average.
Renting percentage below state average.
Percentage of population with a bachelor's degree or higher significantly below state average.
Averages for the 2020 tax year for zip code 87937, filed in 2021:
Average Adjusted Gross Income (AGI) in 2020: $33,342 (Individual Income Tax Returns)
Here:
$33,342
State:
$59,146
Salary/wage: $25,388 (reported on 86.0% of returns)
Here:
$25,388
State:
$48,327
(% of AGI for various income ranges: 1448.8% for AGIs below $25k, 3345.3% for AGIs $25k-50k, 5645.5% for AGIs $50k-75k, 7605.0% for AGIs $75k-100k, 22950.0% for AGIs $100k-200k)
Taxable interest for individuals: $643 (reported on 9.3% of returns)
This zip code:
$643
New Mexico:
$1,616
(% of AGI for various income ranges: 2.5% for AGIs below $25k, 2.4% for AGIs $25k-50k, 12.7% for AGIs $50k-75k, 275.0% for AGIs $100k-200k)
Ordinary dividends: $1,533 (reported on 2.0% of returns)
Here:
$1,533
State:
$7,816
(% of AGI for various income ranges: 41.8% for AGIs $50k-75k)
Net capital gain/loss in AGI: +$12,700 (reported on 2.7% of returns)
Here:
+$12,700
State:
+$19,595
(% of AGI for various income ranges: 2540.0% for AGIs $100k-200k)
Profit/loss from business: +$10,625 (reported on 8.0% of returns)
Here:
+$10,625
State:
+$11,430
(% of AGI for various income ranges: 80.2% for AGIs below $25k, 170.6% for AGIs $25k-50k, 252.7% for AGIs $50k-75k)
Earned income credit: $2,528 (reported on 38.7% of returns)
Here:
$2,528
State:
$2,323
(% of AGI for various income ranges: 178.5% for AGIs below $25k, 158.2% for AGIs $25k-50k)
Percentage of individuals using paid preparers for their 2020 taxes: 91.3%
Here:
91%
State:
92%
(% for various income ranges: 90.0% for AGIs below $25k, 90.9% for AGIs $25k-50k, 93.8% for AGIs $50k-75k, 100.0% for AGIs $75k-100k, 100.0% for AGIs $100k-200k)
Averages for the 2012 tax year for zip code 87937, filed in 2013:
Average Adjusted Gross Income (AGI) in 2012: $26,306 (Individual Income Tax Returns)
Here:
$26,306
State:
$50,343
Salary/wage: $22,237 (reported on 87.1% of returns)
Here:
$22,237
State:
$41,171
(% of AGI for various income ranges: 78.6% for AGIs below $25k, 84.5% for AGIs $25k-50k, 78.5% for AGIs $50k-75k, 64.7% for AGIs $75k-100k, 40.4% for AGIs $100k-200k)
Taxable interest for individuals: $900 (reported on 15.7% of returns)
This zip code:
$900
New Mexico:
$1,677
(% of AGI for various income ranges: 0.3% for AGIs below $25k, 0.2% for AGIs $25k-50k, 0.9% for AGIs $50k-75k, 1.7% for AGIs $100k-200k)
Ordinary dividends: $1,440 (reported on 3.6% of returns)
Here:
$1,440
State:
$6,939
Net capital gain/loss in AGI: +$4,120 (reported on 3.6% of returns)
Here:
+$4,120
State:
+$14,311
Profit/loss from business: +$5,800 (reported on 8.6% of returns)
Here:
+$5,800
State:
+$11,059
(% of AGI for various income ranges: 4.1% for AGIs below $25k, 2.1% for AGIs $25k-50k, 0.5% for AGIs $50k-75k)
Taxable individual retirement arrangement distribution: $6,950 (reported on 2.9% of returns)
87937:
$6,950
New Mexico:
$15,706
Total itemized deductions: $21,467 (26% of AGI, reported on 6.4% of returns)
Here:
$21,467
State:
$21,709
Here:
25.9% of AGI
State:
19.8% of AGI
(% of AGI for various income ranges: 3.7% for AGIs $25k-50k, 10.4% for AGIs $50k-75k, 15.6% for AGIs $100k-200k)
Charity contributions: $4,840 (reported on 3.6% of returns)
Here:
$4,840
State:
$4,195
Taxes paid: $5,112 (reported on 5.7% of returns)
87937:
$5,112
State:
$6,176
(% of AGI for various income ranges: 0.5% for AGIs $25k-50k, 2.4% for AGIs $50k-75k, 3.7% for AGIs $100k-200k)
Earned income credit: $2,502 (reported on 44.3% of returns)
Here:
$2,502
State:
$2,311
(% of AGI for various income ranges: 11.9% for AGIs below $25k, 3.2% for AGIs $25k-50k)
Percentage of individuals using paid preparers for their 2012 taxes: 78.6%
Here:
79%
State:
50%
(% for various income ranges: 77.6% for AGIs below $25k, 79.5% for AGIs $25k-50k, 77.8% for AGIs $50k-75k, 75.0% for AGIs $75k-100k, 100.0% for AGIs $100k-200k)
Averages for the 2004 tax year for zip code 87937, filed in 2005:
Average Adjusted Gross Income (AGI) in 2004: $22,819 (Individual Income Tax Returns)
Here:
$22,819
State:
$39,572
Salary/wage: $19,665 (reported on 89.0% of returns)
Here:
$19,665
State:
$34,237
(% of AGI for various income ranges: 140.4% for AGIs below $10k, 83.3% for AGIs $10k-25k, 83.2% for AGIs $25k-50k, 77.6% for AGIs $50k-75k, 72.2% for AGIs $75k-100k, 40.9% for AGIs over 100k)
Taxable interest for individuals: $3,217 (reported on 15.9% of returns)
This zip code:
$3,217
New Mexico:
$1,873
(% of AGI for various income ranges: 4.1% for AGIs below $10k, 0.8% for AGIs $10k-25k, 1.2% for AGIs $25k-50k, 7.4% for AGIs $50k-75k, 0.7% for AGIs $75k-100k, 2.8% for AGIs over 100k)
Taxable dividends: $1,506 (reported on 7.3% of returns)
Here:
$1,506
State:
$3,554
(% of AGI for various income ranges: 1.2% for AGIs below $10k, 0.7% for AGIs $10k-25k, 0.1% for AGIs $25k-50k, 0.3% for AGIs $50k-75k, 0.7% for AGIs over 100k)
Net capital gain/loss: +$2,272 (reported on 7.7% of returns)
Here:
+$2,272
State:
+$10,425
(% of AGI for various income ranges: -1.1% for AGIs below $10k, -0.1% for AGIs $10k-25k, 0.2% for AGIs $25k-50k, -0.4% for AGIs $50k-75k, 4.5% for AGIs over 100k)
Profit/loss from business: +$3,111 (reported on 10.6% of returns)
Here:
+$3,111
State:
+$8,875
(% of AGI for various income ranges: 2.3% for AGIs below $10k, 2.1% for AGIs $10k-25k, 2.6% for AGIs $25k-50k, -0.7% for AGIs $50k-75k)
Total itemized deductions: $16,863 (25% of AGI, reported on 8.0% of returns)
Here:
$16,863
State:
$18,103
Here:
24.8% of AGI
State:
21.5% of AGI
(% of AGI for various income ranges: 2.6% for AGIs $10k-25k, 5.0% for AGIs $25k-50k, 7.0% for AGIs $50k-75k, 10.6% for AGIs $75k-100k, 11.6% for AGIs over 100k)
Charity contributions deductions: $3,343 (5% of AGI, reported on 5.6% of returns)
Here:
$3,343
State:
$3,246
Here:
4.6% of AGI
State:
3.6% of AGI
Total tax: $3,419 (reported on 45.8% of returns)
87937:
$3,419
State:
$6,237
(% of AGI for various income ranges: 2.3% for AGIs below $10k, 2.2% for AGIs $10k-25k, 4.3% for AGIs $25k-50k, 8.2% for AGIs $50k-75k, 11.2% for AGIs $75k-100k, 17.0% for AGIs over 100k)
Earned income credit: $2,081 (reported on 45.4% of returns)
Here:
$2,081
State:
$1,796
Percentage of individuals using paid preparers for their 2004 taxes: 76.8%
Here:
77%
State:
57%
(% for various income ranges: 75.4% for AGIs below $10k, 77.4% for AGIs $10k-25k, 76.7% for AGIs $25k-50k, 79.6% for AGIs $50k-75k, 77.8% for AGIs $75k-100k, 84.0% for AGIs over 100k)
Household received Food Stamps/SNAP in the past 12 months: 355 Household did not receive Food Stamps/SNAP in the past 12 months: 725
Women who had a birth in the past 12 months: 54 (43 now married, 13 unmarried) Women who did not have a birth in the past 12 months: 927 (311 now married, 617 unmarried)
Housing units in zip code 87937 with a mortgage: 231 Houses without a mortgage: 28
Median monthly owner costs for units with a mortgage: $945 Median monthly owner costs for units without a mortgage: $281
Residents with income below the poverty level in 2022:
This zip code:
35.5%
Whole state:
17.6%
Residents with income below 50% of the poverty level in 2022:
This zip code:
31.7%
Whole state:
9.7%
Median number of rooms in houses and condos:
Here:
5.1
State:
5.9
Median number of rooms in apartments:
Here:
4.3
State:
4.2
Notable locations in this zip code not listed on our city pages
Notable locations in zip code 87937: Las Uvas Ranch (A), Middle Ranch Windmill (B), Sierra Alta Ranch (C), Escondido Ranch (D), Hatch Weather Station (E), Hermantano Springs Ranch (F), Horse Canyon Ranch (G), Ben Archer Health Center Library (H), Hatch Public Library (I), Hatch Volunteer Fire Department (J), Hatch Ambulance (K), Pelham House (L). Display/hide their locations on the map
Churches in zip code 87937 include: First Assembly of God Church (A), Saint Francis de Sales Church Historic Site (B), La Capilla de Don Silverio (C), First Baptist Church (D), Church of God (E), Church of Christ (F). Display/hide their locations on the map
Lakes and reservoirs: Kerr Tank (A), Alamo Tank (B), Augustine Tank (C), Blanco Tank (D), Brewster Tank (E), South Kight Tank (F), Chivatos Canyon Tank (G), Green Tree Tank (H). Display/hide their locations on the map
Streams, rivers, and creeks: Hersey Arroyo (A), Arroyo Cuervo (B), Berrenda Creek (C), Arroyo Yeso (D), Arroyo Angostura (E), Placitas Arroyo (F). Display/hide their locations on the map
In group quarters: 31 (-1 institutionalized population)
Size of family households: 138 2-persons, 138 3-persons, 106 4-persons, 192 5-persons, 67 6-persons, 24 7-or-more-persons
Size of nonfamily households: 318 1-person, 72 2-persons
619 married couples with children.
226 single-parent households (96 men, 130 women).
33.2% of residents of 87937 zip code speak English at home.
64.7% of residents speak Spanish at home (64% very well, 18% well, 10% not well, 8% not at all).
0.6% of residents speak other Indo-European language at home (100% very well).
Foreign born population: 995 (28.1%) (37.9% of them are naturalized citizens)
This zip code:
28.1%
Whole state:
9.3%
88%Honduras
9%United Kingdom, excluding England and Scotland
9%Sweden
3%English
3%British
1%Irish
1%German
1%Greek
1%Romanian
0%American
Year of entry for the foreign-born population
2122010 or later
2342000 to 2009
1511990 to 1999
414Before 1990
Facilities with environmental interests located in this zip code:
ACE ALT COMPLEX EDU ( in HATCH, NM)
(National Center for Education Statistics) - STATE ID-18131002 Organizations: HATCH VALLEY MUNICIPAL SCHOOLS (SCHOOL DISTRICT)
HATCH VALLEY ELEMENTARY (SCHOOL & HALL ST. in HATCH, NM)
(National Center for Education Statistics) - STATE ID-18131057 Organizations: HATCH VALLEY MUNICIPAL SCHOOLS (SCHOOL DISTRICT)
HATCH VALLEY HIGH (MAIN AND KEED in HATCH, NM)
(National Center for Education Statistics) - STATE ID-18131058 Organizations: HATCH VALLEY MUNICIPAL SCHOOLS (SCHOOL DISTRICT)
HATCH VALLEY MID SCH (2000 HERRARA ST. in HATCH, NM)
(National Center for Education Statistics) - STATE ID-18131050 Organizations: HATCH VALLEY MUNICIPAL SCHOOLS (SCHOOL DISTRICT)
RIO GRANDE ELEMENTARY (2002 HERRARA ST. in HATCH, NM)
(National Center for Education Statistics) - STATE ID-18131001 Organizations: HATCH VALLEY MUNICIPAL SCHOOLS (SCHOOL DISTRICT)
HATCH VALLEY SCHOOLS (609 FRANKLIN in HATCH, NM)
AIR MINOR (AIRS/AFS)
COLONIAS (201 W HALL in HATCH, NM)
CRITERIA AND HAZARDOUS AIR POLLUTANT INVENTORY (Inventory of air pollution sources) Business SIC classification: REFUSE SYSTEMS Business NAICS classification: SOLID WASTE LANDFILL.
FORMER FARMERS MARKET AND SUPPLY COMPANY PROPERTIES (121 NORTH MAIN STREET AND 117 NORTH in HATCH, NM)
SUPERFUND (Superfund database)
RC VILEGAS AND SONS - 350TPH HMA PLANT (PORTABLE SOURCE in PORTABLE SOURCE, NM)
AIR SYNTHETIC MINOR (AIRS/AFS) Business SIC classification: ASPHALT PAVING MIXTURES AND BLOCKS Alternative names: RC VILEGAS & SONS PORTABLE ASPHALT PLANT, RC VILEGAS & SONS RC VILEGAS AND SONS -
Housing units lacking complete plumbing facilities: 10.3% Housing units lacking complete kitchen facilities: 3.6%
50.3%Utility gas
42.0%Electricity
7.1%Bottled, tank, or LP gas
0.7%Wood
Population in 1990: 2,314. Population change in the 1990s: +1,164 (+50.3%).
Place of birth for U.S.-born residents:
This state: 1,778
Northeast: 51
Midwest: 111
South: 381
West: 209
63% of the 87937 zip code residents lived in the same house 5 years ago. Out of people who lived in different houses, 73% lived in this county. Out of people who lived in different counties, 50% lived in New Mexico.
99% of the 87937 zip code residents lived in the same house 1 year ago. Out of people who lived in different houses, 124% moved from this county. Out of people who lived in different houses, 5% moved from different state.
Private vs. public school enrollment:
Students in private schools in grades 1 to 8 (elementary and middle school):
Here:
0.0%
New Mexico:
10.2%
Students in private schools in grades 9 to 12 (high school):
Here:
0.0%
New Mexico:
10.0%
Students in private undergraduate colleges: 54
Here:
36.1%
New Mexico:
12.3%
Occupation by median earnings in the past 12 months ($)
63,350Management occupations
54,161Installation, maintenance, and repair occupations
52,767Transportation occupations
38,480Office and administrative support occupations
36,643Sales and related occupations
34,690Community and social service occupations
Companies with federal contracts located in this zip code:
CORROSION SERVICE INC (47130 W HIGHWAY 26 in HATCH, NM; small business) : $59,836 in 15 contractsfrom 2001 to 2005
Contracts for Books and Pamphlets, Maintenance, Repair and Rebuilding of Equipment -- Instruments and Laboratory Equipment, Maintenance, Repair or Alteration of Real Property -- Water Supply Facilities by Army Signed by year:2000: $0; 2001: $16,600; 2002: $12,425; 2003: $53,865; 2004: -$24,564; 2005: $1,510; 2006: $0.
Biggest contracts:
$27,760 with Army for Books and Pamphlets. Taking place in AZ. Signed on 2003-12-17. Completion date: 2003-09-30.
$27,100, same as above.Signed on 2002-12-19. Completion date: 2003-09-30.
$26,105, same as above.Signed on 2003-09-28. Completion date: 2003-09-30.
$16,600 with Army for Maintenance, Repair and Rebuilding of Equipment -- Instruments and Laboratory Equipment. Taking place in AZ. Signed on 2001-12-13. Completion date: 2002-09-30.
Top industries in this zip code by the number of employees in 2005:
Health Care and Social Assistance: All Other Outpatient Care Centers (50-99 employees: 1 establishment)
Health Care and Social Assistance: Ambulance Services (20-49: 1)
Accommodation and Food Services: Full-Service Restaurants (10-19: 1, 1-4: 2)
Accommodation and Food Services: Limited-Service Restaurants (10-19: 1, 1-4: 2)
Wholesale Trade: Fresh Fruit and Vegetable Merchant Wholesalers (5-9: 2)
People in group quarters in 2010:
25 people in workers' group living quarters and job corps centers
Fatal accident statistics in 2014:
Fatal accident count: 1
Vehicles involved in fatal accidents: 2
Fatal accidents caused by drunken drivers: 1
Fatalities: 2
Persons involved in fatal accidents: 5
Pedestrians involved in fatal accidents: 0
Fatal accident statistics in 2011:
Fatal accident count: 1
Vehicles involved in fatal accidents: 2
Fatal accidents caused by drunken drivers: 0
Fatalities: 1
Persons involved in fatal accidents: 3
Pedestrians involved in fatal accidents: 0
Home Mortgage Disclosure Act Aggregated Statistics For Year 2009 (Based on 4 partial tracts)
A) FHA, FSA/RHS & VA Home Purchase Loans
B) Conventional Home Purchase Loans
C) Refinancings
D) Home Improvement Loans
F) Non-occupant Loans on < 5 Family Dwellings (A B C & D)
G) Loans On Manufactured Home Dwelling (A B C & D)
Number
Average Value
Number
Average Value
Number
Average Value
Number
Average Value
Number
Average Value
Number
Average Value
LOANS ORIGINATED
10
$221,779
29
$202,920
119
$216,203
8
$110,065
12
$204,135
12
$55,750
APPLICATIONS APPROVED, NOT ACCEPTED
0
$0
6
$109,397
11
$184,275
3
$44,220
2
$120,850
4
$85,190
APPLICATIONS DENIED
1
$176,220
13
$71,252
40
$182,815
14
$16,163
5
$101,016
14
$65,425
APPLICATIONS WITHDRAWN
1
$231,480
3
$226,040
32
$193,547
6
$42,057
1
$124,390
4
$70,948
FILES CLOSED FOR INCOMPLETENESS
0
$0
0
$0
6
$192,910
1
$42,950
0
$0
0
$0
Aggregated Statistics For Year 2008 (Based on 4 partial tracts)
A) FHA, FSA/RHS & VA Home Purchase Loans
B) Conventional Home Purchase Loans
C) Refinancings
D) Home Improvement Loans
F) Non-occupant Loans on < 5 Family Dwellings (A B C & D)
G) Loans On Manufactured Home Dwelling (A B C & D)
Number
Average Value
Number
Average Value
Number
Average Value
Number
Average Value
Number
Average Value
Number
Average Value
LOANS ORIGINATED
11
$156,861
44
$153,011
84
$220,298
48
$35,939
22
$148,378
44
$31,638
APPLICATIONS APPROVED, NOT ACCEPTED
1
$83,990
5
$107,758
8
$266,258
3
$39,907
0
$0
3
$58,043
APPLICATIONS DENIED
3
$92,497
15
$126,137
61
$142,282
33
$27,282
6
$211,575
25
$69,694
APPLICATIONS WITHDRAWN
0
$0
9
$108,611
21
$239,149
7
$42,000
1
$39,470
7
$48,744
FILES CLOSED FOR INCOMPLETENESS
0
$0
1
$148,580
5
$122,656
1
$14,320
2
$142,055
0
$0
Aggregated Statistics For Year 2007 (Based on 4 partial tracts)
A) FHA, FSA/RHS & VA Home Purchase Loans
B) Conventional Home Purchase Loans
C) Refinancings
D) Home Improvement Loans
F) Non-occupant Loans on < 5 Family Dwellings (A B C & D)
G) Loans On Manufactured Home Dwelling (A B C & D)
Number
Average Value
Number
Average Value
Number
Average Value
Number
Average Value
Number
Average Value
Number
Average Value
LOANS ORIGINATED
9
$142,442
81
$191,238
97
$174,651
40
$15,272
24
$171,257
65
$39,393
APPLICATIONS APPROVED, NOT ACCEPTED
2
$162,965
12
$249,528
24
$178,361
3
$38,640
1
$159,910
5
$96,002
APPLICATIONS DENIED
3
$81,617
22
$138,711
71
$163,160
18
$52,518
11
$185,187
31
$64,109
APPLICATIONS WITHDRAWN
2
$191,095
13
$132,041
28
$141,815
7
$44,677
3
$181,330
10
$45,884
FILES CLOSED FOR INCOMPLETENESS
0
$0
2
$133,320
6
$221,885
0
$0
1
$145,690
0
$0
Aggregated Statistics For Year 2006 (Based on 4 partial tracts)
A) FHA, FSA/RHS & VA Home Purchase Loans
B) Conventional Home Purchase Loans
C) Refinancings
D) Home Improvement Loans
E) Loans on Dwellings For 5+ Families
F) Non-occupant Loans on < 5 Family Dwellings (A B C & D)
G) Loans On Manufactured Home Dwelling (A B C & D)
Number
Average Value
Number
Average Value
Number
Average Value
Number
Average Value
Number
Average Value
Number
Average Value
Number
Average Value
LOANS ORIGINATED
17
$128,709
88
$187,222
96
$173,931
43
$29,192
0
$0
28
$169,090
54
$41,324
APPLICATIONS APPROVED, NOT ACCEPTED
0
$0
13
$144,728
13
$101,783
6
$93,968
0
$0
4
$142,905
7
$73,431
APPLICATIONS DENIED
1
$57,260
29
$144,990
70
$117,527
20
$36,873
1
$190,880
9
$155,684
34
$56,488
APPLICATIONS WITHDRAWN
1
$150,170
15
$104,032
48
$145,087
8
$52,622
0
$0
5
$99,376
12
$61,723
FILES CLOSED FOR INCOMPLETENESS
0
$0
1
$341,110
9
$148,941
0
$0
0
$0
0
$0
1
$89,100
Aggregated Statistics For Year 2005 (Based on 4 partial tracts)
A) FHA, FSA/RHS & VA Home Purchase Loans
B) Conventional Home Purchase Loans
C) Refinancings
D) Home Improvement Loans
E) Loans on Dwellings For 5+ Families
F) Non-occupant Loans on < 5 Family Dwellings (A B C & D)
G) Loans On Manufactured Home Dwelling (A B C & D)
Number
Average Value
Number
Average Value
Number
Average Value
Number
Average Value
Number
Average Value
Number
Average Value
Number
Average Value
LOANS ORIGINATED
9
$107,302
101
$149,207
95
$139,302
32
$28,017
0
$0
36
$101,088
46
$34,532
APPLICATIONS APPROVED, NOT ACCEPTED
0
$0
12
$136,886
12
$124,332
1
$111,850
0
$0
4
$105,992
7
$70,093
APPLICATIONS DENIED
1
$113,820
23
$98,399
56
$96,576
18
$31,997
1
$47,720
5
$50,604
35
$57,943
APPLICATIONS WITHDRAWN
0
$0
13
$100,584
45
$124,196
8
$66,502
0
$0
2
$94,670
10
$54,006
FILES CLOSED FOR INCOMPLETENESS
0
$0
1
$174,400
4
$171,688
1
$38,500
0
$0
0
$0
0
$0
Aggregated Statistics For Year 2004 (Based on 4 partial tracts)
A) FHA, FSA/RHS & VA Home Purchase Loans
B) Conventional Home Purchase Loans
C) Refinancings
D) Home Improvement Loans
F) Non-occupant Loans on < 5 Family Dwellings (A B C & D)
G) Loans On Manufactured Home Dwelling (A B C & D)
Number
Average Value
Number
Average Value
Number
Average Value
Number
Average Value
Number
Average Value
Number
Average Value
LOANS ORIGINATED
9
$115,729
71
$154,061
113
$132,113
21
$14,761
18
$125,287
33
$41,718
APPLICATIONS APPROVED, NOT ACCEPTED
0
$0
13
$103,755
14
$107,931
1
$135,900
0
$0
5
$42,566
APPLICATIONS DENIED
1
$126,520
19
$60,521
63
$83,492
16
$17,802
5
$24,722
42
$51,080
APPLICATIONS WITHDRAWN
1
$76,100
11
$127,651
51
$100,005
4
$63,182
1
$229,220
10
$60,304
FILES CLOSED FOR INCOMPLETENESS
0
$0
0
$0
5
$111,072
0
$0
0
$0
0
$0
Aggregated Statistics For Year 2003 (Based on 4 partial tracts)
A) FHA, FSA/RHS & VA Home Purchase Loans
B) Conventional Home Purchase Loans
C) Refinancings
D) Home Improvement Loans
F) Non-occupant Loans on < 5 Family Dwellings (A B C & D)
Number
Average Value
Number
Average Value
Number
Average Value
Number
Average Value
Number
Average Value
LOANS ORIGINATED
7
$90,563
58
$109,711
146
$125,538
31
$11,405
14
$80,296
APPLICATIONS APPROVED, NOT ACCEPTED
0
$0
5
$67,390
22
$129,482
0
$0
2
$184,880
APPLICATIONS DENIED
3
$99,017
19
$106,296
71
$99,853
13
$9,714
8
$156,195
APPLICATIONS WITHDRAWN
2
$69,620
17
$81,625
40
$111,971
7
$24,320
4
$154,830
FILES CLOSED FOR INCOMPLETENESS
0
$0
2
$127,205
8
$147,191
1
$36,690
0
$0
Aggregated Statistics For Year 2002 (Based on 4 partial tracts)
A) FHA, FSA/RHS & VA Home Purchase Loans
B) Conventional Home Purchase Loans
C) Refinancings
D) Home Improvement Loans
F) Non-occupant Loans on < 5 Family Dwellings (A B C & D)
Number
Average Value
Number
Average Value
Number
Average Value
Number
Average Value
Number
Average Value
LOANS ORIGINATED
6
$82,072
65
$91,585
127
$120,172
18
$14,183
11
$90,686
APPLICATIONS APPROVED, NOT ACCEPTED
2
$70,150
10
$65,138
24
$84,932
1
$17,310
0
$0
APPLICATIONS DENIED
2
$81,185
33
$55,902
55
$69,354
18
$9,973
6
$56,155
APPLICATIONS WITHDRAWN
1
$173,980
7
$66,897
34
$96,392
2
$5,935
1
$114,860
FILES CLOSED FOR INCOMPLETENESS
0
$0
0
$0
7
$96,151
0
$0
0
$0
Aggregated Statistics For Year 2001 (Based on 4 partial tracts)
A) FHA, FSA/RHS & VA Home Purchase Loans
B) Conventional Home Purchase Loans
C) Refinancings
D) Home Improvement Loans
F) Non-occupant Loans on < 5 Family Dwellings (A B C & D)
Number
Average Value
Number
Average Value
Number
Average Value
Number
Average Value
Number
Average Value
LOANS ORIGINATED
7
$98,857
61
$78,789
103
$111,315
50
$7,052
14
$77,594
APPLICATIONS APPROVED, NOT ACCEPTED
2
$48,675
17
$77,268
14
$89,889
0
$0
2
$254,295
APPLICATIONS DENIED
0
$0
61
$37,414
75
$64,681
28
$6,880
6
$44,095
APPLICATIONS WITHDRAWN
2
$94,010
16
$52,608
26
$90,120
9
$21,406
1
$45,420
FILES CLOSED FOR INCOMPLETENESS
0
$0
1
$199,770
8
$86,532
0
$0
0
$0
Aggregated Statistics For Year 2000 (Based on 4 partial tracts)
A) FHA, FSA/RHS & VA Home Purchase Loans
B) Conventional Home Purchase Loans
C) Refinancings
D) Home Improvement Loans
F) Non-occupant Loans on < 5 Family Dwellings (A B C & D)
Number
Average Value
Number
Average Value
Number
Average Value
Number
Average Value
Number
Average Value
LOANS ORIGINATED
7
$56,894
73
$64,121
41
$79,748
40
$10,386
13
$50,725
APPLICATIONS APPROVED, NOT ACCEPTED
7
$42,001
22
$46,939
15
$75,273
3
$29,627
1
$7,640
APPLICATIONS DENIED
20
$41,394
92
$39,478
43
$45,197
27
$8,892
7
$46,574
APPLICATIONS WITHDRAWN
10
$54,296
10
$33,855
17
$99,471
9
$6,873
0
$0
FILES CLOSED FOR INCOMPLETENESS
0
$0
0
$0
5
$80,906
0
$0
0
$0
Aggregated Statistics For Year 1999 (Based on 2 partial tracts)
A) FHA, FSA/RHS & VA Home Purchase Loans
B) Conventional Home Purchase Loans
C) Refinancings
D) Home Improvement Loans
F) Non-occupant Loans on < 5 Family Dwellings (A B C & D)
Detailed PMIC statistics for the following Tracts:0014.00
, 0015.00
2006 - 2018 National Fire Incident Reporting System (NFIRS) incidents
Based on the data from the years 2006 - 2018 the average number of fires per year is 19. The highest number of reported fire incidents - 46 took place in 2011, and the least - 8 in 2014. The data has a growing trend.
When looking into fire subcategories, the most incidents belonged to: Outside Fires (62.9%), and Structure Fires (22.2%).
Fire incident types reported to NFIRS in Zip Code 87937

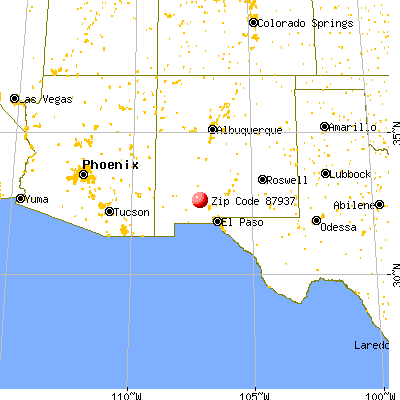


 Nearest zip codes: 87941, 87936, 87940, 87933, 88007, 88033.


 Based on the data from the years 2006 - 2018 the average number of fires per year is 19. The highest number of reported fire incidents - 46 took place in 2011, and the least - 8 in 2014. The data has a growing trend.
 When looking into fire subcategories, the most incidents belonged to: Outside Fires (62.9%), and Structure Fires (22.2%).