Estimated zip code population in 2022: 1,056 Zip code population in 2010: 1,400 Zip code population in 2000: 1,395
Houses and condos: 539 Renter-occupied apartments: 86
% of renters here:
21%
State:
40%
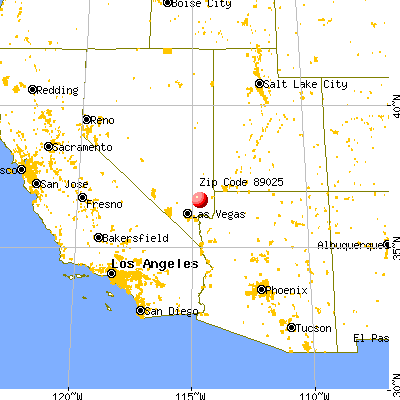
March 2022 cost of living index in zip code 89025: 91.7 (less than average, U.S. average is 100)
Land area: 651.4 sq. mi. Water area: 0.0 sq. mi.
Population density: 2 people per square mile
(very low).
OSM Map
General Map
Google Map
MSN Map
OSM Map
General Map
Google Map
MSN Map
OSM Map
General Map
Google Map
MSN Map
OSM Map
General Map
Google Map
MSN Map
Please wait while loading the map...
Real estate property taxes paid for housing units in 2022:
This zip code:
0.4% ($1,221)
Nevada:
0.4% ($1,889)
Median real estate property taxes paid for housing units with mortgages in 2022: $1,324 (0.3%) Median real estate property taxes paid for housing units with no mortgage in 2022: $1,150 (0.4%)
Estimated median house/condo value in 2022: $334,340
89025:
$334,340
Nevada:
$434,700
According to our research of Nevada and other state lists, there were 4 registered sex offenders living in 89025 zip code as of May 28, 2024. The ratio of all residents to sex offenders in zip code 89025 is 403 to 1. The ratio of registered sex offenders to all residents in this zip code is lower than the state average.
Median resident age:
This zip code:
42.3 years
Nevada median age:
39.0 years
Average household size:
This zip code:
2.6 people
Nevada:
2.6 people
Averages for the 2004 tax year for zip code 89025, filed in 2005:
Average Adjusted Gross Income (AGI) in 2004: $49,484 (Individual Income Tax Returns)
Here:
$49,484
State:
$58,367
Salary/wage: $38,467 (reported on 92.2% of returns)
Here:
$38,467
State:
$42,695
(% of AGI for various income ranges: 106.5% for AGIs below $10k, 89.8% for AGIs $10k-25k, 92.5% for AGIs $25k-50k, 83.9% for AGIs $50k-75k, 93.4% for AGIs $75k-100k, 36.6% for AGIs over 100k)
Taxable interest for individuals: $1,442 (reported on 31.4% of returns)
This zip code:
$1,442
Nevada:
$3,867
(% of AGI for various income ranges: 3.5% for AGIs below $10k, 0.3% for AGIs $10k-25k, 0.1% for AGIs $25k-50k, 0.1% for AGIs $50k-75k, 0.2% for AGIs $75k-100k, 2.2% for AGIs over 100k)
Taxable dividends: $550 (reported on 3.8% of returns)
Here:
$550
State:
$5,770
Net capital gain/loss: +$14,514 (reported on 6.7% of returns)
Here:
+$14,514
State:
+$50,644
Profit/loss from business: +$4,333 (reported on 11.4% of returns)
Here:
+$4,333
State:
+$13,618
(% of AGI for various income ranges: 14.2% for AGIs below $10k, 8.3% for AGIs $10k-25k, -0.7% for AGIs $50k-75k, 1.5% for AGIs $75k-100k)
Total itemized deductions: $21,068 (20% of AGI, reported on 27.8% of returns)
Here:
$21,068
State:
$22,990
Here:
20.4% of AGI
State:
21.8% of AGI
(% of AGI for various income ranges: 10.2% for AGIs $25k-50k, 15.4% for AGIs $50k-75k, 12.4% for AGIs $75k-100k, 13.9% for AGIs over 100k)
Charity contributions deductions: $7,238 (7% of AGI, reported on 24.8% of returns)
Here:
$7,238
State:
$3,443
Here:
6.7% of AGI
State:
3.1% of AGI
(% of AGI for various income ranges: 1.6% for AGIs $25k-50k, 3.2% for AGIs $50k-75k, 2.8% for AGIs $75k-100k, 6.5% for AGIs over 100k)
Total tax: $8,030 (reported on 70.7% of returns)
89025:
$8,030
State:
$10,585
(% of AGI for various income ranges: 3.5% for AGIs below $10k, 3.4% for AGIs $10k-25k, 5.5% for AGIs $25k-50k, 7.4% for AGIs $50k-75k, 10.0% for AGIs $75k-100k, 20.0% for AGIs over 100k)
Earned income credit: $1,768 (reported on 18.1% of returns)
Here:
$1,768
State:
$1,676
Percentage of individuals using paid preparers for their 2004 taxes: 64.0%
Here:
64%
State:
60%
(% for various income ranges: 64.4% for AGIs below $10k, 65.3% for AGIs $10k-25k, 66.0% for AGIs $25k-50k, 63.6% for AGIs $50k-75k, 53.8% for AGIs $75k-100k, 65.8% for AGIs over 100k)
Household received Food Stamps/SNAP in the past 12 months: 28 Household did not receive Food Stamps/SNAP in the past 12 months: 365
Women who did not have a birth in the past 12 months: 151 (61 now married, 90 unmarried)
Housing units in zip code 89025 with a mortgage: 166 Median monthly owner costs for units with a mortgage: $1,232 Median monthly owner costs for units without a mortgage: $339
Residents with income below the poverty level in 2022:
This zip code:
12.1%
Whole state:
12.5%
Residents with income below 50% of the poverty level in 2022:
This zip code:
8.0%
Whole state:
5.9%
Median number of rooms in houses and condos:
Here:
6.1
State:
6.0
Median number of rooms in apartments:
Here:
5.6
State:
4.2
Notable locations in this zip code not listed on our city pages
Notable locations in zip code 89025: Powers Ranch (A), West Ranch (B), Glendale Station (C), Mormon Pass Picnic Area (D), Home Ranch (E), Searles Ranch (F), Mormon Well Corral (G), Godfrey Ranch (H), Moapa Recreation Center (I), Clark County Fire Department Station 72 (J). Display/hide their locations on the map
Streams, rivers, and creeks: Wildcat Wash (A), Pahranagat Wash (B), Dead Man Wash (C), Muddy Wash (D), McKay Wash (E), Muddy River (F), Meadow Valley Wash (G), Battleship Wash (H). Display/hide their locations on the map
Size of family households: 129 2-persons, 74 3-persons, 78 4-persons, 24 5-persons
Size of nonfamily households: 83 1-person, 7 2-persons, 1 4-persons
112 married couples with children.
95 single-parent households (83 men, 12 women).
76.1% of residents of 89025 zip code speak English at home.
20.6% of residents speak Spanish at home (63% very well, 14% well, 12% not well, 11% not at all).
1.7% of residents speak Asian or Pacific Island language at home (100% very well).
1.2% of residents speak other language at home (83% very well, 17% well).
Foreign born population: 61 (5.9%) (52.1% of them are naturalized citizens)
This zip code:
5.9%
Whole state:
18.9%
93%Honduras
2%Czechoslovakia (includes Czech Republic and Slovakia)
6%English
4%Irish
4%Norwegian
Year of entry for the foreign-born population
72010 or later
252000 to 2009
31990 to 1999
25Before 1990
Facilities with environmental interests located in this zip code:
NEVADA POWER COMPANY REID GARDNER STATION (1 WALLY KAY WAY in MOAPA, NV)
AIR MAJOR (AIRS/AFS) AIR PROGRAM (Clean Air Markets Division Business System) (Integrated Compliance Information System) - ICIS-09-1987-0026, FORMAL ENFORCEMENT ACTION CRITERIA AND HAZARDOUS AIR POLLUTANT INVENTORY (Inventory of air pollution sources) AIR MAJOR ("Best Available" air pollution technologies tracking) HAZARDOUS WASTE BIENNIAL REPORTER (Resource Conservation and Recovery Act (tracking hazardous waste)) Small Quantity Generators, between 100 kg and 1000 kg of hazardous waste/month (Resource Conservation and Recovery Act (tracking hazardous waste)) TRI REPORTER (Tracking of toxic chemicals releasing facilities) Business SIC classification: ELECTRIC SERVICES Organizations: CALIFORNIA DEPT. OF WATER RESOURCES (CONTACT/OWNER)
Alternative names: NEVADA PWR CO./REID GARDNER STATION, NEVADA POWER CO REID GARDNER, NEVADA POWER- REID GARDNER #1,2,3, NEVADA POWER REID GARDNER STATION
UTE PERKINS ELEMENTARY SCHOOL (1255 PATRIOTS WAY in MOAPA, NV)
(Geographic Names Information System) (National Center for Education Statistics) - STATE ID-02-114 Organizations: CLARK CO SCH DIST (SCHOOL DISTRICT)
Alternative names: PERKINS, UTE ELEM
MOAPA VALLEY 3 (1000 HIDDEN VALLEY RD in MOAPA, NV)
National Pollutant Discharge Elimination System NON-MAJOR (Tracking pollutant discharge elimination systems) - permit National Pollutant Discharge Elimination System NON-MAJOR (Tracking pollutant discharge elimination systems) - permit Business SIC classification: DAIRY FARMS Alternative names: MOAPA VALLEY DAIRY 1&2
AMER TELE & TELE CO ARROW CANYON (12.4 MI SW OF MOAPA in MOAPA, NV)
(Resource Conservation and Recovery Act (tracking hazardous waste))
MOAPA BAND OF PAIUTES (1 LINCOLN ST in MOAPA, NV) . Tribal Land
(Resource Conservation and Recovery Act (tracking hazardous waste))
MICRON MINERALS CORP (HWY 168 in MOAPA, NV)
COMPLIANCE ACTIVITY (Tracking inspections of insecticide, fungicide, and rodenticide, and toxic substances) Business SIC classification: PRIMARY SMELTING AND REFINING OF NONFERROUS METALS, EXCEPT COPPER AND ALUMINUM
CRITERIA AND HAZARDOUS AIR POLLUTANT INVENTORY (Inventory of air pollution sources) Business SIC classification: REFUSE SYSTEMS Business NAICS classification: SOLID WASTE LANDFILL.
Housing units lacking complete plumbing facilities: 9.4% Housing units lacking complete kitchen facilities: 1.3%
93.6%Electricity
4.4%Bottled, tank, or LP gas
2.3%Wood
Place of birth for U.S.-born residents:
This state: 475
Midwest: 21
South: 146
West: 354
60% of the 89025 zip code residents lived in the same house 5 years ago. Out of people who lived in different houses, 61% lived in this county. Out of people who lived in different counties, 50% lived in Nevada.
89% of the 89025 zip code residents lived in the same house 1 year ago. Out of people who lived in different houses, 49% moved from this county. Out of people who lived in different houses, 54% moved from different state.
Private vs. public school enrollment:
Students in private schools in grades 1 to 8 (elementary and middle school): 23
Here:
15.4%
Nevada:
12.9%
Students in private schools in grades 9 to 12 (high school):
Here:
0.0%
Nevada:
6.9%
Students in private undergraduate colleges: 12
Here:
87.0%
Nevada:
16.0%
Occupation by median earnings in the past 12 months ($)
140,119Office and administrative support occupations
98,150Production occupations
76,869Sales and related occupations
45,621Business and financial operations occupations
43,874Education, training, and library occupations
41,652Building and grounds cleaning and maintenance occupations
Companies with federal contracts located in this zip code:
WISER CONSTRUCTION, LIMITED-LI (1501 STATE HWY 168 in MOAPA, NV; small business) : $44,546,461 in 40 contractsfrom 2002 to 2005
Contracts for Maintenance, Repair or Alteration of Real Property -- Other Non-Building Facilities, Construction of Structures and Facilities -- Recreation Facilities (Non-Building) by Army, U.S. Army Corps of Engineers - civil program financing only Signed by year:2000: $0; 2001: $0; 2002: $1,352,821; 2003: $14,328,490; 2004: $28,946,732; 2005: -$81,582; 2006: $0.
Biggest contracts:
$6,830,000 with Army for Maintenance, Repair or Alteration of Real Property -- Other Non-Building Facilities. Signed on 2004-02-24. Completion date: 2005-03-15.
$6,830,000 with U.S. Army Corps of Engineers - civil program financing only for Maintenance, Repair or Alteration of Real Property -- Other Non-Building Facilities. Signed on 2004-02-24. Completion date: 2005-03-15.
$4,936,490 with U.S. Army Corps of Engineers - civil program financing only for Construction of Structures and Facilities -- Recreation Facilities (Non-Building). Signed on 2003-03-11. Completion date: 2003-03-12.
$4,319,306 with U.S. Army Corps of Engineers - civil program financing only for Maintenance, Repair or Alteration of Real Property -- Other Non-Building Facilities. Signed on 2004-08-16. Completion date: 2005-03-15.
Top industries in this zip code by the number of employees in 2005:
Utilities: Fossil Fuel Electric Power Generation (100-249 employees: 1 establishment)
Construction: Highway, Street, and Bridge Construction (20-49: 1)
Other Services (except Public Administration): Commercial and Industrial Machinery and Equipment (except Automotive and Electronic) Repair and Maintenance (10-19: 1)
Accommodation and Food Services: Full-Service Restaurants (10-19: 1)
Fatal accident statistics in 2013:
Fatal accident count: 1
Vehicles involved in fatal accidents: 2
Fatal accidents caused by drunken drivers: 0
Fatalities: 1
Persons involved in fatal accidents: 3
Pedestrians involved in fatal accidents: 0
Fatal accident statistics in 2012:
Fatal accident count: 1
Vehicles involved in fatal accidents: 2
Fatal accidents caused by drunken drivers: 0
Fatalities: 1
Persons involved in fatal accidents: 4
Pedestrians involved in fatal accidents: 0
Home Mortgage Disclosure Act Aggregated Statistics For Year 2009 (Based on 2 partial tracts)
A) FHA, FSA/RHS & VA Home Purchase Loans
B) Conventional Home Purchase Loans
C) Refinancings
D) Home Improvement Loans
G) Loans On Manufactured Home Dwelling (A B C & D)
Number
Average Value
Number
Average Value
Number
Average Value
Number
Average Value
Number
Average Value
LOANS ORIGINATED
1
$194,080
1
$101,680
6
$140,318
0
$0
3
$97,483
APPLICATIONS APPROVED, NOT ACCEPTED
0
$0
0
$0
1
$351,400
0
$0
0
$0
APPLICATIONS DENIED
0
$0
0
$0
4
$261,400
0
$0
1
$209,320
APPLICATIONS WITHDRAWN
0
$0
0
$0
2
$194,250
1
$98,370
2
$106,480
FILES CLOSED FOR INCOMPLETENESS
0
$0
0
$0
0
$0
0
$0
0
$0
Aggregated Statistics For Year 2008 (Based on 2 partial tracts)
A) FHA, FSA/RHS & VA Home Purchase Loans
B) Conventional Home Purchase Loans
C) Refinancings
D) Home Improvement Loans
G) Loans On Manufactured Home Dwelling (A B C & D)
Number
Average Value
Number
Average Value
Number
Average Value
Number
Average Value
Number
Average Value
LOANS ORIGINATED
1
$201,040
1
$248,730
5
$239,326
0
$0
2
$232,170
APPLICATIONS APPROVED, NOT ACCEPTED
0
$0
0
$0
1
$130,820
0
$0
1
$67,560
APPLICATIONS DENIED
0
$0
0
$0
4
$234,738
1
$6,290
1
$125,860
APPLICATIONS WITHDRAWN
0
$0
0
$0
2
$314,805
0
$0
1
$71,210
FILES CLOSED FOR INCOMPLETENESS
0
$0
0
$0
0
$0
0
$0
0
$0
Aggregated Statistics For Year 2007 (Based on 2 partial tracts)
A) FHA, FSA/RHS & VA Home Purchase Loans
B) Conventional Home Purchase Loans
C) Refinancings
D) Home Improvement Loans
F) Non-occupant Loans on < 5 Family Dwellings (A B C & D)
G) Loans On Manufactured Home Dwelling (A B C & D)
Number
Average Value
Number
Average Value
Number
Average Value
Number
Average Value
Number
Average Value
Number
Average Value
LOANS ORIGINATED
1
$157,650
1
$307,020
10
$217,665
2
$44,545
0
$0
3
$166,593
APPLICATIONS APPROVED, NOT ACCEPTED
0
$0
0
$0
2
$167,255
0
$0
0
$0
0
$0
APPLICATIONS DENIED
0
$0
0
$0
8
$270,135
1
$99,030
0
$0
1
$262,640
APPLICATIONS WITHDRAWN
0
$0
1
$178,520
6
$203,743
0
$0
1
$103,330
1
$99,360
FILES CLOSED FOR INCOMPLETENESS
0
$0
0
$0
2
$254,525
0
$0
0
$0
0
$0
Aggregated Statistics For Year 2006 (Based on 2 partial tracts)
B) Conventional Home Purchase Loans
C) Refinancings
D) Home Improvement Loans
F) Non-occupant Loans on < 5 Family Dwellings (A B C & D)
G) Loans On Manufactured Home Dwelling (A B C & D)
Number
Average Value
Number
Average Value
Number
Average Value
Number
Average Value
Number
Average Value
LOANS ORIGINATED
7
$183,721
13
$201,242
3
$141,533
2
$184,480
6
$189,778
APPLICATIONS APPROVED, NOT ACCEPTED
2
$130,495
2
$226,870
0
$0
0
$0
0
$0
APPLICATIONS DENIED
1
$247,080
4
$485,622
2
$111,615
2
$367,630
1
$176,860
APPLICATIONS WITHDRAWN
0
$0
3
$177,853
0
$0
0
$0
0
$0
FILES CLOSED FOR INCOMPLETENESS
0
$0
1
$290,790
0
$0
0
$0
0
$0
Aggregated Statistics For Year 2005 (Based on 2 partial tracts)
B) Conventional Home Purchase Loans
C) Refinancings
D) Home Improvement Loans
F) Non-occupant Loans on < 5 Family Dwellings (A B C & D)
G) Loans On Manufactured Home Dwelling (A B C & D)
Number
Average Value
Number
Average Value
Number
Average Value
Number
Average Value
Number
Average Value
LOANS ORIGINATED
6
$233,330
10
$187,890
1
$200,710
1
$276,550
6
$144,955
APPLICATIONS APPROVED, NOT ACCEPTED
2
$174,210
2
$157,815
0
$0
0
$0
2
$103,830
APPLICATIONS DENIED
3
$259,550
8
$173,300
4
$102,175
0
$0
3
$138,773
APPLICATIONS WITHDRAWN
2
$153,180
7
$147,904
1
$221,900
0
$0
2
$152,520
FILES CLOSED FOR INCOMPLETENESS
1
$122,210
2
$183,155
0
$0
0
$0
0
$0
Aggregated Statistics For Year 2004 (Based on 2 partial tracts)
A) FHA, FSA/RHS & VA Home Purchase Loans
B) Conventional Home Purchase Loans
C) Refinancings
D) Home Improvement Loans
F) Non-occupant Loans on < 5 Family Dwellings (A B C & D)
G) Loans On Manufactured Home Dwelling (A B C & D)
Number
Average Value
Number
Average Value
Number
Average Value
Number
Average Value
Number
Average Value
Number
Average Value
LOANS ORIGINATED
2
$127,510
8
$150,034
9
$123,574
1
$50,340
2
$197,725
3
$96,930
APPLICATIONS APPROVED, NOT ACCEPTED
0
$0
4
$171,645
2
$120,225
1
$122,210
0
$0
1
$119,560
APPLICATIONS DENIED
0
$0
3
$166,483
7
$120,651
2
$18,050
0
$0
2
$37,755
APPLICATIONS WITHDRAWN
0
$0
1
$135,790
3
$144,513
0
$0
0
$0
1
$109,630
FILES CLOSED FOR INCOMPLETENESS
0
$0
1
$156,000
1
$51,000
0
$0
0
$0
0
$0
Aggregated Statistics For Year 2003 (Based on 2 partial tracts)
A) FHA, FSA/RHS & VA Home Purchase Loans
B) Conventional Home Purchase Loans
C) Refinancings
F) Non-occupant Loans on < 5 Family Dwellings (A B C & D)
Number
Average Value
Number
Average Value
Number
Average Value
Number
Average Value
LOANS ORIGINATED
1
$116,910
4
$161,378
13
$143,690
3
$135,130
APPLICATIONS APPROVED, NOT ACCEPTED
0
$0
0
$0
1
$199,380
0
$0
APPLICATIONS DENIED
0
$0
1
$137,120
5
$109,164
0
$0
APPLICATIONS WITHDRAWN
0
$0
1
$97,700
2
$154,505
0
$0
FILES CLOSED FOR INCOMPLETENESS
0
$0
1
$195,080
1
$138,440
1
$100,680
Aggregated Statistics For Year 1999 (Based on 1 partial tract)
A) FHA, FSA/RHS & VA Home Purchase Loans
B) Conventional Home Purchase Loans
C) Refinancings
D) Home Improvement Loans
F) Non-occupant Loans on < 5 Family Dwellings (A B C & D)


 Nearest zip codes: 89115, 89086, 89191, 89040, 89081, 89084.


