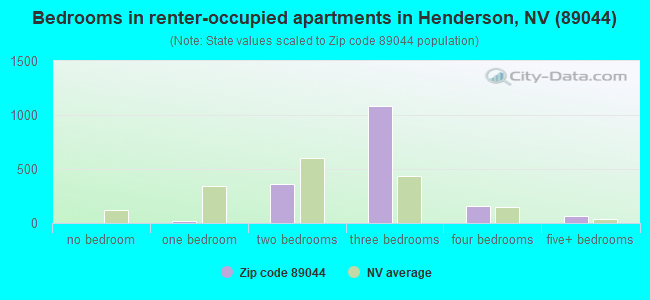
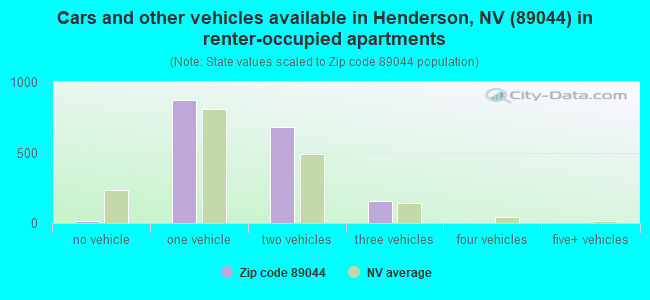
Houses and condos: 12,262 Renter-occupied apartments: 1,732
% of renters here:
15%
State:
40%
March 2022 cost of living index in zip code 89044: 94.9 (less than average, U.S. average is 100)
Land area: 31.4 sq. mi. Water area: 0.0 sq. mi.
Population density: 886 people per square mile
(low).
OSM Map
Google Map
MSN Map
OSM Map
General Map
Google Map
MSN Map
OSM Map
Google Map
MSN Map
OSM Map
Google Map
MSN Map
Please wait while loading the map...
Real estate property taxes paid for housing units in 2022:
This zip code:
0.5% ($2,957)
Nevada:
0.4% ($1,889)
Median real estate property taxes paid for housing units with mortgages in 2022: $3,076 (0.5%) Median real estate property taxes paid for housing units with no mortgage in 2022: $2,753 (0.5%)
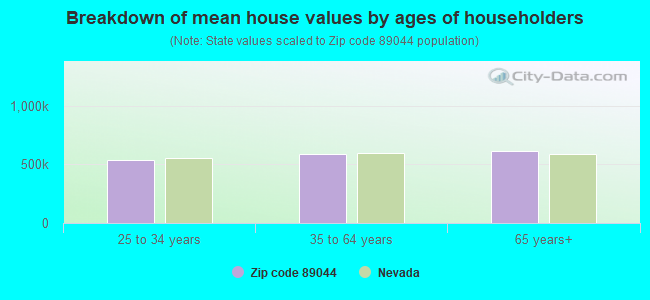
Estimated median house/condo value in 2022: $562,156
89044:
$562,156
Nevada:
$434,700
According to our research of Nevada and other state lists, there were 24 registered sex offenders living in 89044 zip code as of May 19, 2024. The ratio of all residents to sex offenders in zip code 89044 is 786 to 1. The ratio of registered sex offenders to all residents in this zip code is much lower than the state average.
Median resident age:
This zip code:
47.1 years
Nevada median age:
39.0 years
Average household size:
This zip code:
2.4 people
Nevada:
2.6 people
Averages for the 2020 tax year for zip code 89044, filed in 2021:
Average Adjusted Gross Income (AGI) in 2020: $110,380 (Individual Income Tax Returns)
Here:
$110,380
State:
$78,964
Salary/wage: $89,399 (reported on 70.3% of returns)
Here:
$89,399
State:
$54,472
(% of AGI for various income ranges: 986.0% for AGIs below $25k, 2918.5% for AGIs $25k-50k, 5224.2% for AGIs $50k-75k, 7877.4% for AGIs $75k-100k, 15878.2% for AGIs $100k-200k, 63376.9% for AGIs over 200k)
Taxable interest for individuals: $2,683 (reported on 42.8% of returns)
This zip code:
$2,683
Nevada:
$3,521
(% of AGI for various income ranges: 42.2% for AGIs below $25k, 50.4% for AGIs $25k-50k, 94.8% for AGIs $50k-75k, 121.5% for AGIs $75k-100k, 171.1% for AGIs $100k-200k, 1596.5% for AGIs over 200k)
Ordinary dividends: $8,564 (reported on 30.4% of returns)
Here:
$8,564
State:
$13,390
(% of AGI for various income ranges: 67.5% for AGIs below $25k, 87.8% for AGIs $25k-50k, 167.7% for AGIs $50k-75k, 198.8% for AGIs $75k-100k, 400.6% for AGIs $100k-200k, 4038.5% for AGIs over 200k)
Net capital gain/loss in AGI: +$27,724 (reported on 31.1% of returns)
Here:
+$27,724
State:
+$63,025
(% of AGI for various income ranges: 15.3% for AGIs below $25k, 68.8% for AGIs $25k-50k, 124.9% for AGIs $50k-75k, 213.9% for AGIs $75k-100k, 671.0% for AGIs $100k-200k, 19354.1% for AGIs over 200k)
Profit/loss from business: +$15,808 (reported on 17.4% of returns)
Here:
+$15,808
State:
+$11,500
(% of AGI for various income ranges: 102.5% for AGIs below $25k, 218.5% for AGIs $25k-50k, 181.2% for AGIs $50k-75k, 173.3% for AGIs $75k-100k, 525.3% for AGIs $100k-200k, 3446.1% for AGIs over 200k)
Taxable individual retirement arrangement distribution: $30,317 (reported on 16.4% of returns)
89044:
$30,317
Nevada:
$23,628
(% of AGI for various income ranges: 127.4% for AGIs below $25k, 250.4% for AGIs $25k-50k, 498.1% for AGIs $50k-75k, 762.1% for AGIs $75k-100k, 1109.4% for AGIs $100k-200k, 4839.6% for AGIs over 200k)
Self-employed (Keogh) retirement plans: $25,190 (reported on 0.7% of returns)
89044:
$25,190
Nevada:
$26,634
(% of AGI for various income ranges: 10.8% for AGIs below $25k, 22.6% for AGIs $100k-200k, 341.5% for AGIs over 200k)
Total itemized deductions: $36,092 (reported on 19.2% of returns)
Here:
$36,092
State:
$44,173
(% of AGI for various income ranges: 179.2% for AGIs below $25k, 354.5% for AGIs $25k-50k, 627.9% for AGIs $50k-75k, 862.8% for AGIs $75k-100k, 1403.5% for AGIs $100k-200k, 7850.6% for AGIs over 200k)
Charity contributions: $7,904 (reported on 16.0% of returns)
Here:
$7,904
State:
$12,589
(% of AGI for various income ranges: 8.3% for AGIs below $25k, 39.4% for AGIs $25k-50k, 67.5% for AGIs $50k-75k, 106.9% for AGIs $75k-100k, 238.6% for AGIs $100k-200k, 1890.0% for AGIs over 200k)
Taxes paid: $6,740 (reported on 19.1% of returns)
89044:
$6,740
State:
$6,112
(% of AGI for various income ranges: 31.0% for AGIs below $25k, 66.5% for AGIs $25k-50k, 129.1% for AGIs $50k-75k, 183.1% for AGIs $75k-100k, 319.3% for AGIs $100k-200k, 1162.0% for AGIs over 200k)
Earned income credit: $1,771 (reported on 6.2% of returns)
Here:
$1,771
State:
$2,214
(% of AGI for various income ranges: 49.0% for AGIs below $25k, 39.3% for AGIs $25k-50k)
Percentage of individuals using paid preparers for their 2020 taxes: 92.6%
Here:
93%
State:
93%
(% for various income ranges: 90.2% for AGIs below $25k, 93.4% for AGIs $25k-50k, 92.1% for AGIs $50k-75k, 93.4% for AGIs $75k-100k, 93.5% for AGIs $100k-200k, 93.1% for AGIs over 200k)
Averages for the 2012 tax year for zip code 89044, filed in 2013:
Average Adjusted Gross Income (AGI) in 2012: $92,449 (Individual Income Tax Returns)
Here:
$92,449
State:
$61,164
Salary/wage: $77,554 (reported on 71.1% of returns)
Here:
$77,554
State:
$45,924
(% of AGI for various income ranges: 51.5% for AGIs below $25k, 60.8% for AGIs $25k-50k, 61.2% for AGIs $50k-75k, 62.9% for AGIs $75k-100k, 64.4% for AGIs $100k-200k, 54.3% for AGIs over 200k)
Taxable interest for individuals: $2,328 (reported on 46.5% of returns)
This zip code:
$2,328
Nevada:
$3,137
(% of AGI for various income ranges: 2.9% for AGIs below $25k, 1.5% for AGIs $25k-50k, 1.1% for AGIs $50k-75k, 0.8% for AGIs $75k-100k, 0.8% for AGIs $100k-200k, 1.4% for AGIs over 200k)
Ordinary dividends: $7,243 (reported on 30.2% of returns)
Here:
$7,243
State:
$11,762
(% of AGI for various income ranges: 6.3% for AGIs below $25k, 3.3% for AGIs $25k-50k, 2.2% for AGIs $50k-75k, 1.5% for AGIs $75k-100k, 1.9% for AGIs $100k-200k, 2.6% for AGIs over 200k)
Net capital gain/loss in AGI: +$7,907 (reported on 27.4% of returns)
Here:
+$7,907
State:
+$33,127
(% of AGI for various income ranges: 0.2% for AGIs $50k-75k, 0.7% for AGIs $75k-100k, 1.5% for AGIs $100k-200k, 5.3% for AGIs over 200k)
Profit/loss from business: +$15,253 (reported on 15.2% of returns)
Here:
+$15,253
State:
+$12,567
(% of AGI for various income ranges: 8.1% for AGIs below $25k, 3.3% for AGIs $25k-50k, 2.1% for AGIs $50k-75k, 2.4% for AGIs $75k-100k, 1.9% for AGIs $100k-200k, 2.5% for AGIs over 200k)
Taxable individual retirement arrangement distribution: $25,162 (reported on 19.1% of returns)
89044:
$25,162
Nevada:
$20,808
(% of AGI for various income ranges: 8.2% for AGIs below $25k, 6.0% for AGIs $25k-50k, 5.5% for AGIs $50k-75k, 4.7% for AGIs $75k-100k, 6.1% for AGIs $100k-200k, 4.1% for AGIs over 200k)
Self-employment retirement plans: $20,338 (reported on 0.9% of returns)
89044:
$20,338
Nevada:
$22,197
Total itemized deductions: $28,172 (21% of AGI, reported on 51.5% of returns)
Here:
$28,172
State:
$26,148
Here:
21.3% of AGI
State:
20.0% of AGI
(% of AGI for various income ranges: 28.2% for AGIs below $25k, 17.6% for AGIs $25k-50k, 17.0% for AGIs $50k-75k, 16.3% for AGIs $75k-100k, 15.3% for AGIs $100k-200k, 13.9% for AGIs over 200k)
Charity contributions: $3,332 (reported on 44.0% of returns)
Here:
$3,332
State:
$4,329
(% of AGI for various income ranges: 1.4% for AGIs below $25k, 1.5% for AGIs $25k-50k, 1.7% for AGIs $50k-75k, 1.7% for AGIs $75k-100k, 1.7% for AGIs $100k-200k, 1.4% for AGIs over 200k)
Taxes paid: $5,982 (reported on 51.1% of returns)
89044:
$5,982
State:
$5,116
(% of AGI for various income ranges: 4.9% for AGIs below $25k, 3.3% for AGIs $25k-50k, 3.6% for AGIs $50k-75k, 3.5% for AGIs $75k-100k, 3.6% for AGIs $100k-200k, 2.8% for AGIs over 200k)
Earned income credit: $1,667 (reported on 6.5% of returns)
Here:
$1,667
State:
$2,279
(% of AGI for various income ranges: 2.6% for AGIs below $25k, 0.4% for AGIs $25k-50k)
Percentage of individuals using paid preparers for their 2012 taxes: 55.1%
Here:
55%
State:
55%
(% for various income ranges: 48.5% for AGIs below $25k, 50.6% for AGIs $25k-50k, 55.9% for AGIs $50k-75k, 58.0% for AGIs $75k-100k, 58.7% for AGIs $100k-200k, 73.2% for AGIs over 200k)
Averages for the 2004 tax year for zip code 89044, filed in 2005:
Average Adjusted Gross Income (AGI) in 2004: $76,409 (Individual Income Tax Returns)
Here:
$76,409
State:
$58,367
Salary/wage: $58,766 (reported on 81.0% of returns)
Here:
$58,766
State:
$42,695
(% of AGI for various income ranges: 402.8% for AGIs below $10k, 70.9% for AGIs $10k-25k, 73.4% for AGIs $25k-50k, 68.3% for AGIs $50k-75k, 69.3% for AGIs $75k-100k, 55.1% for AGIs over 100k)
Taxable interest for individuals: $2,349 (reported on 57.3% of returns)
This zip code:
$2,349
Nevada:
$3,867
(% of AGI for various income ranges: 58.3% for AGIs below $10k, 3.7% for AGIs $10k-25k, 1.3% for AGIs $25k-50k, 1.5% for AGIs $50k-75k, 2.6% for AGIs $75k-100k, 1.5% for AGIs over 100k)
Taxable dividends: $3,325 (reported on 30.7% of returns)
Here:
$3,325
State:
$5,770
(% of AGI for various income ranges: 25.0% for AGIs below $10k, 2.4% for AGIs $10k-25k, 1.2% for AGIs $25k-50k, 1.2% for AGIs $50k-75k, 1.2% for AGIs $75k-100k, 1.4% for AGIs over 100k)
Net capital gain/loss: +$28,807 (reported on 31.6% of returns)
Here:
+$28,807
State:
+$50,644
(% of AGI for various income ranges: 344.4% for AGIs below $10k, -0.4% for AGIs $10k-25k, 1.3% for AGIs $25k-50k, 2.6% for AGIs $50k-75k, 2.6% for AGIs $75k-100k, 20.5% for AGIs over 100k)
Profit/loss from business: +$17,383 (reported on 17.8% of returns)
Here:
+$17,383
State:
+$13,618
(% of AGI for various income ranges: 61.1% for AGIs below $10k, 2.3% for AGIs $10k-25k, 4.1% for AGIs $25k-50k, 3.5% for AGIs $50k-75k, 0.0% for AGIs $75k-100k, 5.5% for AGIs over 100k)
IRA payment deduction: $3,468 (reported on 4.2% of returns)
89044:
$3,468
Nevada:
$3,054
(% of AGI for various income ranges: 0.4% for AGIs $25k-50k, 0.2% for AGIs $50k-75k, 0.2% for AGIs $75k-100k, 0.1% for AGIs over 100k)
Self-employed pension: $13,062 (reported on 1.1% of returns)
Here:
$13,062
Nevada:
$16,706
Total itemized deductions: $23,643 (24% of AGI, reported on 58.0% of returns)
Here:
$23,643
State:
$22,990
Here:
23.9% of AGI
State:
21.8% of AGI
(% of AGI for various income ranges: 26.5% for AGIs $10k-25k, 21.8% for AGIs $25k-50k, 21.2% for AGIs $50k-75k, 19.2% for AGIs $75k-100k, 15.1% for AGIs over 100k)
Charity contributions deductions: $3,999 (4% of AGI, reported on 52.2% of returns)
Here:
$3,999
State:
$3,443
Here:
3.9% of AGI
State:
3.1% of AGI
(% of AGI for various income ranges: 2.0% for AGIs $10k-25k, 2.2% for AGIs $25k-50k, 2.3% for AGIs $50k-75k, 2.5% for AGIs $75k-100k, 3.1% for AGIs over 100k)
Total tax: $11,686 (reported on 88.9% of returns)
89044:
$11,686
State:
$10,585
(% of AGI for various income ranges: 13.9% for AGIs below $10k, 4.3% for AGIs $10k-25k, 7.1% for AGIs $25k-50k, 9.8% for AGIs $50k-75k, 11.6% for AGIs $75k-100k, 17.5% for AGIs over 100k)
Earned income credit: $1,246 (reported on 3.9% of returns)
Here:
$1,246
State:
$1,676
Percentage of individuals using paid preparers for their 2004 taxes: 63.6%
Here:
64%
State:
60%
(% for various income ranges: 40.4% for AGIs below $10k, 64.7% for AGIs $10k-25k, 57.1% for AGIs $25k-50k, 66.7% for AGIs $50k-75k, 62.9% for AGIs $75k-100k, 72.8% for AGIs over 100k)
Likely homosexual households (counted as self-reported same-sex unmarried-partner households)
Lesbian couples: 0.3% of all households
Gay men: 0.1% of all households
Household received Food Stamps/SNAP in the past 12 months: 265 Household did not receive Food Stamps/SNAP in the past 12 months: 11,082
Women who had a birth in the past 12 months: 221 (218 now married, 22 unmarried) Women who did not have a birth in the past 12 months: 4,922 (2,591 now married, 2,307 unmarried)
Housing units in zip code 89044 with a mortgage: 7,002 (386 second mortgage, 11 home equity loan, 353 both second mortgage and home equity loan) Houses without a mortgage: 132
Median monthly owner costs for units with a mortgage: $2,118 Median monthly owner costs for units without a mortgage: $510
Residents with income below the poverty level in 2022:
This zip code:
6.0%
Whole state:
12.5%
Residents with income below 50% of the poverty level in 2022:
This zip code:
3.2%
Whole state:
5.9%
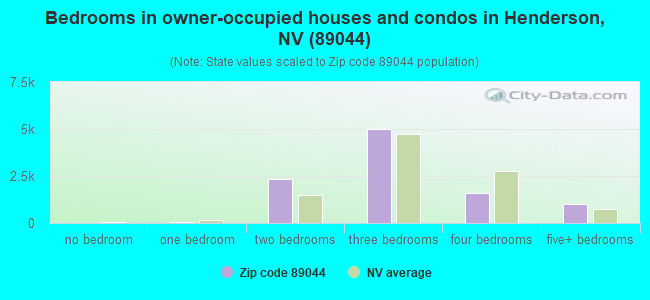
Median number of rooms in houses and condos:
Here:
5.8
State:
6.0
Median number of rooms in apartments:
Here:
5.5
State:
4.2
Notable locations in this zip code not listed on our city pages
3,974 married couples with children.
1,088 single-parent households (283 men, 805 women).
80.8% of residents of 89044 zip code speak English at home.
5.5% of residents speak Spanish at home (88% very well, 7% well, 5% not well).
2.7% of residents speak other Indo-European language at home (84% very well, 9% well, 5% not well, 1% not at all).
11.5% of residents speak Asian or Pacific Island language at home (67% very well, 26% well, 7% not well, 1% not at all).
0.2% of residents speak other language at home (100% very well).
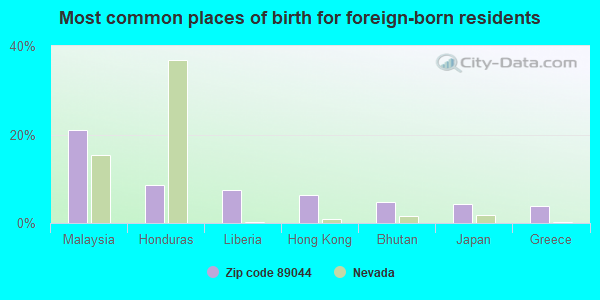
Foreign born population: 5,228 (18.8%) (80.5% of them are naturalized citizens)
This zip code:
18.8%
Whole state:
18.9%
21%Malaysia
8%Honduras
8%Liberia
6%Hong Kong
5%Bhutan
4%Japan
4%Greece
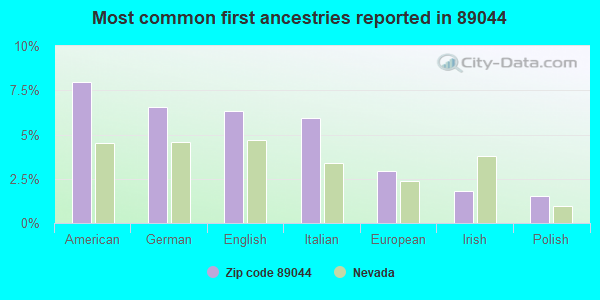
8%American
7%German
6%English
6%Italian
3%European
2%Irish
2%Polish
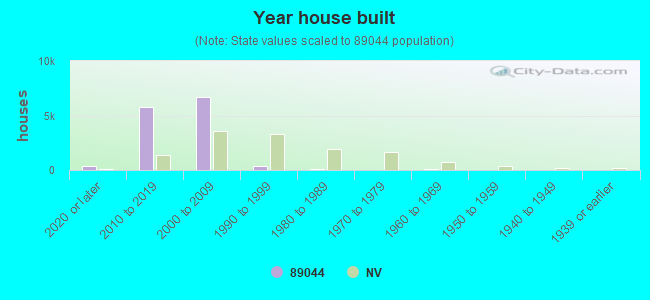
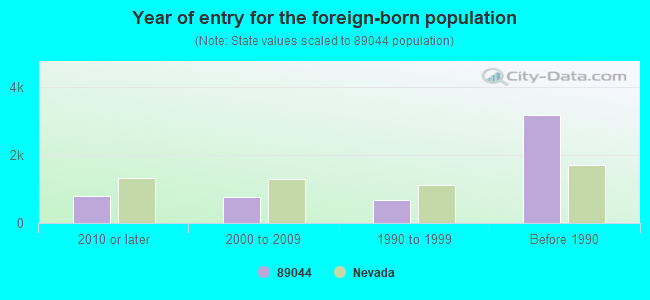
Year of entry for the foreign-born population
7992010 or later
7532000 to 2009
6881990 to 1999
3,177Before 1990
Housing units lacking complete plumbing facilities: 0.3% Housing units lacking complete kitchen facilities: 2.0%
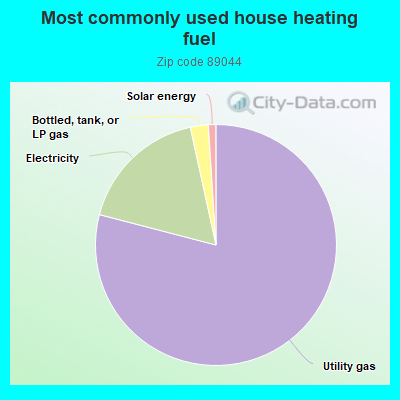
78.9%Utility gas
17.5%Electricity
2.4%Bottled, tank, or LP gas
1.0%Solar energy
Place of birth for U.S.-born residents:
This state: 5,643
Northeast: 3,182
Midwest: 3,855
South: 2,457
West: 6,999
91% of the 89044 zip code residents lived in the same house 1 year ago. Out of people who lived in different houses, 59% moved from this county. Out of people who lived in different houses, 3% moved from different county within same state. Out of people who lived in different houses, 42% moved from different state. Out of people who lived in different houses, 0% moved from abroad.
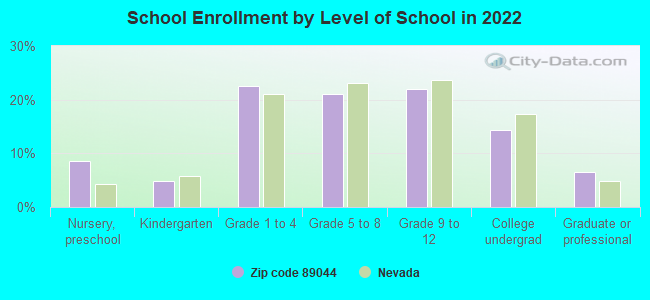
Private vs. public school enrollment:
Students in private schools in grades 1 to 8 (elementary and middle school): 169
Here:
7.6%
Nevada:
12.9%
Students in private schools in grades 9 to 12 (high school): 221
Here:
19.2%
Nevada:
6.9%
Students in private undergraduate colleges: 43
Here:
5.7%
Nevada:
16.0%
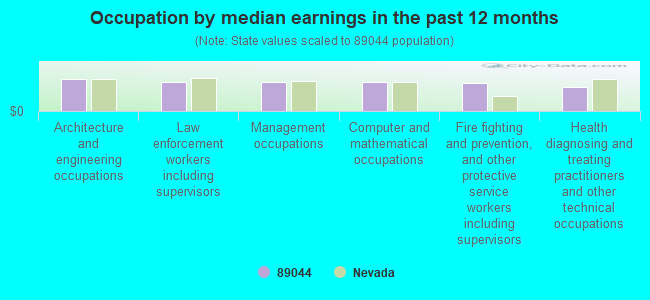
Occupation by median earnings in the past 12 months ($)
123,273Architecture and engineering occupations
113,273Law enforcement workers including supervisors
112,932Management occupations
111,319Computer and mathematical occupations
107,022Fire fighting and prevention, and other protective service workers including supervisors
94,755Health diagnosing and treating practitioners and other technical occupations
Top industries in this zip code by the number of employees in 2005:
Accommodation and Food Services: Limited-Service Restaurants (20-49 employees: 1 establishment)
Other Services (except Public Administration): Communication Equipment Repair and Maintenance (20-49: 1)
Arts, Entertainment, and Recreation: Promoters of Performing Arts, Sports, and Similar Events with Facilities (10-19: 1)
Finance and Insurance: Mortgage and Nonmortgage Loan Brokers (5-9: 1, 1-4: 1)
Real Estate and Rental and Leasing: Offices of Real Estate Agents and Brokers (1-4: 4)
Other Services (except Public Administration): Other Personal and Household Goods Repair and Maintenance (5-9: 1)
Finance and Insurance: Real Estate Credit (1-4: 1)
Finance and Insurance: Direct Life Insurance Carriers (1-4: 1)
Professional, Scientific, and Technical Services: Graphic Design Services (1-4: 1)
Fatal accident statistics in 2013:
Fatal accident count: 3
Vehicles involved in fatal accidents: 6
Fatal accidents caused by drunken drivers: 2
Fatalities: 4
Persons involved in fatal accidents: 11
Pedestrians involved in fatal accidents: 0
Fatal accident statistics in 2012:
Fatal accident count: 2
Vehicles involved in fatal accidents: 3
Fatal accidents caused by drunken drivers: 0
Fatalities: 3
Persons involved in fatal accidents: 8
Pedestrians involved in fatal accidents: 0
2004 - 2018 National Fire Incident Reporting System (NFIRS) incidents
According to the data from the years 2004 - 2018 the average number of fires per year is 11. The highest number of reported fires - 30 took place in 2018, and the least - 1 in 2005. The data has a growing trend.
When looking into fire subcategories, the most reports belonged to: Outside Fires (40.5%), and Structure Fires (29.2%).
Fire incident types reported to NFIRS in Zip Code 89044


 According to the data from the years 2004 - 2018 the average number of fires per year is 11. The highest number of reported fires - 30 took place in 2018, and the least - 1 in 2005. The data has a growing trend.
 When looking into fire subcategories, the most reports belonged to: Outside Fires (40.5%), and Structure Fires (29.2%).