Estimated zip code population in 2022: 10,876 Zip code population in 2010: 9,714 Zip code population in 2000: 9,220
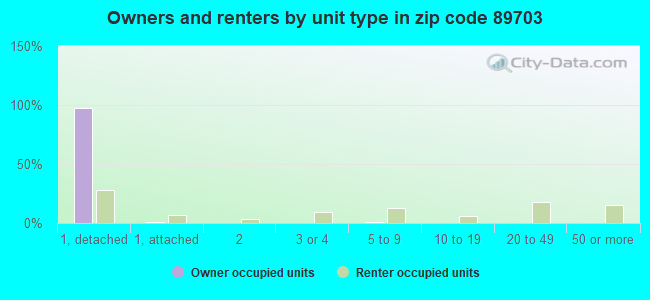
Houses and condos: 5,137 Renter-occupied apartments: 1,301
% of renters here:
26%
State:
40%
March 2022 cost of living index in zip code 89703: 95.8 (near average, U.S. average is 100)
Land area: 25.4 sq. mi. Water area: 0.0 sq. mi.
Population density: 428 people per square mile
(low).
OSM Map
General Map
Google Map
MSN Map
OSM Map
General Map
Google Map
MSN Map
OSM Map
General Map
Google Map
MSN Map
OSM Map
General Map
Google Map
MSN Map
Please wait while loading the map...
Real estate property taxes paid for housing units in 2022:
This zip code:
0.5% ($3,134)
Nevada:
0.4% ($1,889)
Median real estate property taxes paid for housing units with mortgages in 2022: $2,814 (0.5%) Median real estate property taxes paid for housing units with no mortgage in 2022: $3,538 (0.5%)
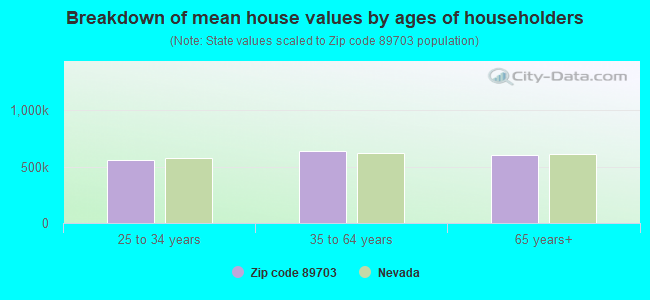
Estimated median house/condo value in 2022: $633,327
89703:
$633,327
Nevada:
$434,700
According to our research of Nevada and other state lists, there were 24 registered sex offenders living in 89703 zip code as of May 18, 2024. The ratio of all residents to sex offenders in zip code 89703 is 432 to 1. The ratio of registered sex offenders to all residents in this zip code is lower than the state average.
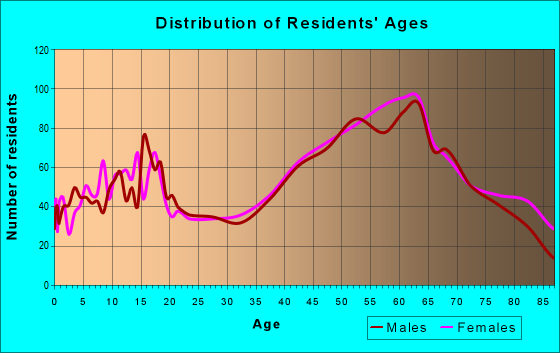
Median resident age:
This zip code:
54.2 years
Nevada median age:
39.0 years
Average household size:
This zip code:
2.1 people
Nevada:
2.6 people
Averages for the 2020 tax year for zip code 89703, filed in 2021:
Average Adjusted Gross Income (AGI) in 2020: $99,882 (Individual Income Tax Returns)
Here:
$99,882
State:
$78,964
Salary/wage: $69,618 (reported on 69.4% of returns)
Here:
$69,618
State:
$54,472
(% of AGI for various income ranges: 1233.1% for AGIs below $25k, 3544.2% for AGIs $25k-50k, 5714.8% for AGIs $50k-75k, 7218.6% for AGIs $75k-100k, 15278.3% for AGIs $100k-200k, 71085.4% for AGIs over 200k)
Taxable interest for individuals: $2,645 (reported on 44.3% of returns)
This zip code:
$2,645
Nevada:
$3,521
(% of AGI for various income ranges: 36.8% for AGIs below $25k, 61.6% for AGIs $25k-50k, 98.9% for AGIs $50k-75k, 160.8% for AGIs $75k-100k, 399.6% for AGIs $100k-200k, 1915.4% for AGIs over 200k)
Ordinary dividends: $10,216 (reported on 31.7% of returns)
Here:
$10,216
State:
$13,390
(% of AGI for various income ranges: 89.5% for AGIs below $25k, 103.8% for AGIs $25k-50k, 202.6% for AGIs $50k-75k, 360.0% for AGIs $75k-100k, 810.4% for AGIs $100k-200k, 7534.6% for AGIs over 200k)
Net capital gain/loss in AGI: +$27,620 (reported on 30.3% of returns)
Here:
+$27,620
State:
+$63,025
(% of AGI for various income ranges: 19.3% for AGIs below $25k, 76.4% for AGIs $25k-50k, 185.6% for AGIs $50k-75k, 239.7% for AGIs $75k-100k, 1131.7% for AGIs $100k-200k, 29254.6% for AGIs over 200k)
Profit/loss from business: +$25,232 (reported on 14.7% of returns)
Here:
+$25,232
State:
+$11,500
(% of AGI for various income ranges: 96.5% for AGIs below $25k, 165.6% for AGIs $25k-50k, 217.8% for AGIs $50k-75k, 365.0% for AGIs $75k-100k, 957.9% for AGIs $100k-200k, 8432.3% for AGIs over 200k)
Taxable individual retirement arrangement distribution: $25,617 (reported on 15.6% of returns)
89703:
$25,617
Nevada:
$23,628
(% of AGI for various income ranges: 98.7% for AGIs below $25k, 174.4% for AGIs $25k-50k, 306.1% for AGIs $50k-75k, 696.1% for AGIs $75k-100k, 1490.6% for AGIs $100k-200k, 6135.4% for AGIs over 200k)
Self-employed (Keogh) retirement plans: $22,667 (reported on 1.1% of returns)
89703:
$22,667
Nevada:
$26,634
(% of AGI for various income ranges: 105.8% for AGIs $75k-100k, 753.1% for AGIs over 200k)
Total itemized deductions: $39,659 (reported on 12.4% of returns)
Here:
$39,659
State:
$44,173
(% of AGI for various income ranges: 110.4% for AGIs below $25k, 219.3% for AGIs $25k-50k, 348.3% for AGIs $50k-75k, 714.7% for AGIs $75k-100k, 1584.5% for AGIs $100k-200k, 9076.2% for AGIs over 200k)
Charity contributions: $12,711 (reported on 9.9% of returns)
Here:
$12,711
State:
$12,589
(% of AGI for various income ranges: 35.1% for AGIs $25k-50k, 46.1% for AGIs $50k-75k, 95.8% for AGIs $75k-100k, 338.3% for AGIs $100k-200k, 3323.1% for AGIs over 200k)
Taxes paid: $6,357 (reported on 12.4% of returns)
89703:
$6,357
State:
$6,112
(% of AGI for various income ranges: 16.6% for AGIs below $25k, 34.9% for AGIs $25k-50k, 60.2% for AGIs $50k-75k, 113.3% for AGIs $75k-100k, 286.4% for AGIs $100k-200k, 1316.2% for AGIs over 200k)
Earned income credit: $1,696 (reported on 8.1% of returns)
Here:
$1,696
State:
$2,214
(% of AGI for various income ranges: 57.5% for AGIs below $25k, 33.8% for AGIs $25k-50k)
Percentage of individuals using paid preparers for their 2020 taxes: 91.8%
Here:
92%
State:
93%
(% for various income ranges: 89.6% for AGIs below $25k, 94.0% for AGIs $25k-50k, 91.6% for AGIs $50k-75k, 91.7% for AGIs $75k-100k, 91.2% for AGIs $100k-200k, 94.1% for AGIs over 200k)
Averages for the 2012 tax year for zip code 89703, filed in 2013:
Average Adjusted Gross Income (AGI) in 2012: $78,325 (Individual Income Tax Returns)
Here:
$78,325
State:
$61,164
Salary/wage: $61,155 (reported on 70.3% of returns)
Here:
$61,155
State:
$45,924
(% of AGI for various income ranges: 68.1% for AGIs below $25k, 61.9% for AGIs $25k-50k, 55.0% for AGIs $50k-75k, 53.4% for AGIs $75k-100k, 56.9% for AGIs $100k-200k, 49.5% for AGIs over 200k)
Taxable interest for individuals: $2,579 (reported on 47.6% of returns)
This zip code:
$2,579
Nevada:
$3,137
(% of AGI for various income ranges: 3.2% for AGIs below $25k, 1.6% for AGIs $25k-50k, 1.6% for AGIs $50k-75k, 1.4% for AGIs $75k-100k, 1.6% for AGIs $100k-200k, 1.4% for AGIs over 200k)
Ordinary dividends: $8,382 (reported on 32.8% of returns)
Here:
$8,382
State:
$11,762
(% of AGI for various income ranges: 5.6% for AGIs below $25k, 4.1% for AGIs $25k-50k, 3.7% for AGIs $50k-75k, 3.0% for AGIs $75k-100k, 2.7% for AGIs $100k-200k, 3.9% for AGIs over 200k)
Net capital gain/loss in AGI: +$8,076 (reported on 27.9% of returns)
Here:
+$8,076
State:
+$33,127
(% of AGI for various income ranges: 0.4% for AGIs $50k-75k, 0.9% for AGIs $75k-100k, 2.0% for AGIs $100k-200k, 6.7% for AGIs over 200k)
Profit/loss from business: +$24,647 (reported on 15.0% of returns)
Here:
+$24,647
State:
+$12,567
(% of AGI for various income ranges: 5.5% for AGIs below $25k, 2.3% for AGIs $25k-50k, 2.9% for AGIs $50k-75k, 3.6% for AGIs $75k-100k, 4.1% for AGIs $100k-200k, 6.9% for AGIs over 200k)
Taxable individual retirement arrangement distribution: $18,973 (reported on 16.0% of returns)
89703:
$18,973
Nevada:
$20,808
(% of AGI for various income ranges: 4.1% for AGIs below $25k, 3.7% for AGIs $25k-50k, 3.5% for AGIs $50k-75k, 3.6% for AGIs $75k-100k, 4.6% for AGIs $100k-200k, 3.5% for AGIs over 200k)
Self-employment retirement plans: $25,957 (reported on 1.5% of returns)
89703:
$25,957
Nevada:
$22,197
Total itemized deductions: $24,999 (19% of AGI, reported on 36.8% of returns)
Here:
$24,999
State:
$26,148
Here:
18.9% of AGI
State:
20.0% of AGI
(% of AGI for various income ranges: 15.3% for AGIs below $25k, 11.7% for AGIs $25k-50k, 13.5% for AGIs $50k-75k, 11.6% for AGIs $75k-100k, 12.8% for AGIs $100k-200k, 9.7% for AGIs over 200k)
Charity contributions: $4,519 (reported on 31.0% of returns)
Here:
$4,519
State:
$4,329
(% of AGI for various income ranges: 0.6% for AGIs below $25k, 1.1% for AGIs $25k-50k, 1.7% for AGIs $50k-75k, 1.4% for AGIs $75k-100k, 2.1% for AGIs $100k-200k, 2.1% for AGIs over 200k)
Taxes paid: $5,494 (reported on 36.8% of returns)
89703:
$5,494
State:
$5,116
(% of AGI for various income ranges: 2.1% for AGIs below $25k, 2.1% for AGIs $25k-50k, 2.6% for AGIs $50k-75k, 2.4% for AGIs $75k-100k, 2.8% for AGIs $100k-200k, 2.6% for AGIs over 200k)
Earned income credit: $1,828 (reported on 8.9% of returns)
Here:
$1,828
State:
$2,279
(% of AGI for various income ranges: 3.2% for AGIs below $25k, 0.6% for AGIs $25k-50k)
Percentage of individuals using paid preparers for their 2012 taxes: 51.6%
Here:
52%
State:
55%
(% for various income ranges: 43.2% for AGIs below $25k, 47.9% for AGIs $25k-50k, 52.7% for AGIs $50k-75k, 52.9% for AGIs $75k-100k, 58.5% for AGIs $100k-200k, 80.0% for AGIs over 200k)
Averages for the 2004 tax year for zip code 89703, filed in 2005:
Average Adjusted Gross Income (AGI) in 2004: $76,639 (Individual Income Tax Returns)
Here:
$76,639
State:
$58,367
Salary/wage: $55,673 (reported on 72.5% of returns)
Here:
$55,673
State:
$42,695
(% of AGI for various income ranges: 67.1% for AGIs $10k-25k, 63.4% for AGIs $25k-50k, 56.3% for AGIs $50k-75k, 60.8% for AGIs $75k-100k, 46.4% for AGIs over 100k)
Taxable interest for individuals: $4,402 (reported on 58.8% of returns)
This zip code:
$4,402
Nevada:
$3,867
(% of AGI for various income ranges: 4.4% for AGIs $10k-25k, 3.1% for AGIs $25k-50k, 3.3% for AGIs $50k-75k, 2.8% for AGIs $75k-100k, 3.1% for AGIs over 100k)
Taxable dividends: $5,888 (reported on 39.3% of returns)
Here:
$5,888
State:
$5,770
(% of AGI for various income ranges: 3.8% for AGIs $10k-25k, 2.2% for AGIs $25k-50k, 3.0% for AGIs $50k-75k, 1.8% for AGIs $75k-100k, 3.1% for AGIs over 100k)
Net capital gain/loss: +$22,870 (reported on 34.5% of returns)
Here:
+$22,870
State:
+$50,644
(% of AGI for various income ranges: -0.2% for AGIs $10k-25k, 0.6% for AGIs $25k-50k, 1.6% for AGIs $50k-75k, 2.2% for AGIs $75k-100k, 15.6% for AGIs over 100k)
Profit/loss from business: +$36,428 (reported on 16.1% of returns)
Here:
+$36,428
State:
+$13,618
(% of AGI for various income ranges: 3.2% for AGIs $10k-25k, 3.1% for AGIs $25k-50k, 4.2% for AGIs $50k-75k, 4.2% for AGIs $75k-100k, 10.0% for AGIs over 100k)
IRA payment deduction: $3,408 (reported on 2.8% of returns)
89703:
$3,408
Nevada:
$3,054
(% of AGI for various income ranges: 0.3% for AGIs $10k-25k, 0.2% for AGIs $25k-50k, 0.2% for AGIs $50k-75k, 0.2% for AGIs $75k-100k, 0.1% for AGIs over 100k)
Self-employed pension: $17,537 (reported on 2.6% of returns)
Here:
$17,537
Nevada:
$16,706
(% of AGI for various income ranges: 0.2% for AGIs $50k-75k, 0.3% for AGIs $75k-100k, 0.8% for AGIs over 100k)
Total itemized deductions: $22,862 (19% of AGI, reported on 41.4% of returns)
Here:
$22,862
State:
$22,990
Here:
19.0% of AGI
State:
21.8% of AGI
(% of AGI for various income ranges: 14.9% for AGIs $10k-25k, 13.7% for AGIs $25k-50k, 16.9% for AGIs $50k-75k, 16.6% for AGIs $75k-100k, 10.2% for AGIs over 100k)
Charity contributions deductions: $3,293 (3% of AGI, reported on 37.4% of returns)
Here:
$3,293
State:
$3,443
Here:
2.7% of AGI
State:
3.1% of AGI
(% of AGI for various income ranges: 1.0% for AGIs $10k-25k, 1.2% for AGIs $25k-50k, 1.6% for AGIs $50k-75k, 1.9% for AGIs $75k-100k, 1.6% for AGIs over 100k)
Total tax: $15,575 (reported on 82.3% of returns)
89703:
$15,575
State:
$10,585
(% of AGI for various income ranges: 4.6% for AGIs $10k-25k, 7.8% for AGIs $25k-50k, 9.9% for AGIs $50k-75k, 11.1% for AGIs $75k-100k, 21.1% for AGIs over 100k)
Earned income credit: $1,372 (reported on 6.3% of returns)
Here:
$1,372
State:
$1,676
Percentage of individuals using paid preparers for their 2004 taxes: 58.8%
Here:
59%
State:
60%
(% for various income ranges: 53.4% for AGIs below $10k, 53.7% for AGIs $10k-25k, 56.0% for AGIs $25k-50k, 60.9% for AGIs $50k-75k, 60.9% for AGIs $75k-100k, 68.5% for AGIs over 100k)
Likely homosexual households (counted as self-reported same-sex unmarried-partner households)
Lesbian couples: 0.2% of all households
Gay men: 0.0% of all households
Household received Food Stamps/SNAP in the past 12 months: 430 Household did not receive Food Stamps/SNAP in the past 12 months: 4,547
Women who had a birth in the past 12 months: 56 (60 now married, 2 unmarried) Women who did not have a birth in the past 12 months: 1,714 (691 now married, 1,023 unmarried)
Housing units in zip code 89703 with a mortgage: 2,154 (277 second mortgage, 197 both second mortgage and home equity loan) Houses without a mortgage: 46
Median monthly owner costs for units with a mortgage: $1,916 Median monthly owner costs for units without a mortgage: $648
Residents with income below the poverty level in 2022:
This zip code:
8.9%
Whole state:
12.5%
Residents with income below 50% of the poverty level in 2022:
This zip code:
3.9%
Whole state:
5.9%
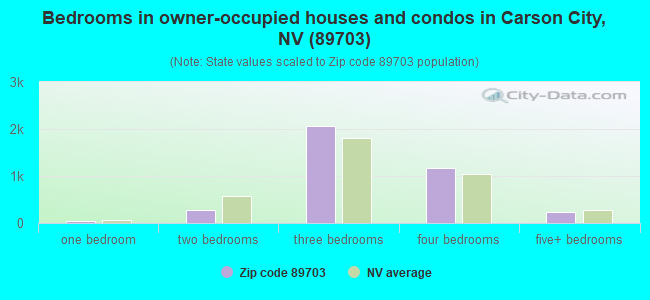
Median number of rooms in houses and condos:
Here:
6.4
State:
6.0
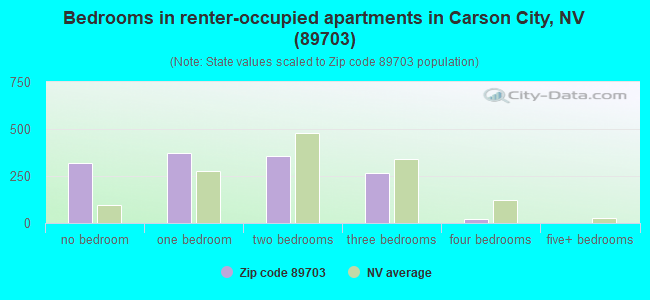
Median number of rooms in apartments:
Here:
3.7
State:
4.2
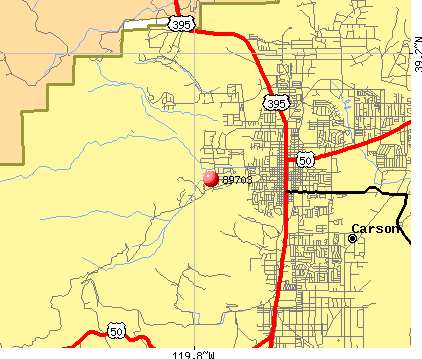
Notable locations in this zip code not listed on our city pages
Notable locations in zip code 89703: Eagle Valley Ranch Childrens Foundation (A), Landmark Letter (B), Carson Ranger Station (C), Nevada Governor Mansion (D), Nevada Division of Forestry Western Area Station (E). Display/hide their locations on the map
In group quarters: 211 (-1 institutionalized population)
Size of family households: 1,729 2-persons, 505 3-persons, 510 4-persons, 152 5-persons, 67 6-persons, 16 7-or-more-persons
Size of nonfamily households: 1,834 1-person, 181 2-persons, 14 3-persons
1,068 married couples with children.
343 single-parent households (31 men, 312 women).
91.8% of residents of 89703 zip code speak English at home.
5.3% of residents speak Spanish at home (68% very well, 31% well, 1% not well).
1.3% of residents speak other Indo-European language at home (100% very well).
1.7% of residents speak Asian or Pacific Island language at home (38% very well, 51% well, 12% not well).
0.2% of residents speak other language at home (85% very well, 15% well).
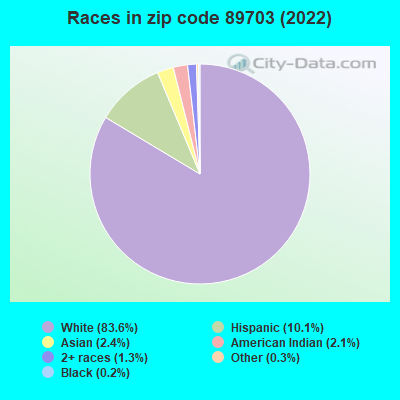
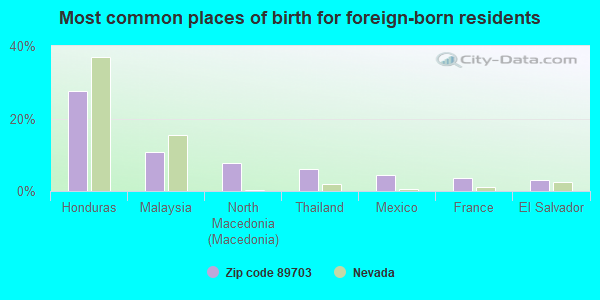
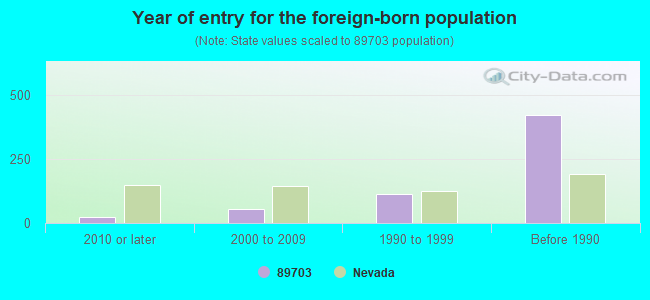
Foreign born population: 591 (5.4%) (83.6% of them are naturalized citizens)
Major facilities with environmental interests located in this zip code:
EMPIRE ELEM (1260 MONTE ROSA in CARSON CITY, NV)
(National Center for Education Statistics) - STATE ID-13-209 Organizations: CARSON CITY SCH DIST (SCHOOL DISTRICT)
TAHOE CARSON RADIOLOGY (1001 MOUNTAIN ST STE 3E in CARSON CITY, NV)
(Resource Conservation and Recovery Act (tracking hazardous waste)) Business NAICS classification: ALL OTHER OUTPATIENT CARE CENTERS. Organizations: DR KOP (CONTACT/OWNER)
, DR LANDIS (CONTACT/OWNER)
, DRS VEVERKI, KOP, AND LANDIS (CONTACT/OWNER)
ETHRIDGE AUTO (4880 COCHISE ST UNIT B in CARSON CITY, NV)
CAPITAL ONCOLOGY (550 W. WASHINGOTN #101 in CARSON CITY, NV)
(Resource Conservation and Recovery Act (tracking hazardous waste)) Organizations: JOHN P KELLY (CONTACT/OWNER)
CARSON IMAGING LTD PARTNERSHIP (1001 N MOUNTAIN ST STE 1F in CARSON CITY, NV)
(Resource Conservation and Recovery Act (tracking hazardous waste)) Business NAICS classification: ALL OTHER OUTPATIENT CARE CENTERS.
CARSON MEDICAL GROUP IMAGING CENTER (1200 N MOUNTAIN ST in CARSON CITY, NV)
Small Quantity Generators, between 100 kg and 1000 kg of hazardous waste/month (Resource Conservation and Recovery Act (tracking hazardous waste)) Business NAICS classification: DIAGNOSTIC IMAGING CENTERS. Organizations: JULIE CUTUNILLI (CONTACT/OPERATOR)
CARSON TAHOE HOSPITAL (775 FLEISCHMANN WAY in CARSON CITY, NV)
CRITERIA AND HAZARDOUS AIR POLLUTANT INVENTORY (Inventory of air pollution sources) Conditionally Exempt Small Quantity Generators, less than 100 kg/month of hazardous waste (Resource Conservation and Recovery Act (tracking hazardous waste)) - notification Business SIC classification: GENERAL MEDICAL AND SURGICAL HOSPITALS Organizations: CARSON CITY (CONTACT/OWNER)
Alternative names: CARSON-TAHOE HOSPITAL, A NON-PROFIT CORP.
C AND C ENVIRONMENTAL SVCS M (612 CHERNUS DR in CARSON CITY, NV)
TRANSPORTER (Resource Conservation and Recovery Act (tracking hazardous waste)) USED OIL PROGRAM (Resource Conservation and Recovery Act (tracking hazardous waste)) Organizations: CHARLES R SCROGGS (CONTACT/OWNER)
CARSON KTM HUSQVARNA (4880 COCHISE in CARSON CITY, NV)
Conditionally Exempt Small Quantity Generators, less than 100 kg/month of hazardous waste (Resource Conservation and Recovery Act (tracking hazardous waste)) - notification Organizations: MEL ENGLISH (CONTACT/OWNER)
Alternative names: WHITE CYCLE INC
PRESTO AUTO ELECTICS AND VALLEY MACHINE (291 RHODES ST. in CARSON CITY, NV)
(Resource Conservation and Recovery Act (tracking hazardous waste))
THE MARLEX GROUP (501 N DIVISION ST in CARSON CITY, NV)
TRANSPORTER (Resource Conservation and Recovery Act (tracking hazardous waste)) Organizations: DON HARMER (CONTACT/OPERATOR)
INTREADABLE AUTO CARE (1356 S CARSON ST in CARSON CITY, NV)
Conditionally Exempt Small Quantity Generators, less than 100 kg/month of hazardous waste (Resource Conservation and Recovery Act (tracking hazardous waste)) - notification Business NAICS classification: GENERAL AUTOMOTIVE REPAIR. Alternative names: TRIPLE S TIRES
MALLY WILLIAM (1025 S MINNESOTA in CARSON CITY, NV)
COMPLIANCE ACTIVITY (Tracking inspections of insecticide, fungicide, and rodenticide, and toxic substances) Alternative names: WILLIAM MALLY
Housing units lacking complete plumbing facilities: 0.6% Housing units lacking complete kitchen facilities: 2.0%
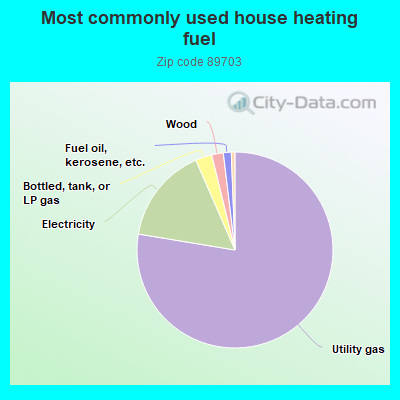
77.3%Utility gas
15.8%Electricity
2.7%Bottled, tank, or LP gas
1.9%Wood
1.3%Fuel oil, kerosene, etc.
0.6%Solar energy
Population in 1990: 8,047. Population change in the 1990s: +1,173 (+14.6%).
Place of birth for U.S.-born residents:
This state: 3,679
Northeast: 677
Midwest: 1,304
South: 487
West: 4,072
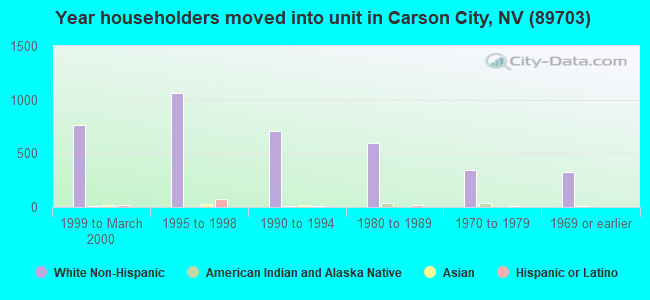
52% of the 89703 zip code residents lived in the same house 5 years ago. Out of people who lived in different houses, 46% lived in this county. Out of people who lived in different counties, 50% lived in Nevada.
92% of the 89703 zip code residents lived in the same house 1 year ago. Out of people who lived in different houses, 45% moved from this county. Out of people who lived in different houses, 46% moved from different county within same state. Out of people who lived in different houses, 17% moved from different state. Out of people who lived in different houses, 1% moved from abroad.
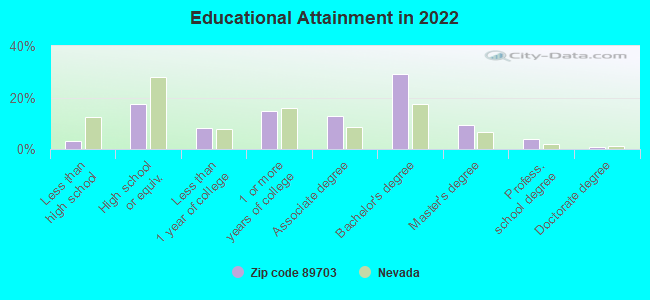
Private vs. public school enrollment:
Students in private schools in grades 1 to 8 (elementary and middle school): 69
Here:
9.1%
Nevada:
12.9%
Students in private schools in grades 9 to 12 (high school): 68
Here:
16.2%
Nevada:
6.9%
Students in private undergraduate colleges:
Here:
0.0%
Nevada:
16.0%
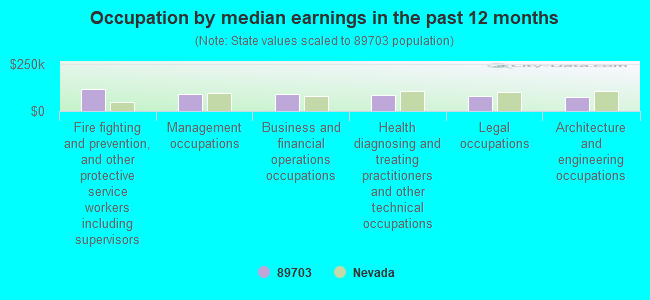
Occupation by median earnings in the past 12 months ($)
117,240Fire fighting and prevention, and other protective service workers including supervisors
88,925Management occupations
88,703Business and financial operations occupations
84,213Health diagnosing and treating practitioners and other technical occupations
78,480Legal occupations
74,597Architecture and engineering occupations
Companies with federal contracts located in this zip code (CARSON CITY, NV):
HUMBOLDT TRADING CORP. (251 JEANELL DR. SUITE 3; small business)
$6,541,020 with Department of Defense for Guided Missile Systems, Complete. Signed on 2000-02-25. Completion date: 2000-03-31.
R ORBAS & ASSOCIATES, INC (180 N ORMSBY BLVD , 1; small business) : $3,824,267 in 9 contractsfrom 1999 to 2002
Contracts for Construction of Structures and Facilities -- Other Administrative Facilities and Service Buildings, Maintenance, Repair or Alteration of Real Property -- Miscellaneous Buildings by Air Force, Navy Signed by year:2000: $264,635; 2001: $326,631; 2002: $43,331; 2003: $0; 2004: $0; 2005: $0; 2006: $0.
Biggest contracts:
$3,189,670 with Air Force for Construction of Structures and Facilities -- Other Administrative Facilities and Service Buildings. Taking place in CA. Signed on 1999-10-22. Completion date: 1999-08-18.
$324,869, same as above.Signed on 2001-04-16. Completion date: 2001-04-30.
$155,336, same as above.Signed on 2000-08-10. Completion date: 2000-10-24.
$65,000 with Navy for Maintenance, Repair or Alteration of Real Property -- Miscellaneous Buildings. Taking place in CA. Signed on 2000-01-01. Completion date: 1999-01-01.
TRIVENT ENG , INC (4346 KINGS CANYON RD; small business) : $2,266,722 in 37 contractsfrom 1999 to 2006
Contracts for Miscellaneous Power Transmission Equipment by Air Force, Defense Logistics Agency Signed by year:2000: $456,188; 2001: $284,530; 2002: $0; 2003: $205,072; 2004: $334,985; 2005: $541,310; 2006: $291,782.
Biggest contracts:
$456,188 with Air Force for Miscellaneous Power Transmission Equipment. Taking place in CA. Signed on 2000-07-19. Completion date: 2000-08-31.
$162,675, same as above.Signed on 2001-05-10. Completion date: 2001-08-31.
$152,855, same as above.Signed on 1999-12-16. Completion date: 2001-01-31.
$145,299 with Air Force for Miscellaneous Power Transmission Equipment. Signed on 2005-06-15. Completion date: 2005-10-14.
LARRY MILLER CONSULTING (2305 RICHARD DR; small business) : $109,560 in 3 contractsfrom 2002 to 2006
$42,000 with Army for Program Management/Support Services. Signed on 2006-06-26. Completion date: 2003-06-30.
$33,960, same as above.Signed on 2004-06-16. Completion date: 2003-06-30.
$33,600, same as above.Signed on 2002-06-27. Completion date: 2003-06-30.
STATE OF NEVADA DIVISION OF MI (400 WEST KING ST 106)
$74,443 with U.S. Army Corps of Engineers - civil program financing only for Environmental Studies and Assessments. Taking place in CA. Signed on 2002-01-08. Completion date: 2002-05-23.
P G WELLS ENTERPRISES, INC (251 JEANELL DR #3; small business)
$27,950 with Army for Maintenance, Repair and Rebuilding of Equipment -- Pumps and Compressors. Taking place in AL. Signed on 2004-02-04. Completion date: 2004-04-05.
GILSON AUTO BODY INC (405 MOSES ST STE 1; small business)
$17,661 with Army for Modification of Equipment -- Vehicular Equipment Components. Signed on 2005-09-22. Completion date: 2005-10-28.
BATTLE INC (502 NORTH DIVISION STREET; small business) : $5,660 in 3 contractsfrom 2004 to 2005
$3,150 with Federal Technology Service for Other ADP and Telecommunications Services (includes data storage on tapes, compact disks, etc.). Taking place in DC. Signed on 2004-10-01. Completion date: 2004-10-01.
$2,510 with Navy for ADP Software. Signed on 2005-01-12. Completion date: 2005-01-26.
$0 with Federal Technology Service for Other ADP and Telecommunications Services (includes data storage on tapes, compact disks, etc.). Taking place in DC. Signed on 2004-10-12. Completion date: 2004-10-12.
Top industries in this zip code by the number of employees in 2005:
Health Care and Social Assistance: General Medical and Surgical Hospitals (over 1000 employees: 1 establishment)
Health Care and Social Assistance: Offices of Physicians (except Mental Health Specialists) (50-99: 1, 20-49: 3, 10-19: 4, 5-9: 18, 1-4: 22)
Health Care and Social Assistance: Child and Youth Services (100-249: 1, 5-9: 1)
Accommodation and Food Services: Casino Hotels (100-249: 1)
Health Care and Social Assistance: Offices of Dentists (10-19: 5, 5-9: 8, 1-4: 5)
Professional, Scientific, and Technical Services: Offices of Lawyers (20-49: 1, 10-19: 3, 5-9: 2, 1-4: 20)
Health Care and Social Assistance: Child Day Care Services (50-99: 1, 10-19: 3, 1-4: 3)
Administrative and Support and Waste Management and Remediation Services: Office Administrative Services (20-49: 2, 10-19: 1, 5-9: 2, 1-4: 7)
Other Services (except Public Administration): Religious Organizations (20-49: 2, 10-19: 1, 5-9: 1, 1-4: 4)
Finance and Insurance: Insurance Agencies and Brokerages (20-49: 1, 5-9: 3, 1-4: 11)
People in group quarters in 2010:
124 people in nursing facilities/skilled-nursing facilities
People in group quarters in 2000:
111 people in nursing homes
15 people in homes for the mentally retarded
Home Mortgage Disclosure Act Aggregated Statistics For Year 2009 (Based on 6 partial tracts)
A) FHA, FSA/RHS & VA Home Purchase Loans
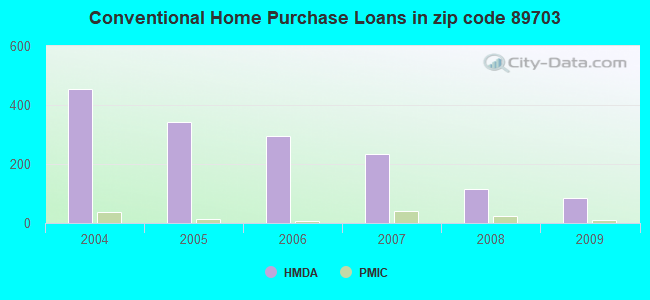
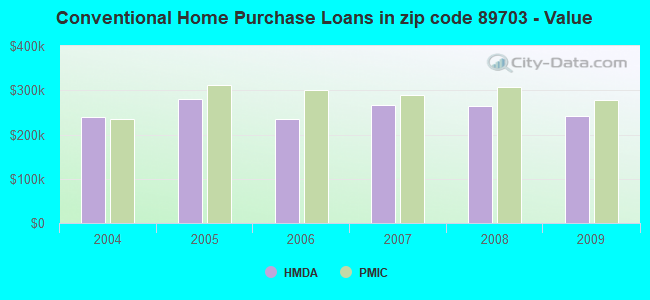
B) Conventional Home Purchase Loans
C) Refinancings
D) Home Improvement Loans
F) Non-occupant Loans on < 5 Family Dwellings (A B C & D)
Number
Average Value
Number
Average Value
Number
Average Value
Number
Average Value
Number
Average Value
LOANS ORIGINATED
31
$219,653
86
$242,380
523
$242,289
9
$214,202
48
$187,415
APPLICATIONS APPROVED, NOT ACCEPTED
0
$0
5
$156,144
33
$256,698
5
$97,388
3
$199,070
APPLICATIONS DENIED
5
$201,138
8
$233,284
121
$279,168
3
$18,240
18
$200,653
APPLICATIONS WITHDRAWN
5
$215,884
16
$248,361
118
$265,628
3
$72,827
9
$138,523
FILES CLOSED FOR INCOMPLETENESS
0
$0
0
$0
30
$208,422
0
$0
6
$235,835
Aggregated Statistics For Year 2008 (Based on 6 partial tracts)
A) FHA, FSA/RHS & VA Home Purchase Loans
B) Conventional Home Purchase Loans
C) Refinancings
D) Home Improvement Loans
E) Loans on Dwellings For 5+ Families
F) Non-occupant Loans on < 5 Family Dwellings (A B C & D)
G) Loans On Manufactured Home Dwelling (A B C & D)
Number
Average Value
Number
Average Value
Number
Average Value
Number
Average Value
Number
Average Value
Number
Average Value
Number
Average Value
LOANS ORIGINATED
29
$272,542
116
$265,215
251
$253,826
16
$144,554
3
$390,383
44
$223,078
0
$0
APPLICATIONS APPROVED, NOT ACCEPTED
2
$193,680
11
$293,063
30
$308,753
9
$140,288
0
$0
3
$399,450
0
$0
APPLICATIONS DENIED
5
$227,804
48
$255,386
96
$308,174
11
$117,763
0
$0
16
$250,102
1
$196,100
APPLICATIONS WITHDRAWN
5
$210,448
14
$340,503
47
$302,952
6
$224,162
0
$0
1
$197,460
0
$0
FILES CLOSED FOR INCOMPLETENESS
0
$0
3
$345,190
11
$298,719
6
$96,797
0
$0
0
$0
0
$0
Aggregated Statistics For Year 2007 (Based on 6 partial tracts)
A) FHA, FSA/RHS & VA Home Purchase Loans
B) Conventional Home Purchase Loans
C) Refinancings
D) Home Improvement Loans
E) Loans on Dwellings For 5+ Families
F) Non-occupant Loans on < 5 Family Dwellings (A B C & D)
G) Loans On Manufactured Home Dwelling (A B C & D)
Number
Average Value
Number
Average Value
Number
Average Value
Number
Average Value
Number
Average Value
Number
Average Value
Number
Average Value
LOANS ORIGINATED
11
$215,965
233
$267,335
312
$262,615
50
$157,065
5
$1,824,928
74
$240,696
3
$81,557
APPLICATIONS APPROVED, NOT ACCEPTED
0
$0
28
$266,743
47
$278,941
13
$88,414
1
$272,360
7
$265,864
3
$93,510
APPLICATIONS DENIED
0
$0
26
$294,815
173
$326,467
28
$107,789
0
$0
25
$279,325
6
$27,912
APPLICATIONS WITHDRAWN
0
$0
15
$359,612
98
$273,843
22
$168,975
0
$0
13
$364,179
1
$93,960
FILES CLOSED FOR INCOMPLETENESS
0
$0
1
$283,250
44
$307,382
3
$240,613
0
$0
7
$283,791
0
$0
Aggregated Statistics For Year 2006 (Based on 6 partial tracts)
A) FHA, FSA/RHS & VA Home Purchase Loans
B) Conventional Home Purchase Loans
C) Refinancings
D) Home Improvement Loans
E) Loans on Dwellings For 5+ Families
F) Non-occupant Loans on < 5 Family Dwellings (A B C & D)
G) Loans On Manufactured Home Dwelling (A B C & D)
Number
Average Value
Number
Average Value
Number
Average Value
Number
Average Value
Number
Average Value
Number
Average Value
Number
Average Value
LOANS ORIGINATED
1
$228,780
296
$235,220
396
$268,512
56
$138,904
4
$1,507,172
120
$247,715
6
$30,335
APPLICATIONS APPROVED, NOT ACCEPTED
0
$0
40
$252,766
60
$228,361
15
$122,829
0
$0
17
$174,180
4
$102,535
APPLICATIONS DENIED
2
$233,550
42
$254,702
160
$250,229
30
$158,638
0
$0
24
$249,894
4
$32,515
APPLICATIONS WITHDRAWN
0
$0
51
$261,520
144
$234,627
18
$221,767
0
$0
13
$234,758
1
$283,250
FILES CLOSED FOR INCOMPLETENESS
0
$0
14
$213,674
37
$271,482
1
$310,490
0
$0
4
$234,230
0
$0
Aggregated Statistics For Year 2005 (Based on 6 partial tracts)
A) FHA, FSA/RHS & VA Home Purchase Loans
B) Conventional Home Purchase Loans
C) Refinancings
D) Home Improvement Loans
E) Loans on Dwellings For 5+ Families
F) Non-occupant Loans on < 5 Family Dwellings (A B C & D)
G) Loans On Manufactured Home Dwelling (A B C & D)
Number
Average Value
Number
Average Value
Number
Average Value
Number
Average Value
Number
Average Value
Number
Average Value
Number
Average Value
LOANS ORIGINATED
6
$224,058
344
$281,271
596
$258,577
79
$150,366
6
$1,050,083
102
$232,828
0
$0
APPLICATIONS APPROVED, NOT ACCEPTED
1
$236,950
41
$260,264
94
$240,817
11
$112,628
0
$0
17
$225,050
0
$0
APPLICATIONS DENIED
0
$0
55
$261,082
172
$252,485
31
$88,414
3
$1,044,047
19
$246,455
14
$41,243
APPLICATIONS WITHDRAWN
0
$0
59
$238,127
215
$219,768
36
$146,858
0
$0
19
$180,818
2
$189,880
FILES CLOSED FOR INCOMPLETENESS
0
$0
4
$348,815
43
$325,328
3
$32,440
1
$2,042,700
7
$248,404
0
$0
Aggregated Statistics For Year 2004 (Based on 6 partial tracts)
A) FHA, FSA/RHS & VA Home Purchase Loans
B) Conventional Home Purchase Loans
C) Refinancings
D) Home Improvement Loans
E) Loans on Dwellings For 5+ Families
F) Non-occupant Loans on < 5 Family Dwellings (A B C & D)
G) Loans On Manufactured Home Dwelling (A B C & D)
2002 - 2018 National Fire Incident Reporting System (NFIRS) incidents
Based on the data from the years 2002 - 2018 the average number of fire incidents per year is 10. The highest number of reported fires - 30 took place in 2015, and the least - 1 in 2012. The data has an increasing trend.
When looking into fire subcategories, the most incidents belonged to: Structure Fires (42.3%), and Outside Fires (37.5%).
Fire incident types reported to NFIRS in Zip Code 89703


 Nearest zip codes: 89705, 89702, 89704, 89701, 89413, 89451.
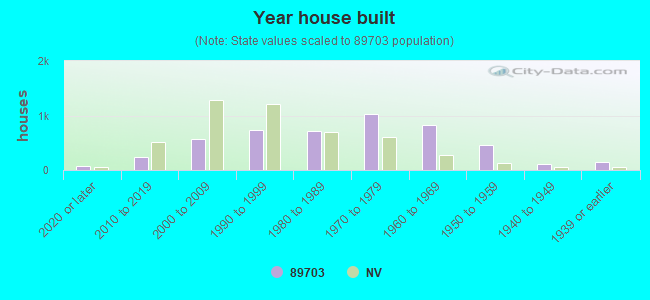


 Based on the data from the years 2002 - 2018 the average number of fire incidents per year is 10. The highest number of reported fires - 30 took place in 2015, and the least - 1 in 2012. The data has an increasing trend.
 When looking into fire subcategories, the most incidents belonged to: Structure Fires (42.3%), and Outside Fires (37.5%).