Estimated zip code population in 2022: 105,161 Zip code population in 2010: 103,892 Zip code population in 2000: 101,214
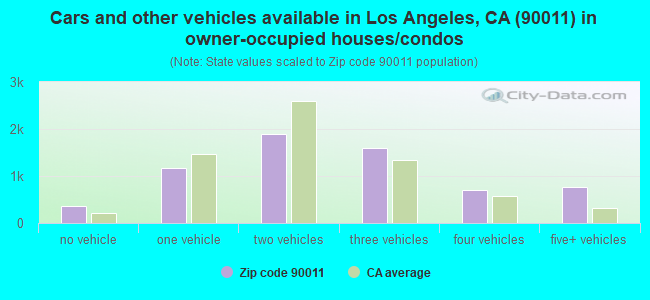
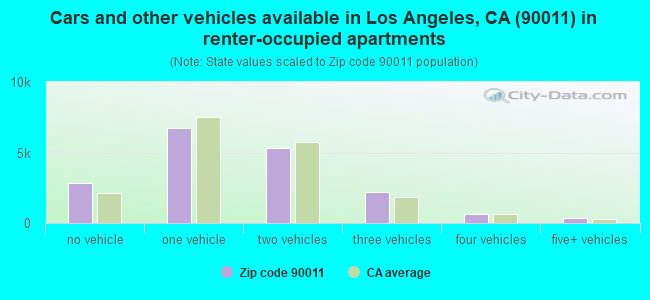
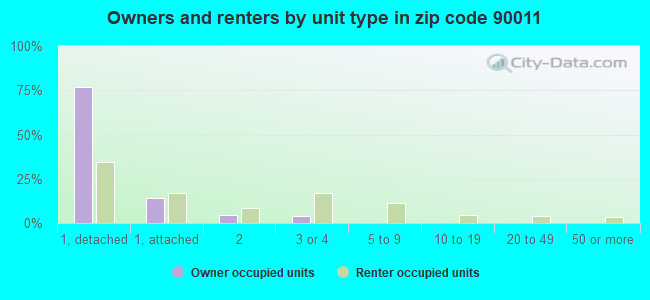
Houses and condos: 25,777 Renter-occupied apartments: 18,111
% of renters here:
73%
State:
44%
March 2022 cost of living index in zip code 90011: 137.6 (high, U.S. average is 100)
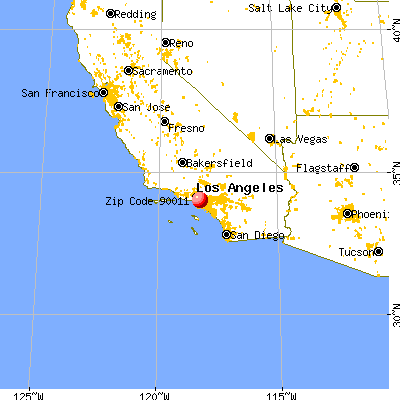
Land area: 4.3 sq. mi. Water area: 0.0 sq. mi.
Population density: 24,536 people per square mile
(very high).
OSM Map
General Map
Google Map
MSN Map
OSM Map
General Map
Google Map
MSN Map
OSM Map
General Map
Google Map
MSN Map
OSM Map
General Map
Google Map
MSN Map
Please wait while loading the map...
Real estate property taxes paid for housing units in 2022:
This zip code:
0.6% ($3,457)
California:
0.7% ($4,831)
Median real estate property taxes paid for housing units with mortgages in 2022: $3,773 (0.7%) Median real estate property taxes paid for housing units with no mortgage in 2022: $2,456 (0.4%)
Averages for the 2020 tax year for zip code 90011, filed in 2021:
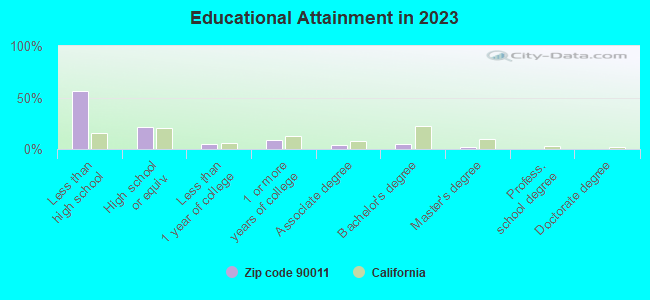
Average Adjusted Gross Income (AGI) in 2020: $30,414 (Individual Income Tax Returns)
Here:
$30,414
State:
$95,910
Salary/wage: $30,379 (reported on 82.5% of returns)
Here:
$30,379
State:
$77,331
(% of AGI for various income ranges: 1369.4% for AGIs below $25k, 4113.6% for AGIs $25k-50k, 7773.0% for AGIs $50k-75k, 11139.8% for AGIs $75k-100k, 18860.2% for AGIs $100k-200k)
Taxable interest for individuals: $254 (reported on 10.4% of returns)
This zip code:
$254
California:
$2,294
(% of AGI for various income ranges: 1.2% for AGIs below $25k, 2.2% for AGIs $25k-50k, 7.4% for AGIs $50k-75k, 11.1% for AGIs $75k-100k, 74.2% for AGIs $100k-200k)
Ordinary dividends: $606 (reported on 1.6% of returns)
Here:
$606
State:
$10,949
(% of AGI for various income ranges: 0.9% for AGIs below $25k, 0.4% for AGIs $25k-50k, 1.3% for AGIs $50k-75k, 2.6% for AGIs $75k-100k, 45.8% for AGIs $100k-200k)
Net capital gain/loss in AGI: +$2,460 (reported on 2.5% of returns)
Here:
+$2,460
State:
+$49,306
(% of AGI for various income ranges: 13.2% for AGIs $50k-75k, 20.9% for AGIs $75k-100k, 540.0% for AGIs $100k-200k)
Profit/loss from business: +$7,956 (reported on 22.1% of returns)
Here:
+$7,956
State:
+$15,671
(% of AGI for various income ranges: 360.3% for AGIs below $25k, 140.5% for AGIs $25k-50k, 198.2% for AGIs $50k-75k, 298.8% for AGIs $75k-100k, 880.2% for AGIs $100k-200k)
Taxable individual retirement arrangement distribution: $7,782 (reported on 0.4% of returns)
90011:
$7,782
California:
$23,505
(% of AGI for various income ranges: 1.7% for AGIs below $25k, 2.7% for AGIs $25k-50k, 7.3% for AGIs $50k-75k, 59.4% for AGIs $75k-100k)
Total itemized deductions: $24,864 (reported on 3.3% of returns)
Here:
$24,864
State:
$39,517
(% of AGI for various income ranges: 19.7% for AGIs below $25k, 82.9% for AGIs $25k-50k, 359.0% for AGIs $50k-75k, 615.4% for AGIs $75k-100k, 1193.8% for AGIs $100k-200k)
Charity contributions: $4,498 (reported on 2.2% of returns)
Here:
$4,498
State:
$12,598
(% of AGI for various income ranges: 1.0% for AGIs below $25k, 10.7% for AGIs $25k-50k, 43.3% for AGIs $50k-75k, 81.5% for AGIs $75k-100k, 197.0% for AGIs $100k-200k)
Taxes paid: $6,867 (reported on 3.2% of returns)
90011:
$6,867
State:
$8,807
(% of AGI for various income ranges: 5.0% for AGIs below $25k, 20.0% for AGIs $25k-50k, 100.9% for AGIs $50k-75k, 188.1% for AGIs $75k-100k, 399.2% for AGIs $100k-200k)
Earned income credit: $2,504 (reported on 28.4% of returns)
Here:
$2,504
State:
$2,074
(% of AGI for various income ranges: 151.8% for AGIs below $25k, 92.4% for AGIs $25k-50k, 1.5% for AGIs $50k-75k)
Percentage of individuals using paid preparers for their 2020 taxes: 87.2%
Here:
87%
State:
92%
(% for various income ranges: 84.5% for AGIs below $25k, 89.0% for AGIs $25k-50k, 90.7% for AGIs $50k-75k, 91.5% for AGIs $75k-100k, 93.0% for AGIs $100k-200k, 100.0% for AGIs over 200k)
Averages for the 2012 tax year for zip code 90011, filed in 2013:
Average Adjusted Gross Income (AGI) in 2012: $23,041 (Individual Income Tax Returns)
Here:
$23,041
State:
$72,726
Salary/wage: $23,486 (reported on 84.8% of returns)
Here:
$23,486
State:
$59,079
(% of AGI for various income ranges: 79.9% for AGIs below $25k, 93.1% for AGIs $25k-50k, 91.8% for AGIs $50k-75k, 90.4% for AGIs $75k-100k, 65.2% for AGIs $100k-200k)
Taxable interest for individuals: $192 (reported on 9.4% of returns)
This zip code:
$192
California:
$2,146
(% of AGI for various income ranges: 0.5% for AGIs $100k-200k)
Ordinary dividends: $593 (reported on 0.8% of returns)
Here:
$593
State:
$9,308
(% of AGI for various income ranges: )
Net capital gain/loss in AGI: +$1,057 (reported on 0.6% of returns)
Here:
+$1,057
State:
+$30,460
(% of AGI for various income ranges: 0.7% for AGIs $75k-100k)
Profit/loss from business: +$9,758 (reported on 20.1% of returns)
Here:
+$9,758
State:
+$17,064
(% of AGI for various income ranges: 16.6% for AGIs below $25k, 3.6% for AGIs $25k-50k, 1.8% for AGIs $50k-75k, 1.1% for AGIs $75k-100k, 0.6% for AGIs $100k-200k)
Taxable individual retirement arrangement distribution: $8,200 (reported on 0.5% of returns)
90011:
$8,200
California:
$19,557
(% of AGI for various income ranges: 0.1% for AGIs $25k-50k, 0.5% for AGIs $50k-75k, 0.6% for AGIs $75k-100k)
Total itemized deductions: $17,358 (39% of AGI, reported on 11.0% of returns)
Here:
$17,358
State:
$34,004
Here:
38.7% of AGI
State:
22.7% of AGI
(% of AGI for various income ranges: 3.6% for AGIs below $25k, 9.3% for AGIs $25k-50k, 14.7% for AGIs $50k-75k, 16.8% for AGIs $75k-100k, 18.0% for AGIs $100k-200k)
Charity contributions: $2,084 (reported on 7.4% of returns)
Here:
$2,084
State:
$4,659
(% of AGI for various income ranges: 0.2% for AGIs below $25k, 0.7% for AGIs $25k-50k, 1.5% for AGIs $50k-75k, 1.7% for AGIs $75k-100k, 1.3% for AGIs $100k-200k)
Taxes paid: $4,045 (reported on 10.7% of returns)
90011:
$4,045
State:
$14,448
(% of AGI for various income ranges: 0.7% for AGIs below $25k, 1.8% for AGIs $25k-50k, 3.8% for AGIs $50k-75k, 4.9% for AGIs $75k-100k, 5.7% for AGIs $100k-200k)
Earned income credit: $2,901 (reported on 38.2% of returns)
Here:
$2,901
State:
$2,286
(% of AGI for various income ranges: 9.7% for AGIs below $25k, 2.1% for AGIs $25k-50k)
Percentage of individuals using paid preparers for their 2012 taxes: 81.9%
Here:
82%
State:
64%
(% for various income ranges: 81.9% for AGIs below $25k, 82.3% for AGIs $25k-50k, 81.4% for AGIs $50k-75k, 79.1% for AGIs $75k-100k, 82.4% for AGIs $100k-200k)
Averages for the 2004 tax year for zip code 90011, filed in 2005:
Average Adjusted Gross Income (AGI) in 2004: $20,486 (Individual Income Tax Returns)
Here:
$20,486
State:
$58,600
Salary/wage: $20,770 (reported on 88.8% of returns)
Here:
$20,770
State:
$49,455
(% of AGI for various income ranges: 80.1% for AGIs below $10k, 88.9% for AGIs $10k-25k, 94.8% for AGIs $25k-50k, 93.2% for AGIs $50k-75k, 84.5% for AGIs $75k-100k, 47.8% for AGIs over 100k)
Taxable interest for individuals: $261 (reported on 13.3% of returns)
This zip code:
$261
California:
$2,365
(% of AGI for various income ranges: 0.3% for AGIs below $10k, 0.1% for AGIs $10k-25k, 0.1% for AGIs $25k-50k, 0.2% for AGIs $50k-75k, 0.4% for AGIs $75k-100k, 0.3% for AGIs over 100k)
Taxable dividends: $497 (reported on 1.0% of returns)
Here:
$497
State:
$4,746
(% of AGI for various income ranges: 0.0% for AGIs below $10k, 0.0% for AGIs $10k-25k, 0.0% for AGIs $25k-50k, 0.0% for AGIs $50k-75k, 0.3% for AGIs $75k-100k, 0.0% for AGIs over 100k)
Net capital gain/loss: +$14,190 (reported on 0.8% of returns)
Here:
+$14,190
State:
+$23,418
(% of AGI for various income ranges: -0.0% for AGIs below $10k, -0.0% for AGIs $10k-25k, 0.1% for AGIs $25k-50k, 0.8% for AGIs $50k-75k, 4.7% for AGIs $75k-100k, 14.5% for AGIs over 100k)
Profit/loss from business: +$8,043 (reported on 15.9% of returns)
Here:
+$8,043
State:
+$16,826
(% of AGI for various income ranges: 22.3% for AGIs below $10k, 8.9% for AGIs $10k-25k, 2.8% for AGIs $25k-50k, 1.3% for AGIs $50k-75k, 0.5% for AGIs $75k-100k, 4.8% for AGIs over 100k)
IRA payment deduction: $1,624 (reported on 0.4% of returns)
90011:
$1,624
California:
$3,192
Total itemized deductions: $15,007 (41% of AGI, reported on 13.8% of returns)
Here:
$15,007
State:
$28,113
Here:
40.9% of AGI
State:
25.3% of AGI
(% of AGI for various income ranges: 4.6% for AGIs below $10k, 6.2% for AGIs $10k-25k, 12.4% for AGIs $25k-50k, 17.3% for AGIs $50k-75k, 18.3% for AGIs $75k-100k, 13.8% for AGIs over 100k)
Charity contributions deductions: $1,871 (5% of AGI, reported on 10.2% of returns)
Here:
$1,871
State:
$3,923
Here:
4.7% of AGI
State:
3.3% of AGI
(% of AGI for various income ranges: 0.1% for AGIs below $10k, 0.3% for AGIs $10k-25k, 1.2% for AGIs $25k-50k, 2.3% for AGIs $50k-75k, 2.8% for AGIs $75k-100k, 1.6% for AGIs over 100k)
Total tax: $1,706 (reported on 44.7% of returns)
90011:
$1,706
State:
$10,761
(% of AGI for various income ranges: 4.5% for AGIs below $10k, 2.4% for AGIs $10k-25k, 3.2% for AGIs $25k-50k, 6.0% for AGIs $50k-75k, 8.5% for AGIs $75k-100k, 17.2% for AGIs over 100k)
Earned income credit: $2,275 (reported on 44.7% of returns)
Here:
$2,275
State:
$1,763
Percentage of individuals using paid preparers for their 2004 taxes: 82.0%
Here:
82%
State:
66%
(% for various income ranges: 78.4% for AGIs below $10k, 82.9% for AGIs $10k-25k, 83.4% for AGIs $25k-50k, 80.9% for AGIs $50k-75k, 81.1% for AGIs $75k-100k, 88.8% for AGIs over 100k)
Likely homosexual households (counted as self-reported same-sex unmarried-partner households)
Lesbian couples: 0.1% of all households
Gay men: 0.1% of all households
Household received Food Stamps/SNAP in the past 12 months: 8,419 Household did not receive Food Stamps/SNAP in the past 12 months: 17,528
Women who had a birth in the past 12 months: 1,331 (474 now married, 866 unmarried) Women who did not have a birth in the past 12 months: 27,504 (7,899 now married, 19,730 unmarried)
Housing units in zip code 90011 with a mortgage: 4,832 (143 second mortgage, 28 home equity loan, 48 both second mortgage and home equity loan) Houses without a mortgage: 43
Median monthly owner costs for units with a mortgage: $2,307 Median monthly owner costs for units without a mortgage: $678
Residents with income below the poverty level in 2022:
This zip code:
27.2%
Whole state:
12.2%
Residents with income below 50% of the poverty level in 2022:
This zip code:
15.8%
Whole state:
6.2%
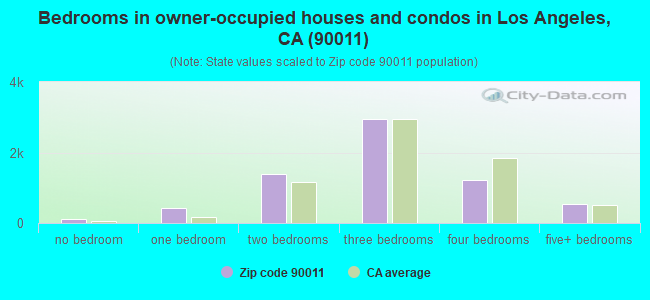
Median number of rooms in houses and condos:
Here:
5.4
State:
6.0
Median number of rooms in apartments:
Here:
4.1
State:
3.9
Notable locations in this zip code not listed on our city pages
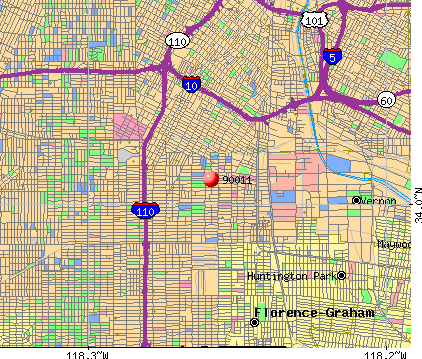
Notable locations in zip code 90011: Vernon Branch Los Angeles Public Library (A), Gilbert Lindsay Community Center (B), Ross Snyder Community Building (C), Henderson Community Center (D), Elsanto Nino Community Center (E), All Peoples Community Center (F), City of Los Angeles Fire Department Station 21 (G), City of Los Angeles Fire Department Station 14 (H). Display/hide their locations on the map
Churches in zip code 90011 include: Saint Patricks Catholic Church (A), Second Baptist Church (B), All Peoples Christian Church (C), Apostolic Holy Cross Church (D), Bethany Apostolic Faith Church (E), Bethel Church of Christ Holiness (F), Church of Christ (G), Church of God Chapel (H), Church of God in Christ Holiness (I). Display/hide their locations on the map
Parks in zip code 90011 include: Central Recreation Center (1), Roberts Recreation Center (2), Slauson Playground (3), Ross Snyder Recreation Center (4), South Park (5), Trinity Park (6). Display/hide their locations on the map
10,141 married couples with children.
11,833 single-parent households (4,430 men, 7,403 women).
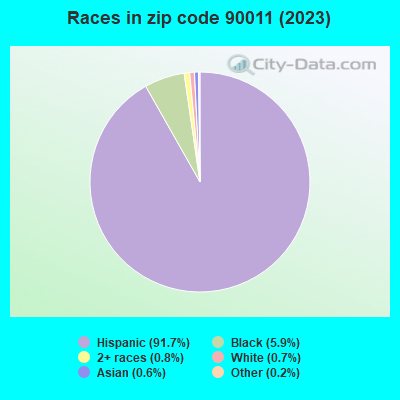
11.9% of residents of 90011 zip code speak English at home.
87.0% of residents speak Spanish at home (46% very well, 17% well, 21% not well, 16% not at all).
0.1% of residents speak other Indo-European language at home (41% very well, 59% well).
0.7% of residents speak Asian or Pacific Island language at home (26% very well, 27% well, 43% not well, 3% not at all).
0.4% of residents speak other language at home (89% very well, 2% well, 6% not well, 3% not at all).
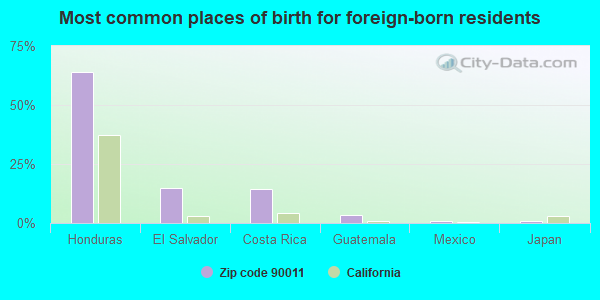
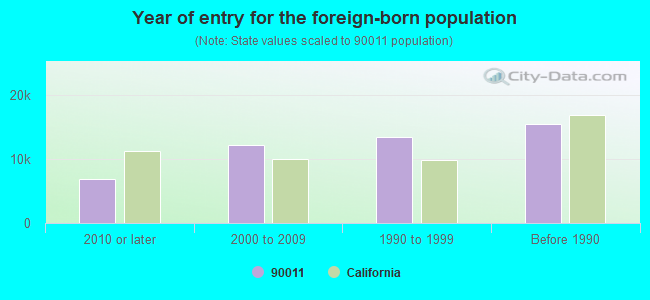
Foreign born population: 47,576 (45.2%) (26.9% of them are naturalized citizens)
Major facilities with environmental interests located in this zip code:
LOS ANGELES FIRE STATION 65 (1525 EAST 103 STREET in LOS ANGELES, CA)
STATE MASTER (California - Hazardous Waste Tracking) - HAZARDOU WASTE PROGRAM Small Quantity Generators, between 100 kg and 1000 kg of hazardous waste/month (Resource Conservation and Recovery Act (tracking hazardous waste)) - notification Organizations: CITY OF LOS ANGELES (CONTACT/OWNER)
Alternative names: CITY OF LA GENERAL SERVICES, LA FIRE STATION 65
LAC METRO TRANS AUTHORITY (5413 AVALON BOULEVARD in LOS ANGELES, CA)
STATE MASTER (California - Hazardous Waste Tracking) - HAZARDOU WASTE PROGRAM HAZARDOUS WASTE BIENNIAL REPORTER (Resource Conservation and Recovery Act (tracking hazardous waste)) Large Quantity Generators, more that 1000 kg of hazardous waste/month (Resource Conservation and Recovery Act (tracking hazardous waste)) - notification Alternative names: L.A.C.M.T.A., LACMTA DIVISION 14
HOOPER NEW PRIMARY CENTER (1280 E 52ND ST in LOS ANGELES, CA)
STATE MASTER (California - Hazardous Waste Tracking) - HAZARDOU WASTE PROGRAM Large Quantity Generators, more that 1000 kg of hazardous waste/month (Resource Conservation and Recovery Act (tracking hazardous waste)) - notification Organizations: LAUSD (CONTACT/OPERATOR)
ELECTROLIZING INCORPORATED (1947 HOOPER AVE. in LOS ANGELES, CA)
STATE MASTER (California - Hazardous Waste Tracking) - HAZARDOU WASTE PROGRAM HAZARDOUS WASTE BIENNIAL REPORTER (Resource Conservation and Recovery Act (tracking hazardous waste)) Large Quantity Generators, more that 1000 kg of hazardous waste/month (Resource Conservation and Recovery Act (tracking hazardous waste)) TRI REPORTER (Tracking of toxic chemicals releasing facilities) Business SIC and NAICS classification: ELECTROPLATING, PLATING, POLISHING, ANODIZING, AND COLORING
JEFFERSON NEW P C NO 6 (3601 S MAPLE AVE in LOS ANGELES, CA)
STATE MASTER (California - Hazardous Waste Tracking) - HAZARDOU WASTE PROGRAM Large Quantity Generators, more that 1000 kg of hazardous waste/month (Resource Conservation and Recovery Act (tracking hazardous waste)) - notification Organizations: LAUSD (CONTACT/OPERATOR)
JEFFERSON NEW ELEMENTARY SCHOOL NO 7 (1050 E 52ND PL in LOS ANGELES, CA)
STATE MASTER (California - Hazardous Waste Tracking) - HAZARDOU WASTE PROGRAM Large Quantity Generators, more that 1000 kg of hazardous waste/month (Resource Conservation and Recovery Act (tracking hazardous waste)) - notification Organizations: LAUSD (CONTACT/OPERATOR)
JEFFERSON NEW ELEMENTARY SCHOOL NO 1 (401 E 40TH PL in LOS ANGELES, CA)
STATE MASTER (California - Hazardous Waste Tracking) - HAZARDOU WASTE PROGRAM Large Quantity Generators, more that 1000 kg of hazardous waste/month (Resource Conservation and Recovery Act (tracking hazardous waste)) - notification Organizations: LAUSD (CONTACT/OPERATOR)
NEVIN E S (1569 E 32ND ST in LOS ANGELES, CA)
STATE MASTER (California - Hazardous Waste Tracking) - HAZARDOU WASTE PROGRAM Large Quantity Generators, more that 1000 kg of hazardous waste/month (Resource Conservation and Recovery Act (tracking hazardous waste)) - notification Organizations: L A UNIFIED SCHOOL DISTRICT (CONTACT/OWNER)
Alternative names: NEVIN AVENUE ELEMENTARY
JEFFERSON NEW E S NO 2 (899 E 42ND PL in LOS ANGELES, CA)
STATE MASTER (California - Hazardous Waste Tracking) - HAZARDOU WASTE PROGRAM Large Quantity Generators, more that 1000 kg of hazardous waste/month (Resource Conservation and Recovery Act (tracking hazardous waste)) - notification Organizations: L A UNIFIED SCHOOL DISTRICT (CONTACT/OWNER)
ALNA ENVELOPE COMPANY (1567 E 25TH ST. in LOS ANGELES, CA)
STATE MASTER (California - Hazardous Waste Tracking) - HAZARDOU WASTE PROGRAM Small Quantity Generators, between 100 kg and 1000 kg of hazardous waste/month (Resource Conservation and Recovery Act (tracking hazardous waste)) - notification Business NAICS classification: COMMERCIAL GRAVURE PRINTING.
LAUSD 49TH ST ELEM SCHOOL (750 E 49TH ST in LOS ANGELES, CA)
STATE MASTER (California - Hazardous Waste Tracking) - HAZARDOU WASTE PROGRAM Small Quantity Generators, between 100 kg and 1000 kg of hazardous waste/month (Resource Conservation and Recovery Act (tracking hazardous waste)) - notification Alternative names: FORTY-NINTH STREET ELEMENTARY, LAUSD/ 49TH ST ELEM
LOS ANGELES CHILDRENS COLLECTIVE CHILD CARE CENTER (3817 SOUTH SAN PEDRO STREET in LOS ANGELES, CA)
(Resource Conservation and Recovery Act (tracking hazardous waste)) Organizations: CITY OF LOS ANGELES (CONTACT/OWNER)
Alternative names: LA CHILD CARE PROJECT, LA CHILDRENS COLL CHILD CARE CTR
LAUSD 20TH ST ELEM SCHOOL (1353 E 20TH ST in LOS ANGELES, CA)
STATE MASTER (California - Hazardous Waste Tracking) - HAZARDOU WASTE PROGRAM Small Quantity Generators, between 100 kg and 1000 kg of hazardous waste/month (Resource Conservation and Recovery Act (tracking hazardous waste)) - notification Alternative names: TWENTIETH STREET ELEMENTARY
Housing units lacking complete plumbing facilities: 1.8% Housing units lacking complete kitchen facilities: 3.3%
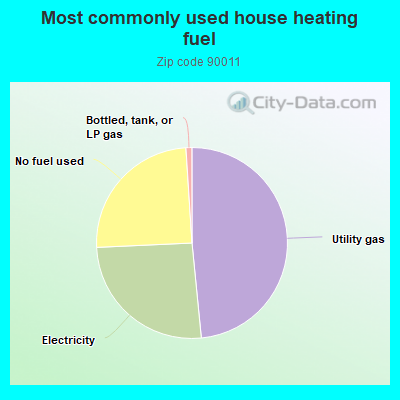
48.2%Utility gas
25.7%Electricity
24.6%No fuel used
1.0%Bottled, tank, or LP gas
Population in 1990: 96,074. Population change in the 1990s: +5,140 (+5.4%).
Place of birth for U.S.-born residents:
This state: 54,468
Northeast: 606
Midwest: 321
South: 1,314
West: 556
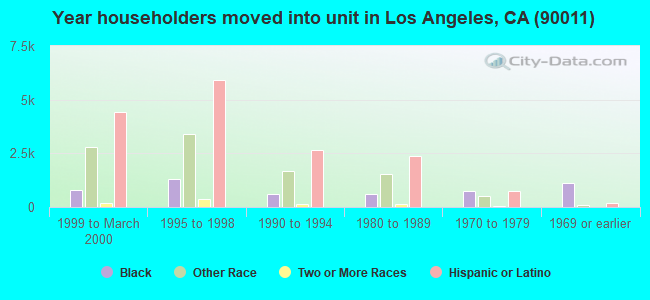
55% of the 90011 zip code residents lived in the same house 5 years ago. Out of people who lived in different houses, 96% lived in this county. Out of people who lived in different counties, 50% lived in California.
96% of the 90011 zip code residents lived in the same house 1 year ago. Out of people who lived in different houses, 89% moved from this county. Out of people who lived in different houses, 3% moved from different county within same state. Out of people who lived in different houses, 3% moved from different state. Out of people who lived in different houses, 10% moved from abroad.
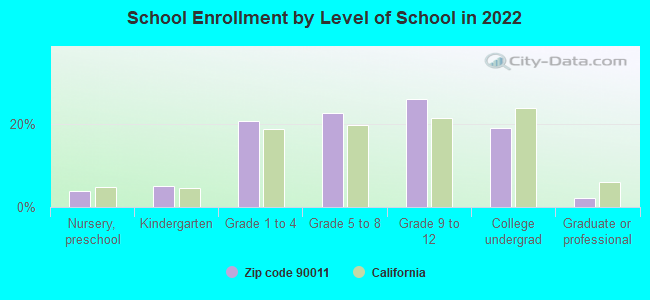
Private vs. public school enrollment:
Students in private schools in grades 1 to 8 (elementary and middle school): 743
Here:
5.5%
California:
10.5%
Students in private schools in grades 9 to 12 (high school): 229
Here:
2.8%
California:
8.5%
Students in private undergraduate colleges: 704
Here:
11.9%
California:
15.9%
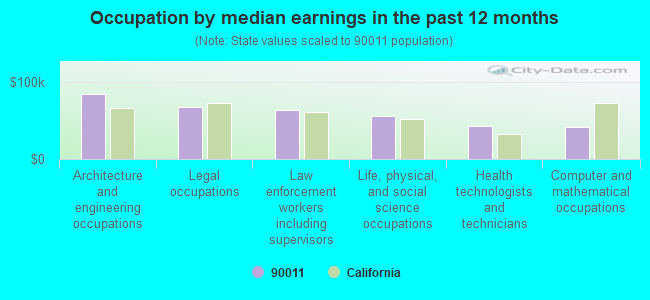
Occupation by median earnings in the past 12 months ($)
88,093Legal occupations
80,660Architecture and engineering occupations
62,998Life, physical, and social science occupations
41,305Community and social service occupations
40,754Health diagnosing and treating practitioners and other technical occupations
39,951Management occupations
Companies with federal contracts located in this zip code:
UNITED ALLOYS, INC (900 EAST SLAUSON AVENUE in LOS ANGELES, CA; small business)
$48,000 with Army for Plate, Sheet, Strip, and Foil; Nonferrous Base Metal. Signed on 2000-11-15. Completion date: 2000-12-30.
ROY E HANSON JR MFG (1924 COMPTON AVE in LOS ANGELES, CA; small business) : $44,500 in 4 contractsfrom 1999 to 2003
$30,516 with Navy for Driers, Dehydrators, and Anhydrators. Signed on 1999-10-27. Completion date: 1999-10-29.
$4,896 with Air Force for Industrial Boilers. Signed on 2003-12-03. Completion date: 2003-12-31.
$4,896 with Air Force for Space and Water Heating Equipment. Signed on 2003-01-22. Completion date: 2003-01-31.
$4,192, same as above.Signed on 2003-03-05. Completion date: 2003-05-14.
Top industries in this zip code by the number of employees in 2005:
2005 - 2018 National Fire Incident Reporting System (NFIRS) incidents
According to the data from the years 2005 - 2018 the average number of fires per year is 246. The highest number of reported fires - 371 took place in 2006, and the least - 174 in 2012. The data has a decreasing trend.
When looking into fire subcategories, the most incidents belonged to: Structure Fires (41.3%), and Outside Fires (29.3%).
Fire incident types reported to NFIRS in Zip Code 90011


 Nearest zip codes: 90037, 90021, 90089, 90015, 90007, 90079.
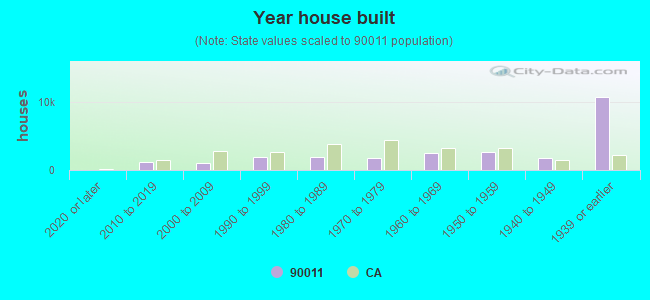


 According to the data from the years 2005 - 2018 the average number of fires per year is 246. The highest number of reported fires - 371 took place in 2006, and the least - 174 in 2012. The data has a decreasing trend.
 When looking into fire subcategories, the most incidents belonged to: Structure Fires (41.3%), and Outside Fires (29.3%).