Estimated zip code population in 2022: 61,049 Zip code population in 2010: 62,928 Zip code population in 2000: 63,277
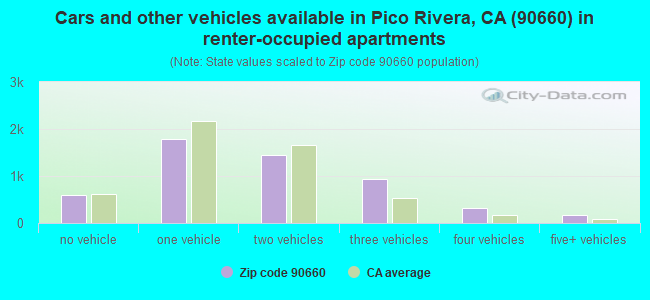
Houses and condos: 17,347 Renter-occupied apartments: 5,255
% of renters here:
31%
State:
44%
March 2022 cost of living index in zip code 90660: 133.0 (high, U.S. average is 100)
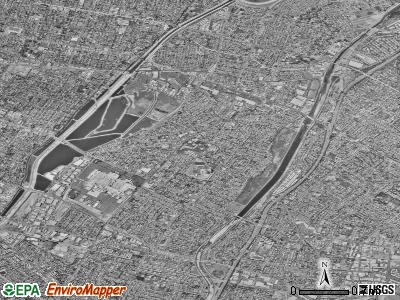
Land area: 7.7 sq. mi. Water area: 0.5 sq. mi.
Population density: 7,878 people per square mile
(high).
OSM Map
General Map
Google Map
MSN Map
OSM Map
General Map
Google Map
MSN Map
OSM Map
General Map
Google Map
MSN Map
OSM Map
General Map
Google Map
MSN Map
Please wait while loading the map...
Real estate property taxes paid for housing units in 2022:
This zip code:
0.6% ($3,886)
California:
0.7% ($4,831)
Median real estate property taxes paid for housing units with mortgages in 2022: $4,520 (0.7%) Median real estate property taxes paid for housing units with no mortgage in 2022: $2,542 (0.4%)
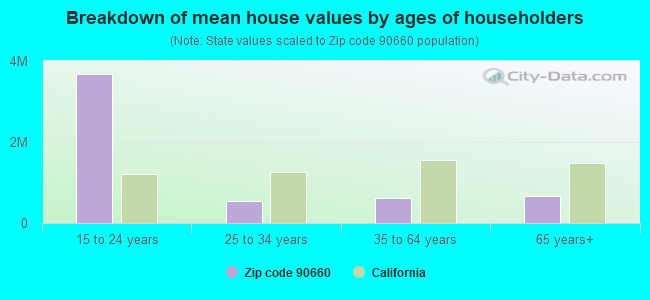
Estimated median house/condo value in 2022: $647,709
90660:
$647,709
California:
$715,900
According to our research of California and other state lists, there were 72 registered sex offenders living in 90660 zip code as of June 08, 2024. The ratio of all residents to sex offenders in zip code 90660 is 897 to 1. The ratio of registered sex offenders to all residents in this zip code is near the state average.
Median resident age:
This zip code:
39.6 years
California median age:
37.9 years
Average household size:
This zip code:
3.6 people
California:
2.8 people
Averages for the 2020 tax year for zip code 90660, filed in 2021:
Average Adjusted Gross Income (AGI) in 2020: $48,550 (Individual Income Tax Returns)
Here:
$48,550
State:
$95,910
Salary/wage: $46,781 (reported on 84.5% of returns)
Here:
$46,781
State:
$77,331
(% of AGI for various income ranges: 1201.7% for AGIs below $25k, 3944.7% for AGIs $25k-50k, 7416.5% for AGIs $50k-75k, 11178.3% for AGIs $75k-100k, 20024.0% for AGIs $100k-200k, 68035.0% for AGIs over 200k)
Taxable interest for individuals: $356 (reported on 25.5% of returns)
This zip code:
$356
California:
$2,294
(% of AGI for various income ranges: 5.7% for AGIs below $25k, 7.4% for AGIs $25k-50k, 14.7% for AGIs $50k-75k, 19.5% for AGIs $75k-100k, 49.0% for AGIs $100k-200k, 228.8% for AGIs over 200k)
Ordinary dividends: $1,205 (reported on 5.3% of returns)
Here:
$1,205
State:
$10,949
(% of AGI for various income ranges: 3.5% for AGIs below $25k, 6.3% for AGIs $25k-50k, 8.8% for AGIs $50k-75k, 16.2% for AGIs $75k-100k, 32.6% for AGIs $100k-200k, 181.2% for AGIs over 200k)
Net capital gain/loss in AGI: +$5,091 (reported on 6.6% of returns)
Here:
+$5,091
State:
+$49,306
(% of AGI for various income ranges: 1.1% for AGIs $25k-50k, 18.3% for AGIs $50k-75k, 29.9% for AGIs $75k-100k, 132.0% for AGIs $100k-200k, 8913.8% for AGIs over 200k)
Profit/loss from business: +$7,978 (reported on 15.3% of returns)
Here:
+$7,978
State:
+$15,671
(% of AGI for various income ranges: 187.4% for AGIs below $25k, 122.6% for AGIs $25k-50k, 131.6% for AGIs $50k-75k, 198.8% for AGIs $75k-100k, 243.3% for AGIs $100k-200k, 4163.8% for AGIs over 200k)
Taxable individual retirement arrangement distribution: $14,130 (reported on 2.8% of returns)
90660:
$14,130
California:
$23,505
(% of AGI for various income ranges: 22.4% for AGIs below $25k, 29.3% for AGIs $25k-50k, 57.7% for AGIs $50k-75k, 114.6% for AGIs $75k-100k, 265.8% for AGIs $100k-200k)
Total itemized deductions: $27,891 (reported on 12.9% of returns)
Here:
$27,891
State:
$39,517
(% of AGI for various income ranges: 60.1% for AGIs below $25k, 189.0% for AGIs $25k-50k, 631.3% for AGIs $50k-75k, 1328.1% for AGIs $75k-100k, 2215.0% for AGIs $100k-200k, 12345.0% for AGIs over 200k)
Charity contributions: $4,283 (reported on 10.8% of returns)
Here:
$4,283
State:
$12,598
(% of AGI for various income ranges: 3.2% for AGIs below $25k, 20.7% for AGIs $25k-50k, 79.2% for AGIs $50k-75k, 167.5% for AGIs $75k-100k, 318.0% for AGIs $100k-200k, 1826.2% for AGIs over 200k)
Taxes paid: $8,675 (reported on 12.8% of returns)
90660:
$8,675
State:
$8,807
(% of AGI for various income ranges: 15.5% for AGIs below $25k, 54.3% for AGIs $25k-50k, 198.6% for AGIs $50k-75k, 443.6% for AGIs $75k-100k, 740.5% for AGIs $100k-200k, 2532.5% for AGIs over 200k)
Earned income credit: $2,011 (reported on 17.6% of returns)
Here:
$2,011
State:
$2,074
(% of AGI for various income ranges: 92.4% for AGIs below $25k, 60.7% for AGIs $25k-50k, 0.9% for AGIs $50k-75k)
Percentage of individuals using paid preparers for their 2020 taxes: 91.5%
Here:
91%
State:
92%
(% for various income ranges: 90.2% for AGIs below $25k, 92.3% for AGIs $25k-50k, 91.4% for AGIs $50k-75k, 92.5% for AGIs $75k-100k, 92.3% for AGIs $100k-200k, 93.3% for AGIs over 200k)
Averages for the 2012 tax year for zip code 90660, filed in 2013:
Average Adjusted Gross Income (AGI) in 2012: $38,919 (Individual Income Tax Returns)
Here:
$38,919
State:
$72,726
Salary/wage: $37,595 (reported on 86.1% of returns)
Here:
$37,595
State:
$59,079
(% of AGI for various income ranges: 75.7% for AGIs below $25k, 86.9% for AGIs $25k-50k, 87.3% for AGIs $50k-75k, 87.7% for AGIs $75k-100k, 86.2% for AGIs $100k-200k, 34.8% for AGIs over 200k)
Taxable interest for individuals: $385 (reported on 23.9% of returns)
This zip code:
$385
California:
$2,146
(% of AGI for various income ranges: 0.3% for AGIs below $25k, 0.2% for AGIs $25k-50k, 0.2% for AGIs $50k-75k, 0.2% for AGIs $75k-100k, 0.2% for AGIs $100k-200k, 0.6% for AGIs over 200k)
Ordinary dividends: $1,290 (reported on 4.6% of returns)
Here:
$1,290
State:
$9,308
(% of AGI for various income ranges: 0.2% for AGIs below $25k, 0.1% for AGIs $25k-50k, 0.1% for AGIs $50k-75k, 0.1% for AGIs $75k-100k, 0.2% for AGIs $100k-200k, 0.3% for AGIs over 200k)
Net capital gain/loss in AGI: +$2,011 (reported on 3.5% of returns)
Here:
+$2,011
State:
+$30,460
(% of AGI for various income ranges: 0.2% for AGIs $75k-100k, 0.5% for AGIs $100k-200k, 2.2% for AGIs over 200k)
Profit/loss from business: +$9,239 (reported on 13.8% of returns)
Here:
+$9,239
State:
+$17,064
(% of AGI for various income ranges: 10.8% for AGIs below $25k, 3.2% for AGIs $25k-50k, 1.6% for AGIs $50k-75k, 0.9% for AGIs $75k-100k, 1.5% for AGIs $100k-200k)
Taxable individual retirement arrangement distribution: $10,383 (reported on 3.9% of returns)
90660:
$10,383
California:
$19,557
(% of AGI for various income ranges: 1.2% for AGIs below $25k, 0.8% for AGIs $25k-50k, 1.0% for AGIs $50k-75k, 1.1% for AGIs $75k-100k, 1.5% for AGIs $100k-200k)
Total itemized deductions: $21,935 (32% of AGI, reported on 30.4% of returns)
Here:
$21,935
State:
$34,004
Here:
31.7% of AGI
State:
22.7% of AGI
(% of AGI for various income ranges: 8.0% for AGIs below $25k, 14.1% for AGIs $25k-50k, 19.6% for AGIs $50k-75k, 21.7% for AGIs $75k-100k, 21.8% for AGIs $100k-200k, 21.4% for AGIs over 200k)
Charity contributions: $2,143 (reported on 25.0% of returns)
Here:
$2,143
State:
$4,659
(% of AGI for various income ranges: 0.4% for AGIs below $25k, 1.1% for AGIs $25k-50k, 1.6% for AGIs $50k-75k, 1.9% for AGIs $75k-100k, 1.8% for AGIs $100k-200k, 1.7% for AGIs over 200k)
Taxes paid: $6,272 (reported on 30.3% of returns)
90660:
$6,272
State:
$14,448
(% of AGI for various income ranges: 1.6% for AGIs below $25k, 3.4% for AGIs $25k-50k, 5.4% for AGIs $50k-75k, 6.5% for AGIs $75k-100k, 7.4% for AGIs $100k-200k, 7.8% for AGIs over 200k)
Earned income credit: $2,320 (reported on 25.9% of returns)
Here:
$2,320
State:
$2,286
(% of AGI for various income ranges: 7.4% for AGIs below $25k, 1.5% for AGIs $25k-50k)
Percentage of individuals using paid preparers for their 2012 taxes: 74.3%
Here:
74%
State:
64%
(% for various income ranges: 70.6% for AGIs below $25k, 76.3% for AGIs $25k-50k, 77.6% for AGIs $50k-75k, 79.1% for AGIs $75k-100k, 79.6% for AGIs $100k-200k, 87.5% for AGIs over 200k)
Averages for the 2004 tax year for zip code 90660, filed in 2005:
Average Adjusted Gross Income (AGI) in 2004: $33,996 (Individual Income Tax Returns)
Here:
$33,996
State:
$58,600
Salary/wage: $33,356 (reported on 87.9% of returns)
Here:
$33,356
State:
$49,455
(% of AGI for various income ranges: 87.0% for AGIs below $10k, 82.0% for AGIs $10k-25k, 89.7% for AGIs $25k-50k, 90.6% for AGIs $50k-75k, 90.9% for AGIs $75k-100k, 69.8% for AGIs over 100k)
Taxable interest for individuals: $560 (reported on 31.7% of returns)
This zip code:
$560
California:
$2,365
(% of AGI for various income ranges: 2.3% for AGIs below $10k, 0.7% for AGIs $10k-25k, 0.4% for AGIs $25k-50k, 0.3% for AGIs $50k-75k, 0.3% for AGIs $75k-100k, 0.8% for AGIs over 100k)
Taxable dividends: $997 (reported on 6.8% of returns)
Here:
$997
State:
$4,746
(% of AGI for various income ranges: 0.6% for AGIs below $10k, 0.3% for AGIs $10k-25k, 0.1% for AGIs $25k-50k, 0.1% for AGIs $50k-75k, 0.1% for AGIs $75k-100k, 0.5% for AGIs over 100k)
Net capital gain/loss: +$9,239 (reported on 4.7% of returns)
Here:
+$9,239
State:
+$23,418
(% of AGI for various income ranges: -0.7% for AGIs below $10k, 0.1% for AGIs $10k-25k, 0.2% for AGIs $25k-50k, 0.4% for AGIs $50k-75k, 0.7% for AGIs $75k-100k, 8.3% for AGIs over 100k)
Profit/loss from business: +$8,880 (reported on 12.4% of returns)
Here:
+$8,880
State:
+$16,826
(% of AGI for various income ranges: 11.5% for AGIs below $10k, 6.9% for AGIs $10k-25k, 2.7% for AGIs $25k-50k, 1.6% for AGIs $50k-75k, 1.2% for AGIs $75k-100k, 3.5% for AGIs over 100k)
IRA payment deduction: $2,456 (reported on 1.3% of returns)
90660:
$2,456
California:
$3,192
(% of AGI for various income ranges: 0.1% for AGIs below $10k, 0.1% for AGIs $10k-25k, 0.1% for AGIs $25k-50k, 0.1% for AGIs $50k-75k, 0.1% for AGIs $75k-100k, 0.1% for AGIs over 100k)
Self-employed pension: $7,944 (reported on 0.1% of returns)
Here:
$7,944
California:
$17,688
Total itemized deductions: $19,223 (34% of AGI, reported on 34.0% of returns)
Here:
$19,223
State:
$28,113
Here:
33.8% of AGI
State:
25.3% of AGI
(% of AGI for various income ranges: 13.7% for AGIs below $10k, 10.0% for AGIs $10k-25k, 18.7% for AGIs $25k-50k, 23.4% for AGIs $50k-75k, 24.0% for AGIs $75k-100k, 20.4% for AGIs over 100k)
Charity contributions deductions: $2,078 (4% of AGI, reported on 30.0% of returns)
Here:
$2,078
State:
$3,923
Here:
3.5% of AGI
State:
3.3% of AGI
(% of AGI for various income ranges: 0.5% for AGIs below $10k, 0.7% for AGIs $10k-25k, 1.7% for AGIs $25k-50k, 2.2% for AGIs $50k-75k, 2.5% for AGIs $75k-100k, 2.3% for AGIs over 100k)
Total tax: $3,386 (reported on 66.9% of returns)
90660:
$3,386
State:
$10,761
(% of AGI for various income ranges: 3.4% for AGIs below $10k, 3.4% for AGIs $10k-25k, 5.0% for AGIs $25k-50k, 6.6% for AGIs $50k-75k, 7.9% for AGIs $75k-100k, 14.5% for AGIs over 100k)
Earned income credit: $1,826 (reported on 22.4% of returns)
Here:
$1,826
State:
$1,763
Percentage of individuals using paid preparers for their 2004 taxes: 72.9%
Here:
73%
State:
66%
(% for various income ranges: 65.1% for AGIs below $10k, 71.5% for AGIs $10k-25k, 74.0% for AGIs $25k-50k, 78.1% for AGIs $50k-75k, 81.3% for AGIs $75k-100k, 82.1% for AGIs over 100k)
Household received Food Stamps/SNAP in the past 12 months: 2,595 Household did not receive Food Stamps/SNAP in the past 12 months: 14,455
Women who had a birth in the past 12 months: 557 (276 now married, 283 unmarried) Women who did not have a birth in the past 12 months: 14,636 (5,055 now married, 9,612 unmarried)
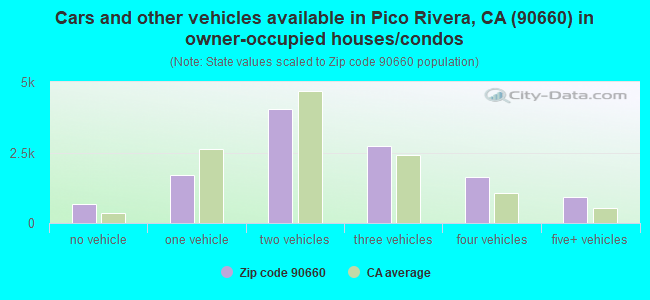
Housing units in zip code 90660 with a mortgage: 7,346 (449 second mortgage, 16 home equity loan, 249 both second mortgage and home equity loan) Houses without a mortgage: 103
Median monthly owner costs for units with a mortgage: $2,370 Median monthly owner costs for units without a mortgage: $525
Residents with income below the poverty level in 2022:
This zip code:
9.6%
Whole state:
12.2%
Residents with income below 50% of the poverty level in 2022:
This zip code:
4.8%
Whole state:
6.2%
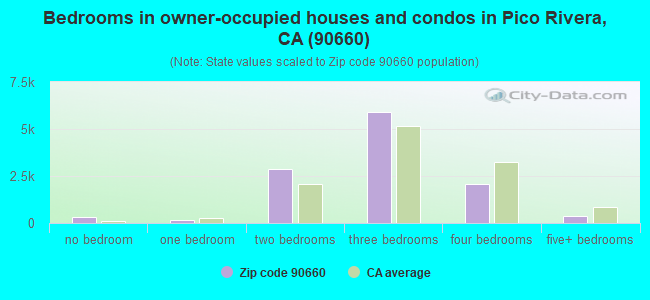
Median number of rooms in houses and condos:
Here:
5.3
State:
6.0
Median number of rooms in apartments:
Here:
3.7
State:
3.9
Notable locations in this zip code not listed on our city pages
Notable locations in zip code 90660: Pico Rivera City Hall (A), Rivera Branch County of Los Angeles Public Library (B), Pico Rivera Branch County of Los Angeles Public Library (C), Pico Rivera Sheriffs Station (D), Los Angeles County Fire Department Station 103 (E), Los Angeles County Fire Department Station 40 (F), Los Angeles County Fire Department Station 25 (G). Display/hide their locations on the map
Churches in zip code 90660 include: Pico Rivera United Methodist Church (A), First Bilingual Baptist Church (B), Church of Jesus Christ of Latter Day Saints (C), Shia Ithnaasheri Islamic Center (D), Peace Lutheran Church (E), Rivera Bapitst Church (F), Kingdom Hall of Jehovah's Witnesses (G), Pico First Baptist Church (H), Pico Rivera Bible Church (I). Display/hide their locations on the map
Parks in zip code 90660 include: Pico Park (1), Rio Hondo Park (2), Rivera Park (3), William A Smith Park (4), Streamland Park (5). Display/hide their locations on the map
5,662 married couples with children.
2,305 single-parent households (735 men, 1,570 women).
34.2% of residents of 90660 zip code speak English at home.
62.7% of residents speak Spanish at home (66% very well, 14% well, 14% not well, 6% not at all).
0.7% of residents speak other Indo-European language at home (79% very well, 17% well, 4% not well).
2.7% of residents speak Asian or Pacific Island language at home (47% very well, 29% well, 17% not well, 7% not at all).
0.1% of residents speak other language at home (100% very well).
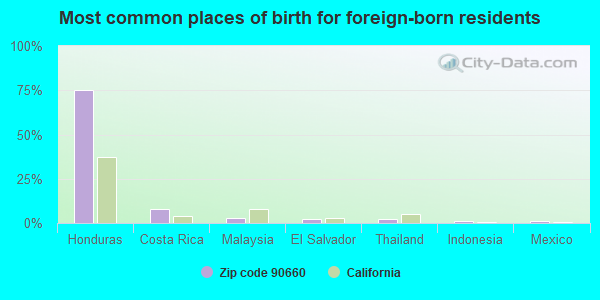
Foreign born population: 18,651 (30.6%) (57.0% of them are naturalized citizens)
This zip code:
30.6%
Whole state:
26.7%
75%Honduras
8%Costa Rica
3%Malaysia
2%El Salvador
2%Thailand
1%Indonesia
1%Mexico
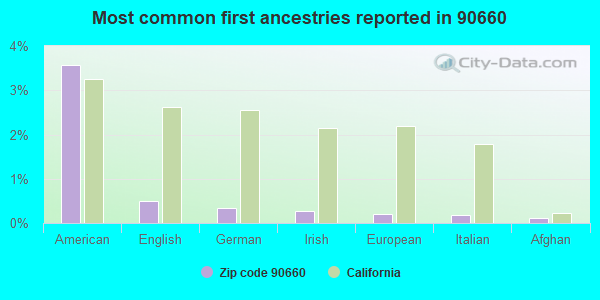
4%American
1%English
0%German
0%Irish
0%European
0%Italian
0%Afghan
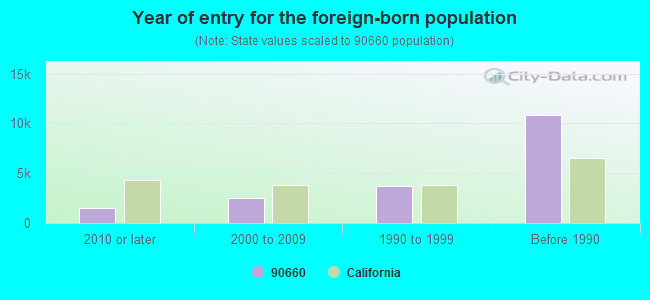
Year of entry for the foreign-born population
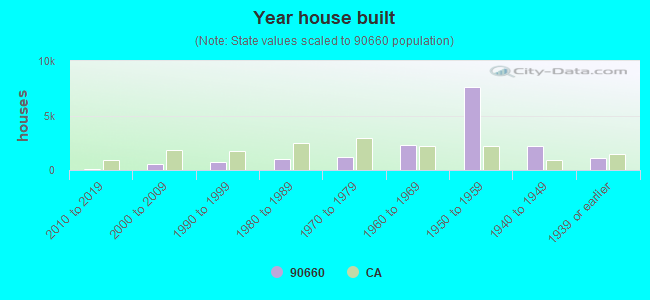
1,5132010 or later
2,5212000 to 2009
3,6741990 to 1999
10,851Before 1990
Major facilities with environmental interests located in this zip code:
LOS ANGELES COUNTY AGRICULTURAL COMMISSIONER (8841 EAST SLAUSON AVENUE in PICO RIVERA, CA)
STATE MASTER (California - Hazardous Waste Tracking) - HAZARDOU WASTE PROGRAM Large Quantity Generators, more that 1000 kg of hazardous waste/month (Resource Conservation and Recovery Act (tracking hazardous waste)) TRANSPORTER (Resource Conservation and Recovery Act (tracking hazardous waste)) TSD (Resource Conservation and Recovery Act (tracking hazardous waste)) Organizations: LA CO AGRICULTURAL COMMISSIONER (CONTACT/OPERATOR)
Alternative names: LOS ANGELES CO AGRI COMM, LOS ANGELES CTY AGRICULTURAL COMMISSION
ADVANCE TRUCK PAINTING INCORPORATED (7746 INDUSTRY AVE in PICO RIVERA, CA)
AIR MAJOR (AIRS/AFS) STATE MASTER (California - Hazardous Waste Tracking) - HAZARDOU WASTE PROGRAM CRITERIA AND HAZARDOUS AIR POLLUTANT INVENTORY (Inventory of air pollution sources) Small Quantity Generators, between 100 kg and 1000 kg of hazardous waste/month (Resource Conservation and Recovery Act (tracking hazardous waste)) - notification Business SIC classification: PAINTING AND PAPER HANGING; TOP, BODY, AND UPHOLSTERY REPAIR SHOPS AND PAINT SHOPS Business NAICS classification: AUTOMOTIVE BODY, PAINT, AND INTERIOR REPAIR AND MAINTENANCE. Organizations: CORPORATION (CONTACT/OWNER)
MONTEBELLO GARDENS ELEMENTARY (4700 PINE ST in PICO RIVERA, CA)
(National Center for Education Statistics) - STATE ID-6020614 Small Quantity Generators, between 100 kg and 1000 kg of hazardous waste/month (Resource Conservation and Recovery Act (tracking hazardous waste)) - notification Organizations: MONTEBELLO USD (CONTACT/OWNER)
, MONTEBELLO UNIFIED (SCHOOL DISTRICT)
Alternative names: MONTEBELLO USD MONTEBELLO GARDENS ELE
HARWICK STANDARD DISTRIBUTION CORPORATION (7225 PARAMOUNT BOULEVARD in PICO RIVERA, CA)
STATE MASTER (California - Hazardous Waste Tracking) - HAZARDOU WASTE PROGRAM Small Quantity Generators, between 100 kg and 1000 kg of hazardous waste/month (Resource Conservation and Recovery Act (tracking hazardous waste)) - notification TRI REPORTER (Tracking of toxic chemicals releasing facilities) Business SIC classification: CHEMICALS AND ALLIED PRODUCTS Organizations: HARWICK CHEMICAL CORP (CONTACT/OWNER)
Alternative names: HARWICK CHEMICAL
ERUSD RIO VISTA ELEMENTARY (8809 COFFMAN PICO RD in PICO RIVERA, CA)
(National Center for Education Statistics) - STATE ID-6013379 Small Quantity Generators, between 100 kg and 1000 kg of hazardous waste/month (Resource Conservation and Recovery Act (tracking hazardous waste)) - notification Organizations: EL RANCHO UNIFIED SCHL DIST (CONTACT/OWNER)
, EL RANCHO UNIFIED (SCHOOL DISTRICT)
ERUSD DURFEE ELEMENTARY (4220 S DURFEE AVE in PICO RIVERA, CA)
(National Center for Education Statistics) - STATE ID-6013312 Small Quantity Generators, between 100 kg and 1000 kg of hazardous waste/month (Resource Conservation and Recovery Act (tracking hazardous waste)) - notification Organizations: EL RANCHO UNIFIED SCHL DIST (CONTACT/OWNER)
, EL RANCHO UNIFIED (SCHOOL DISTRICT)
LUBRICATING SPECIALTIES CO (8015 PARAMOUNT BOULEVARD in PICO RIVERA, CA)
OIL CONTROL (Facility Response Plan for oil discharge) CRITERIA AND HAZARDOUS AIR POLLUTANT INVENTORY (Inventory of air pollution sources) National Pollutant Discharge Elimination System NON-MAJOR (Tracking pollutant discharge elimination systems) - permit Small Quantity Generators, between 100 kg and 1000 kg of hazardous waste/month (Resource Conservation and Recovery Act (tracking hazardous waste)) - notification TRI REPORTER (Tracking of toxic chemicals releasing facilities) Business SIC classification: LUBRICATING OILS AND GREASES; NONCLASSIFIABLE ESTABLISHMENTS Business NAICS classification: PETROLEUM LUBRICATING OIL AND GREASE MANUFACTURING. Organizations: LUBRICATING SPECIALTIES COMPANY (CONTACT/GENERAL)
, THE LUBRIZOL CORPORATION (CONTACT/OWNER)
Alternative names: LUBRICATING SPECIALITIES CO, THE LUBRIZOL CORP C O L S C, PICO RIVERA, OIL BLENDING
(National Center for Education Statistics) - STATE ID-6013338 Small Quantity Generators, between 100 kg and 1000 kg of hazardous waste/month (Resource Conservation and Recovery Act (tracking hazardous waste)) - notification Organizations: EL RANCHO UNIFIED SCHL DIST (CONTACT/OWNER)
, EL RANCHO UNIFIED (SCHOOL DISTRICT)
Alternative names: ERUSD MAGEE ELEMENTARY
ABF FREIGHT SYSTEMS INC (8001 TELEGRAPH RD in PICO RIVERA, CA)
STATE MASTER (California - Hazardous Waste Tracking) - HAZARDOU WASTE PROGRAM Small Quantity Generators, between 100 kg and 1000 kg of hazardous waste/month (Resource Conservation and Recovery Act (tracking hazardous waste))
HALOPOFF PROPERTIES L L C (7963 PARAMOUNT BLVD in PICO RIVERA, CA)
STATE MASTER (California - Hazardous Waste Tracking) - HAZARDOU WASTE PROGRAM Small Quantity Generators, between 100 kg and 1000 kg of hazardous waste/month (Resource Conservation and Recovery Act (tracking hazardous waste)) - notification
J T MCKINNEY CO (8400 E SLAUSON AVE in PICO RIVERA, CA)
STATE MASTER (California - Hazardous Waste Tracking) - HAZARDOU WASTE PROGRAM Small Quantity Generators, between 100 kg and 1000 kg of hazardous waste/month (Resource Conservation and Recovery Act (tracking hazardous waste)) - notification Organizations: VEHICLE SERVICES INC (CONTACT/OWNER)
CHEVRON STATION NO 97799 (9337 WASHINGTON BLVD in PICO RIVERA, CA)
STATE MASTER (California - Hazardous Waste Tracking) - HAZARDOU WASTE PROGRAM Small Quantity Generators, between 100 kg and 1000 kg of hazardous waste/month (Resource Conservation and Recovery Act (tracking hazardous waste)) - notification Organizations: CHEVRON PRODUCTS CO (CONTACT/OWNER)
C & T INTERNATIONAL INC (7317 PARAMOUNT BLVD in PICO RIVERA, CA)
STATE MASTER (California - Hazardous Waste Tracking) - HAZARDOU WASTE PROGRAM Small Quantity Generators, between 100 kg and 1000 kg of hazardous waste/month (Resource Conservation and Recovery Act (tracking hazardous waste))
Housing units lacking complete plumbing facilities: 0.2% Housing units lacking complete kitchen facilities: 1.7%
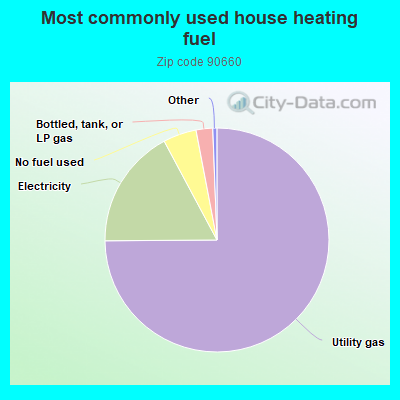
74.9%Utility gas
17.3%Electricity
4.8%No fuel used
2.4%Bottled, tank, or LP gas
Population in 1990: 58,891. Population change in the 1990s: +4,386 (+7.4%).
Place of birth for U.S.-born residents:
This state: 39,637
Northeast: 258
Midwest: 328
South: 1,059
West: 839
66% of the 90660 zip code residents lived in the same house 5 years ago. Out of people who lived in different houses, 92% lived in this county. Out of people who lived in different counties, 50% lived in California.
97% of the 90660 zip code residents lived in the same house 1 year ago. Out of people who lived in different houses, 82% moved from this county. Out of people who lived in different houses, 22% moved from different county within same state. Out of people who lived in different houses, 3% moved from different state. Out of people who lived in different houses, 3% moved from abroad.
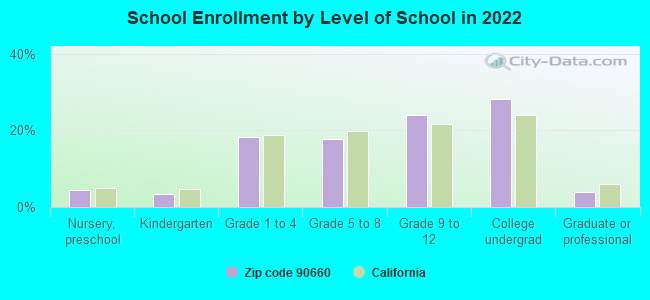
Private vs. public school enrollment:
Students in private schools in grades 1 to 8 (elementary and middle school): 523
Here:
9.8%
California:
10.5%
Students in private schools in grades 9 to 12 (high school): 233
Here:
6.5%
California:
8.5%
Students in private undergraduate colleges: 392
Here:
9.4%
California:
15.9%
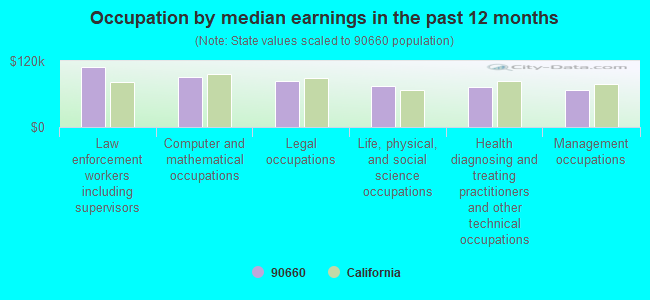
Occupation by median earnings in the past 12 months ($)
108,743Law enforcement workers including supervisors
90,322Computer and mathematical occupations
82,884Legal occupations
73,986Life, physical, and social science occupations
72,317Health diagnosing and treating practitioners and other technical occupations
67,352Management occupations
Companies with biggest federal contracts located in this zip code (PICO RIVERA, CA):
NORTHROP GRUMMAN CORPORATION (8900 WASHINGTON BLVD) : $1,522,367,099 in 701 contractsfrom 1999 to 2006
Contracts for Defense Electronics and Communication Equipment -- Operational Systems Development (R&D), Aircraft, Fixed Wing, Other Defense -- Advanced Development (R&D), Maintenance, Repair and Rebuilding of Equipment -- Aircraft and Airframe Structural Components, and moreby Air Force, Department of Defense, NASA, Defense Logistics Agency, and others Signed by year:2000: $217,786,830; 2001: $196,291,781; 2002: $1,061,175; 2003: $6,250; 2004: $276,344,971; 2005: $443,219,377; 2006: $291,721,286.
Biggest contracts:
$98,583,837 with Air Force for Defense Electronics and Communication Equipment -- Operational Systems Development (R&D). Signed on 2004-10-29. Completion date: 2008-12-30.
$94,000,000 with Air Force for Aircraft, Fixed Wing. Signed on 2006-02-03. Completion date: 2008-12-30.
$70,000,000, same as above.Signed on 1999-11-19. Completion date: 1997-08-01.
$35,000,000, same as above.Signed on 2000-03-13. Completion date: 2000-12-31.
LUBRICATING SPECIALTIES COMPAN (8015 PARAMOUNT BLVD; small business) : $7,472,834 in 49 contractsfrom 2000 to 2006
Contracts for Oils and Greases: Cutting, Lubricating, and Hydraulic by Defense Logistics Agency, Air Force Signed by year:2000: $395,390; 2001: $923,590; 2002: $804,955; 2003: $503,230; 2004: $793,766; 2005: $1,824,590; 2006: $2,227,313.
Biggest contracts:
$1,008,613 with Defense Logistics Agency for Oils and Greases: Cutting, Lubricating, and Hydraulic. Signed on 2006-04-14. Completion date: 2006-07-11.
$882,160, same as above.Signed on 2006-03-21. Completion date: 2007-04-30.
$685,748, same as above.Signed on 2005-12-09. Completion date: 2006-03-09.
$661,000, same as above.Signed on 2005-03-03. Completion date: 2006-04-30.
UNITED RENTALS, INC (3455 SAN GABRIEL RIVER PKW; small business) : $2,783,420 in 6 contractsfrom 2005 to 2006
Contracts for Miscellaneous Maintenance and Repair Shop Specialized Equipment, Ground Effect Vehicles, Aircraft Ground Servicing Equipment by Air Force, Navy Signed by year:2000: $0; 2001: $0; 2002: $0; 2003: $0; 2004: $0; 2005: $2,513,418; 2006: $270,002.
Biggest contracts:
$2,304,018 with Air Force for Miscellaneous Maintenance and Repair Shop Specialized Equipment. Signed on 2005-07-14. Completion date: 2006-06-30.
$256,002, same as above.Signed on 2006-03-16. Completion date: 2006-07-21.
$138,800 with Navy for Ground Effect Vehicles. Signed on 2005-03-01. Completion date: 2005-05-05.
$68,000 with Air Force for Aircraft Ground Servicing Equipment. Signed on 2005-09-28. Completion date: 2006-01-23.
MC KINNEY VEHICLE SERVICES INC (8400 E SLAVSON AVE; small business) : $1,208,713 in 36 contractsfrom 2000 to 2006
Contracts for Lease or Rental of Equipment -- Ground Effect Vehicles, Motor Vehicles, Trailers, and Cycles, Operation of Government-Owned Facilities -- Office Buildings, Specialized Metal Container Manufacturing Machinery and Related Equipment, Prefabricated and Portable Buildings, and moreby Army, Air Force, Navy, Defense Commissary Agency, and others Signed by year:2000: $109,536; 2001: $0; 2002: $0; 2003: $162,843; 2004: $373,625; 2005: $559,159; 2006: $3,550.
Biggest contracts:
$338,900 with Army for Lease or Rental of Equipment -- Ground Effect Vehicles, Motor Vehicles, Trailers, and Cycles. Taking place in WA. Signed on 2004-08-11. Completion date: 2005-02-13.
$299,000 with Air Force for Operation of Government-Owned Facilities -- Office Buildings. Taking place in AZ. Signed on 2005-07-01. Completion date: 2005-09-09.
$164,098 with Army for Specialized Metal Container Manufacturing Machinery and Related Equipment. Signed on 2005-12-14. Completion date: 2006-03-15.
$109,536 with Navy for Prefabricated and Portable Buildings. Taking place in WA. Signed on 2000-10-31. Completion date: 2001-03-19.
METAL TITE PRODUCTS (4880 GREGG RD; small business) : $292,630 in 2 contractsfrom 2004 to 2005
$271,630 with Navy for Hardware, Commercial. Signed on 2004-09-30. Completion date: 2005-05-01.
$21,000, same as above.Signed on 2005-07-18. Completion date: 2005-05-01.
INTERNATIONAL PAINT INC (4324 SAN GABRIEL RIVER PK) : $230,010 in 4 contractsfrom 1999 to 2002
$85,619 with Navy for Paints, Dopes, Varnishes, and Related Products. Signed on 1999-11-10. Completion date: 2000-01-10.
$67,777, same as above.Signed on 1999-11-07. Completion date: 2000-01-15.
$51,534, same as above.Signed on 2000-12-28. Completion date: 2001-01-08.
$25,080, same as above.Signed on 2002-03-15. Completion date: 2002-03-29.
EXTER CORP (3666 SAN GABRIEL RIVER PK; small business) : $129,912 in 6 contractsfrom 2001 to 2006
Contracts for Miscellaneous Special Industry Machinery, Maintenance, Repair and Rebuilding of Equipment -- Water Purification and Sewage Treatment Equipment, Space Vehicle Maintenance, Repair, and Checkout Specialized Equipment, Miscellaneous Maintenance and Repair Shop Specialized Equipment by Army, Navy Signed by year:2000: $0; 2001: $54,312; 2002: $40,000; 2003: $0; 2004: $17,800; 2005: $650; 2006: $17,150.
Biggest contracts:
$54,312 with Army for Miscellaneous Special Industry Machinery. Signed on 2001-09-15. Completion date: 2002-09-30.
$40,000 with Navy for Maintenance, Repair and Rebuilding of Equipment -- Water Purification and Sewage Treatment Equipment. Signed on 2002-02-13. Completion date: 2002-09-30.
$17,800 with Army for Space Vehicle Maintenance, Repair, and Checkout Specialized Equipment. Signed on 2004-09-07. Completion date: 2005-09-14.
$17,150 with Army for Miscellaneous Maintenance and Repair Shop Specialized Equipment. Signed on 2006-03-14. Completion date: 2006-09-30.
C B C INDUSTRIES INC (7141 PARAMOUNT BLVD; small business) : $104,438 in 6 contractsfrom 2004 to 2005
Contracts for Vehicular Cab, Body, and Frame Structural Components, Bolts, Bushings, Rings, Shims, and Spacers by Army Signed by year:2000: $0; 2001: $0; 2002: $0; 2003: $0; 2004: $38,225; 2005: $66,213; 2006: $0.
Biggest contracts:
$40,542 with Army for Vehicular Cab, Body, and Frame Structural Components. Signed on 2005-01-22. Completion date: 2005-02-03.
$31,681, same as above.Signed on 2004-11-13. Completion date: 2004-12-06.
$16,624 with Army for Bolts. Signed on 2005-02-11. Completion date: 2005-03-04.
$8,722 with Army for Bushings, Rings, Shims, and Spacers. Signed on 2005-08-31. Completion date: 2005-09-13.
SOUTHERN CALIFORNIA MATERIAL H (8314 E SLAUSON AVE) : $51,294 in 6 contractsfrom 2003 to 2005
Contracts for Lease or Rental of Equipment -- Materials Handling Equipment, Maintenance, Repair and Rebuilding of Equipment -- Materials Handling Equipment, by Navy, American Forces Information Service, Bureau of Prisoners/Federal Prison System Signed by year:2000: $0; 2001: $0; 2002: $0; 2003: $29,280; 2004: $7,120; 2005: $14,894; 2006: $0.
Biggest contracts:
$29,280 with Navy for Lease or Rental of Equipment -- Materials Handling Equipment. Signed on 2003-10-23. Completion date: 2004-09-30.
$22,224 with Navy for Maintenance, Repair and Rebuilding of Equipment -- Materials Handling Equipment. Signed on 2005-09-27. Completion date: 2006-09-30.
$7,120 with American Forces Information Service for Maintenance, Repair and Rebuilding of Equipment -- Materials Handling Equipment. Signed on 2004-12-07. Completion date: 2005-11-30.
$4,500 with Bureau of Prisoners/Federal Prison System for . Signed on 2005-07-27. Completion date: 2005-08-08.
FEIT ELECTRIC CO INC (4901 GREGG RD; small business) : $47,980 in 5 contractsfrom 2002 to 2005
Contracts for Electric Lamps by Defense Logistics Agency Signed by year:2000: $0; 2001: $0; 2002: $30,347; 2003: $0; 2004: $7,020; 2005: $10,613; 2006: $0.
Biggest contracts:
$30,347 with Defense Logistics Agency for Electric Lamps. Signed on 2002-02-21. Completion date: 2002-03-02.
$7,980, same as above.Signed on 2005-03-15. Completion date: 2005-03-23.
$4,298, same as above.Signed on 2004-11-12. Completion date: 2004-11-22.
$2,722, same as above.Signed on 2004-10-26. Completion date: 2004-12-25.
Top industries in this zip code by the number of employees in 2005:
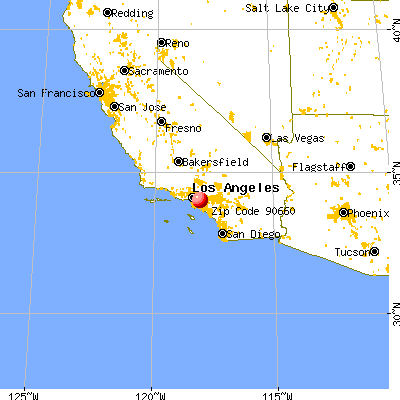


 Nearest zip codes: 90606, 90640, 90240, 90040, 90601, 90670.