Estimated zip code population in 2022: 27,288 Zip code population in 2010: 25,457 Zip code population in 2000: 24,640
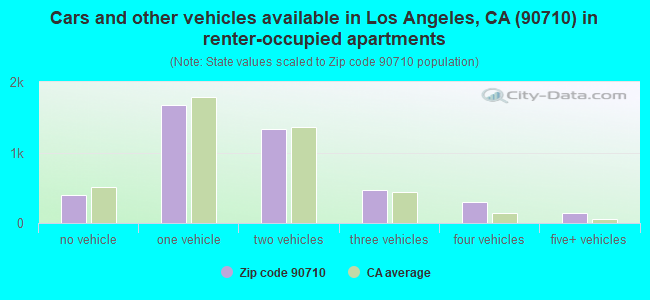
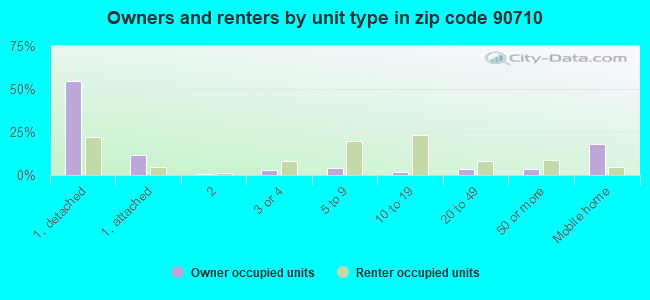
Houses and condos: 9,874 Renter-occupied apartments: 4,309
% of renters here:
46%
State:
44%
March 2022 cost of living index in zip code 90710: 133.7 (high, U.S. average is 100)
Land area: 2.4 sq. mi. Water area: 0.0 sq. mi.
Population density: 11,573 people per square mile
(high).
OSM Map
General Map
Google Map
MSN Map
OSM Map
General Map
Google Map
MSN Map
OSM Map
General Map
Google Map
MSN Map
OSM Map
General Map
Google Map
MSN Map
Please wait while loading the map...
Real estate property taxes paid for housing units in 2022:
This zip code:
0.7% ($4,796)
California:
0.7% ($4,831)
Median real estate property taxes paid for housing units with mortgages in 2022: $5,695 (0.8%) Median real estate property taxes paid for housing units with no mortgage in 2022: $2,655 (0.6%)
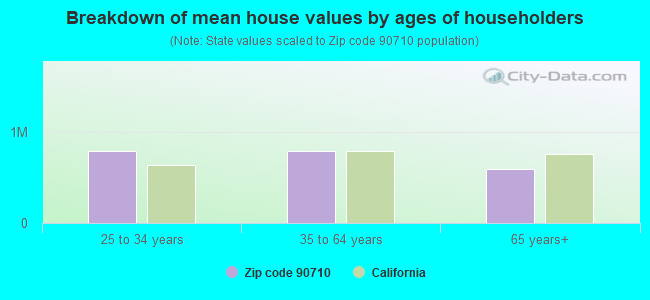
Estimated median house/condo value in 2022: $658,459
90710:
$658,459
California:
$715,900
According to our research of California and other state lists, there were 39 registered sex offenders living in 90710 zip code as of May 28, 2024. The ratio of all residents to sex offenders in zip code 90710 is 726 to 1. The ratio of registered sex offenders to all residents in this zip code is near the state average.
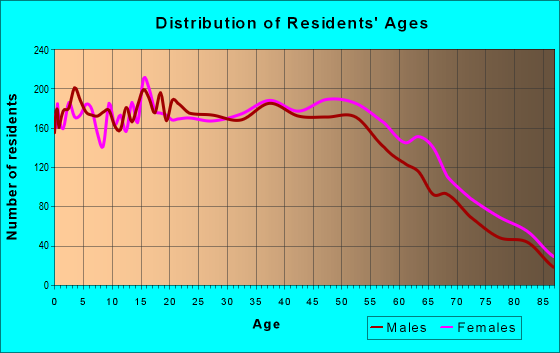
Median resident age:
This zip code:
40.2 years
California median age:
37.9 years
Average household size:
This zip code:
2.9 people
California:
2.8 people
Averages for the 2020 tax year for zip code 90710, filed in 2021:
Average Adjusted Gross Income (AGI) in 2020: $59,428 (Individual Income Tax Returns)
Here:
$59,428
State:
$95,910
Salary/wage: $55,291 (reported on 79.4% of returns)
Here:
$55,291
State:
$77,331
(% of AGI for various income ranges: 1167.4% for AGIs below $25k, 3992.1% for AGIs $25k-50k, 7271.8% for AGIs $50k-75k, 10614.9% for AGIs $75k-100k, 20233.9% for AGIs $100k-200k, 72319.2% for AGIs over 200k)
Taxable interest for individuals: $1,066 (reported on 29.9% of returns)
This zip code:
$1,066
California:
$2,294
(% of AGI for various income ranges: 14.6% for AGIs below $25k, 17.0% for AGIs $25k-50k, 32.8% for AGIs $50k-75k, 55.1% for AGIs $75k-100k, 124.7% for AGIs $100k-200k, 1127.5% for AGIs over 200k)
Ordinary dividends: $2,858 (reported on 13.2% of returns)
Here:
$2,858
State:
$10,949
(% of AGI for various income ranges: 12.8% for AGIs below $25k, 17.1% for AGIs $25k-50k, 43.4% for AGIs $50k-75k, 64.9% for AGIs $75k-100k, 176.0% for AGIs $100k-200k, 1234.2% for AGIs over 200k)
Net capital gain/loss in AGI: +$9,699 (reported on 13.5% of returns)
Here:
+$9,699
State:
+$49,306
(% of AGI for various income ranges: 7.3% for AGIs below $25k, 10.6% for AGIs $25k-50k, 64.5% for AGIs $50k-75k, 148.5% for AGIs $75k-100k, 438.7% for AGIs $100k-200k, 8682.5% for AGIs over 200k)
Profit/loss from business: +$8,263 (reported on 19.6% of returns)
Here:
+$8,263
State:
+$15,671
(% of AGI for various income ranges: 205.1% for AGIs below $25k, 170.6% for AGIs $25k-50k, 200.2% for AGIs $50k-75k, 278.1% for AGIs $75k-100k, 295.1% for AGIs $100k-200k, 3321.7% for AGIs over 200k)
Taxable individual retirement arrangement distribution: $19,507 (reported on 5.8% of returns)
90710:
$19,507
California:
$23,505
(% of AGI for various income ranges: 41.8% for AGIs below $25k, 56.2% for AGIs $25k-50k, 194.5% for AGIs $50k-75k, 323.4% for AGIs $75k-100k, 580.5% for AGIs $100k-200k, 1789.2% for AGIs over 200k)
Total itemized deductions: $30,049 (reported on 15.6% of returns)
Here:
$30,049
State:
$39,517
(% of AGI for various income ranges: 63.9% for AGIs below $25k, 198.1% for AGIs $25k-50k, 589.2% for AGIs $50k-75k, 1414.7% for AGIs $75k-100k, 2830.2% for AGIs $100k-200k, 8585.0% for AGIs over 200k)
Charity contributions: $6,101 (reported on 13.1% of returns)
Here:
$6,101
State:
$12,598
(% of AGI for various income ranges: 4.5% for AGIs below $25k, 24.9% for AGIs $25k-50k, 82.1% for AGIs $50k-75k, 225.0% for AGIs $75k-100k, 496.2% for AGIs $100k-200k, 1960.8% for AGIs over 200k)
Taxes paid: $8,640 (reported on 15.6% of returns)
90710:
$8,640
State:
$8,807
(% of AGI for various income ranges: 16.3% for AGIs below $25k, 47.8% for AGIs $25k-50k, 159.1% for AGIs $50k-75k, 440.4% for AGIs $75k-100k, 860.2% for AGIs $100k-200k, 2247.5% for AGIs over 200k)
Earned income credit: $2,167 (reported on 16.4% of returns)
Here:
$2,167
State:
$2,074
(% of AGI for various income ranges: 103.2% for AGIs below $25k, 70.8% for AGIs $25k-50k, 0.9% for AGIs $50k-75k)
Percentage of individuals using paid preparers for their 2020 taxes: 91.7%
Here:
92%
State:
92%
(% for various income ranges: 90.5% for AGIs below $25k, 91.7% for AGIs $25k-50k, 92.4% for AGIs $50k-75k, 91.9% for AGIs $75k-100k, 93.3% for AGIs $100k-200k, 93.2% for AGIs over 200k)
Averages for the 2012 tax year for zip code 90710, filed in 2013:
Average Adjusted Gross Income (AGI) in 2012: $49,028 (Individual Income Tax Returns)
Here:
$49,028
State:
$72,726
Salary/wage: $46,852 (reported on 81.1% of returns)
Here:
$46,852
State:
$59,079
(% of AGI for various income ranges: 71.7% for AGIs below $25k, 81.8% for AGIs $25k-50k, 78.8% for AGIs $50k-75k, 78.6% for AGIs $75k-100k, 80.3% for AGIs $100k-200k, 61.1% for AGIs over 200k)
Taxable interest for individuals: $688 (reported on 32.2% of returns)
This zip code:
$688
California:
$2,146
(% of AGI for various income ranges: 0.7% for AGIs below $25k, 0.4% for AGIs $25k-50k, 0.5% for AGIs $50k-75k, 0.3% for AGIs $75k-100k, 0.4% for AGIs $100k-200k, 0.7% for AGIs over 200k)
Ordinary dividends: $2,315 (reported on 12.6% of returns)
Here:
$2,315
State:
$9,308
(% of AGI for various income ranges: 0.7% for AGIs below $25k, 0.5% for AGIs $25k-50k, 0.6% for AGIs $50k-75k, 0.5% for AGIs $75k-100k, 0.7% for AGIs $100k-200k, 0.5% for AGIs over 200k)
Net capital gain/loss in AGI: +$1,409 (reported on 8.9% of returns)
Here:
+$1,409
State:
+$30,460
(% of AGI for various income ranges: 0.5% for AGIs $100k-200k, 2.2% for AGIs over 200k)
Profit/loss from business: +$9,685 (reported on 18.4% of returns)
Here:
+$9,685
State:
+$17,064
(% of AGI for various income ranges: 14.0% for AGIs below $25k, 4.4% for AGIs $25k-50k, 2.6% for AGIs $50k-75k, 1.9% for AGIs $75k-100k, 1.2% for AGIs $100k-200k, 2.5% for AGIs over 200k)
Taxable individual retirement arrangement distribution: $15,494 (reported on 7.4% of returns)
90710:
$15,494
California:
$19,557
(% of AGI for various income ranges: 2.1% for AGIs below $25k, 1.8% for AGIs $25k-50k, 2.5% for AGIs $50k-75k, 3.1% for AGIs $75k-100k, 2.9% for AGIs $100k-200k)
Self-employment retirement plans: $10,850 (reported on 0.2% of returns)
90710:
$10,850
California:
$24,530
Total itemized deductions: $24,922 (28% of AGI, reported on 34.5% of returns)
Here:
$24,922
State:
$34,004
Here:
27.9% of AGI
State:
22.7% of AGI
(% of AGI for various income ranges: 8.2% for AGIs below $25k, 12.4% for AGIs $25k-50k, 19.2% for AGIs $50k-75k, 20.9% for AGIs $75k-100k, 21.8% for AGIs $100k-200k, 16.3% for AGIs over 200k)
Charity contributions: $3,443 (reported on 29.2% of returns)
Here:
$3,443
State:
$4,659
(% of AGI for various income ranges: 0.6% for AGIs below $25k, 1.4% for AGIs $25k-50k, 2.2% for AGIs $50k-75k, 2.6% for AGIs $75k-100k, 2.5% for AGIs $100k-200k, 2.3% for AGIs over 200k)
Taxes paid: $8,028 (reported on 34.5% of returns)
90710:
$8,028
State:
$14,448
(% of AGI for various income ranges: 1.6% for AGIs below $25k, 2.7% for AGIs $25k-50k, 5.2% for AGIs $50k-75k, 6.5% for AGIs $75k-100k, 7.9% for AGIs $100k-200k, 8.1% for AGIs over 200k)
Earned income credit: $2,479 (reported on 20.7% of returns)
Here:
$2,479
State:
$2,286
(% of AGI for various income ranges: 7.4% for AGIs below $25k, 1.2% for AGIs $25k-50k)
Percentage of individuals using paid preparers for their 2012 taxes: 70.5%
Here:
70%
State:
64%
(% for various income ranges: 69.7% for AGIs below $25k, 71.0% for AGIs $25k-50k, 70.9% for AGIs $50k-75k, 71.7% for AGIs $75k-100k, 70.8% for AGIs $100k-200k, 73.3% for AGIs over 200k)
Averages for the 2004 tax year for zip code 90710, filed in 2005:
Average Adjusted Gross Income (AGI) in 2004: $42,641 (Individual Income Tax Returns)
Here:
$42,641
State:
$58,600
Salary/wage: $41,342 (reported on 83.5% of returns)
Here:
$41,342
State:
$49,455
(% of AGI for various income ranges: 125.1% for AGIs below $10k, 78.1% for AGIs $10k-25k, 83.8% for AGIs $25k-50k, 83.3% for AGIs $50k-75k, 80.5% for AGIs $75k-100k, 76.7% for AGIs over 100k)
Taxable interest for individuals: $1,055 (reported on 42.5% of returns)
This zip code:
$1,055
California:
$2,365
(% of AGI for various income ranges: 5.0% for AGIs below $10k, 1.4% for AGIs $10k-25k, 0.9% for AGIs $25k-50k, 0.9% for AGIs $50k-75k, 0.8% for AGIs $75k-100k, 1.1% for AGIs over 100k)
Taxable dividends: $1,726 (reported on 16.5% of returns)
Here:
$1,726
State:
$4,746
(% of AGI for various income ranges: 2.4% for AGIs below $10k, 0.8% for AGIs $10k-25k, 0.6% for AGIs $25k-50k, 0.5% for AGIs $50k-75k, 0.7% for AGIs $75k-100k, 0.7% for AGIs over 100k)
Net capital gain/loss: +$8,527 (reported on 13.8% of returns)
Here:
+$8,527
State:
+$23,418
(% of AGI for various income ranges: -2.3% for AGIs below $10k, 0.1% for AGIs $10k-25k, -0.0% for AGIs $25k-50k, 0.4% for AGIs $50k-75k, 0.8% for AGIs $75k-100k, 8.5% for AGIs over 100k)
Profit/loss from business: +$8,706 (reported on 16.1% of returns)
Here:
+$8,706
State:
+$16,826
(% of AGI for various income ranges: 20.4% for AGIs below $10k, 8.5% for AGIs $10k-25k, 3.1% for AGIs $25k-50k, 2.4% for AGIs $50k-75k, 3.3% for AGIs $75k-100k, 1.3% for AGIs over 100k)
IRA payment deduction: $3,020 (reported on 2.4% of returns)
90710:
$3,020
California:
$3,192
(% of AGI for various income ranges: 0.2% for AGIs $10k-25k, 0.2% for AGIs $25k-50k, 0.2% for AGIs $50k-75k, 0.2% for AGIs $75k-100k, 0.1% for AGIs over 100k)
Self-employed pension: $8,559 (reported on 0.3% of returns)
Here:
$8,559
California:
$17,688
Total itemized deductions: $22,184 (30% of AGI, reported on 38.0% of returns)
Here:
$22,184
State:
$28,113
Here:
30.4% of AGI
State:
25.3% of AGI
(% of AGI for various income ranges: 18.8% for AGIs below $10k, 10.3% for AGIs $10k-25k, 16.5% for AGIs $25k-50k, 23.4% for AGIs $50k-75k, 23.8% for AGIs $75k-100k, 21.1% for AGIs over 100k)
Charity contributions deductions: $3,268 (4% of AGI, reported on 34.3% of returns)
Here:
$3,268
State:
$3,923
Here:
4.3% of AGI
State:
3.3% of AGI
(% of AGI for various income ranges: 0.9% for AGIs below $10k, 1.0% for AGIs $10k-25k, 2.1% for AGIs $25k-50k, 3.2% for AGIs $50k-75k, 3.2% for AGIs $75k-100k, 2.9% for AGIs over 100k)
Total tax: $5,523 (reported on 72.3% of returns)
90710:
$5,523
State:
$10,761
(% of AGI for various income ranges: 5.7% for AGIs below $10k, 3.8% for AGIs $10k-25k, 6.0% for AGIs $25k-50k, 8.5% for AGIs $50k-75k, 10.1% for AGIs $75k-100k, 14.1% for AGIs over 100k)
Earned income credit: $1,774 (reported on 18.6% of returns)
Here:
$1,774
State:
$1,763
Percentage of individuals using paid preparers for their 2004 taxes: 72.1%
Here:
72%
State:
66%
(% for various income ranges: 65.7% for AGIs below $10k, 74.7% for AGIs $10k-25k, 72.5% for AGIs $25k-50k, 73.6% for AGIs $50k-75k, 72.6% for AGIs $75k-100k, 72.2% for AGIs over 100k)
Likely homosexual households (counted as self-reported same-sex unmarried-partner households)
Lesbian couples: 0.1% of all households
Gay men: 0.2% of all households
Household received Food Stamps/SNAP in the past 12 months: 1,171 Household did not receive Food Stamps/SNAP in the past 12 months: 8,261
Women who had a birth in the past 12 months: 139 (134 now married, 4 unmarried) Women who did not have a birth in the past 12 months: 6,197 (2,198 now married, 4,009 unmarried)
Housing units in zip code 90710 with a mortgage: 3,083 (152 second mortgage, 13 home equity loan, 113 both second mortgage and home equity loan) Median monthly owner costs for units with a mortgage: $2,641 Median monthly owner costs for units without a mortgage: $817
Residents with income below the poverty level in 2022:
This zip code:
12.9%
Whole state:
12.2%
Residents with income below 50% of the poverty level in 2022:
This zip code:
7.5%
Whole state:
6.2%
Median number of rooms in houses and condos:
Here:
5.3
State:
6.0
Median number of rooms in apartments:
Here:
3.9
State:
3.9
Notable locations in this zip code not listed on our city pages
Notable locations in zip code 90710: Americare Ambulance Service Station 1 Headquarters (A), City of Los Angeles Fire Department Station 85 (B). Display/hide their locations on the map
3,081 married couples with children.
1,963 single-parent households (330 men, 1,633 women).
44.0% of residents of 90710 zip code speak English at home.
36.8% of residents speak Spanish at home (60% very well, 19% well, 15% not well, 6% not at all).
2.9% of residents speak other Indo-European language at home (78% very well, 13% well, 7% not well, 3% not at all).
14.9% of residents speak Asian or Pacific Island language at home (50% very well, 31% well, 16% not well, 3% not at all).
1.9% of residents speak other language at home (85% very well, 10% well, 5% not well).
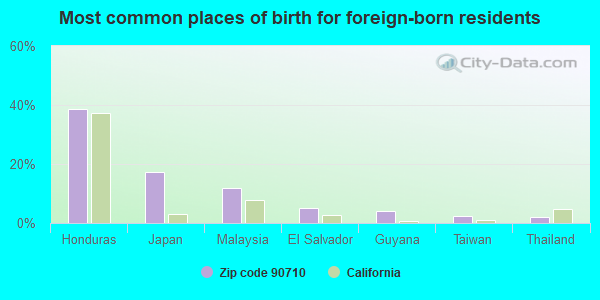
Foreign born population: 9,228 (33.8%) (61.9% of them are naturalized citizens)
This zip code:
33.8%
Whole state:
26.7%
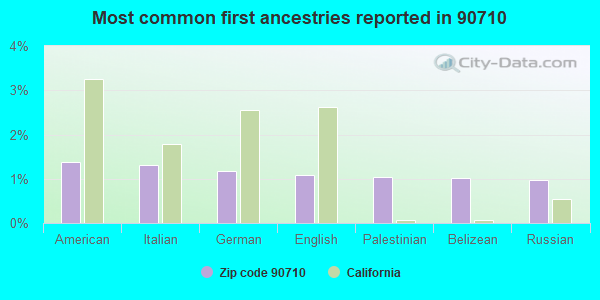
39%Honduras
17%Japan
12%Malaysia
5%El Salvador
4%Guyana
2%Taiwan
2%Thailand
1%American
1%Italian
1%German
1%English
1%Palestinian
1%Belizean
1%Russian
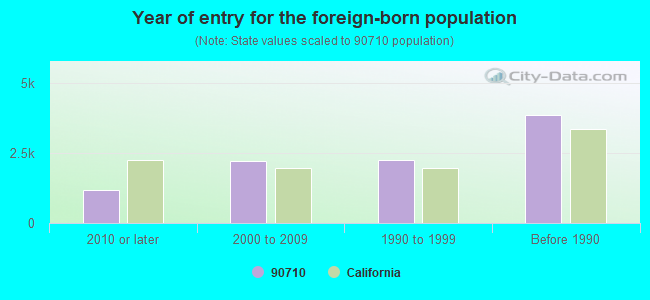
Year of entry for the foreign-born population
1,1882010 or later
2,2022000 to 2009
2,2581990 to 1999
3,852Before 1990
Major facilities with environmental interests located in this zip code:
C BRITE METAL FINISHING INCORPORATED (1213 W 253RD ST in HARBOR CITY, CA)
STATE MASTER (California - Hazardous Waste Tracking) - HAZARDOU WASTE PROGRAM CRITERIA AND HAZARDOUS AIR POLLUTANT INVENTORY (Inventory of air pollution sources) Small Quantity Generators, between 100 kg and 1000 kg of hazardous waste/month (Resource Conservation and Recovery Act (tracking hazardous waste)) TSD (Resource Conservation and Recovery Act (tracking hazardous waste)) Business SIC and NAICS classification: ELECTROPLATING, PLATING, POLISHING, ANODIZING, AND COLORING Organizations: C-BRITE METAL FINISHING INC (CONTACT/OPERATOR)
LIONS AUTO BODY (1634 W ANAHEIM ST in HARBOR CITY, CA)
STATE MASTER (California - Hazardous Waste Tracking) - HAZARDOU WASTE PROGRAM Small Quantity Generators, between 100 kg and 1000 kg of hazardous waste/month (Resource Conservation and Recovery Act (tracking hazardous waste)) - notification Business NAICS classification: AUTOMOTIVE BODY, PAINT, AND INTERIOR REPAIR AND MAINTENANCE. Organizations: DOUGLAS M & CUMMINS R (CONTACT/OWNER)
LA USD NARBONNE HIGH SCHOOL (24300 S WESTERN AVE in HARBOR CITY, CA)
STATE MASTER (California - Hazardous Waste Tracking) - HAZARDOU WASTE PROGRAM Small Quantity Generators, between 100 kg and 1000 kg of hazardous waste/month (Resource Conservation and Recovery Act (tracking hazardous waste)) - notification Alternative names: LAUSD/ NARBONNE HS, NARBONNE (NATHANIEL) SENIOR HI
CHEVRON STATION NO 91267 (25800 WESTERN AVE in HARBOR CITY, CA)
STATE MASTER (California - Hazardous Waste Tracking) - HAZARDOU WASTE PROGRAM Small Quantity Generators, between 100 kg and 1000 kg of hazardous waste/month (Resource Conservation and Recovery Act (tracking hazardous waste)) - notification Organizations: CHEVRON PRODUCTS CO (CONTACT/OWNER)
Alternative names: SAM MORSE CHEVRON
CHEVRON STATION NO 95697 (1250 W SEPULVEDA BLVD in HARBOR CITY, CA)
STATE MASTER (California - Hazardous Waste Tracking) - HAZARDOU WASTE PROGRAM Small Quantity Generators, between 100 kg and 1000 kg of hazardous waste/month (Resource Conservation and Recovery Act (tracking hazardous waste)) - notification Organizations: CHEVRON PRODUCTS CO (CONTACT/OWNER)
HARBOR CITY ELEMENTARY (1508 W. 254TH ST. in HARBOR CITY, CA)
(National Center for Education Statistics) - STATE ID-6017461 Organizations: LOS ANGELES UNIFIED (SCHOOL DISTRICT)
MAXIMA ENTERPRISES INC (23920 S VERMONT AVE in HARBOR CITY, CA)
Large Quantity Generators, more that 1000 kg of hazardous waste/month (Resource Conservation and Recovery Act (tracking hazardous waste)) Business NAICS classification: MACHINE TOOL (METAL FORMING TYPES) MANUFACTURING.; ALL OTHER MOTOR VEHICLE PARTS MANUFACTURING. Organizations: 23920 VERMONT LP (CONTACT/OWNER)
Alternative names: APPLIANCE IND DIV W R GRACE
MOBIL OIL CORP S TORRANCE UNIT (630 LOMITA BLVD in HARBOR CITY, CA)
(Resource Conservation and Recovery Act (tracking hazardous waste))
MOTORSPORT TECHOLOGY (25518 FRAMPTON AVENUE in HARBOR CITY, CA)
(Resource Conservation and Recovery Act (tracking hazardous waste)) Organizations: VELLOZZI MARTIN (CONTACT/OWNER)
KAISER PERMANENTE MEDICAL CENTER (25825 SOUTH VERMONT AVENUE in HARBOR CITY, CA)
COMPLIANCE ACTIVITY (Tracking inspections of insecticide, fungicide, and rodenticide, and toxic substances) (Resource Conservation and Recovery Act (tracking hazardous waste)) Business SIC classification: GENERAL MEDICAL AND SURGICAL HOSPITALS Alternative names: KAISER FOUND HLTH
F M F RACING INC (25927 FRAMPTON AVE in HARBOR CITY, CA)
(Resource Conservation and Recovery Act (tracking hazardous waste))
MOBIL OIL COROP (JOUGHIN UNIT) (23903 SOUTH NORMANDIE AVENUE in HARBOR CITY, CA)
CRITERIA AND HAZARDOUS AIR POLLUTANT INVENTORY (Inventory of air pollution sources) (Resource Conservation and Recovery Act (tracking hazardous waste)) Business SIC and NAICS classification: CRUDE PETROLEUM AND NATURAL GAS Alternative names: MOBIL EXPLORATION & PRODUCING
LA CITY HOUSING AUTHORITY (990 W 256 ST in HARBOR CITY, CA)
Small Quantity Generators, between 100 kg and 1000 kg of hazardous waste/month (Resource Conservation and Recovery Act (tracking hazardous waste)) - notification Organizations: LA HOUSING AUTHORITY (CONTACT/OWNER)
Housing units lacking complete plumbing facilities: 0.1% Housing units lacking complete kitchen facilities: 2.3%
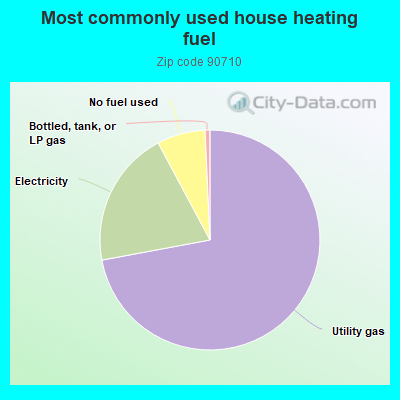
72.0%Utility gas
20.1%Electricity
7.1%No fuel used
0.7%Bottled, tank, or LP gas
Population in 1990: 24,418. Population change in the 1990s: +222 (+0.9%).
Place of birth for U.S.-born residents:
This state: 14,931
Northeast: 432
Midwest: 986
South: 989
West: 301
54% of the 90710 zip code residents lived in the same house 5 years ago. Out of people who lived in different houses, 88% lived in this county. Out of people who lived in different counties, 50% lived in California.
94% of the 90710 zip code residents lived in the same house 1 year ago. Out of people who lived in different houses, 81% moved from this county. Out of people who lived in different houses, 6% moved from different county within same state. Out of people who lived in different houses, 6% moved from different state. Out of people who lived in different houses, 8% moved from abroad.
Private vs. public school enrollment:
Students in private schools in grades 1 to 8 (elementary and middle school): 650
Here:
24.7%
California:
10.5%
Students in private schools in grades 9 to 12 (high school): 282
Here:
19.2%
California:
8.5%
Students in private undergraduate colleges: 268
Here:
14.9%
California:
15.9%
Occupation by median earnings in the past 12 months ($)
159,768Law enforcement workers including supervisors
118,770Legal occupations
93,182Computer and mathematical occupations
79,030Management occupations
78,160Architecture and engineering occupations
75,064Life, physical, and social science occupations
Companies with federal contracts located in this zip code (HARBOR CITY, CA):
ROCKER SOLENOID COMPANY (1500 WEST 240TH STREET; small business) : $7,573,316 in 54 contractsfrom 2000 to 2006
Contracts for Relays and Solenoids, Guns, through 30 mm, Valves, Powered, Engine Fuel System Components, Aircraft and Missile Prime Movers, and moreby Army, Air Force, Defense Logistics Agency, Navy, and others Signed by year:2000: $491,866; 2001: $179,521; 2002: $1,198,700; 2003: $1,162,323; 2004: $1,433,888; 2005: $2,929,851; 2006: $177,167.
Biggest contracts:
$1,330,662 with Army for Relays and Solenoids. Signed on 2005-08-19. Completion date: 2006-07-10.
$670,640, same as above.Signed on 2005-11-23. Completion date: 2006-06-24.
$555,280, same as above.Signed on 2002-12-18. Completion date: 2003-06-30.
$555,280, same as above.Signed on 2003-09-04. Completion date: 2004-02-28.
AMERICAN BRISTOL INDUSTRIES IN (1600 W 240TH STREET; small business) : $2,256,905 in 5 contractsfrom 2000 to 2002
Contracts for Compressors and Vacuum Pumps, Miscellaneous Special Industry Machinery by Air Force, Navy Signed by year:2000: $1,678,415; 2001: $210,360; 2002: $368,130; 2003: $0; 2004: $0; 2005: $0; 2006: $0.
Biggest contracts:
$1,638,945 with Air Force for Compressors and Vacuum Pumps. Signed on 2000-08-31. Completion date: 2001-03-30.
$210,360, same as above.Signed on 2002-03-01. Completion date: 2002-05-30.
$210,360, same as above.Signed on 2001-01-30. Completion date: 2001-12-30.
$157,770, same as above.Signed on 2002-01-31. Completion date: 2002-05-31.
BASMAT INC (1531 W 240TH ST; small business) : $122,397 in 2 contractsfrom 2004 to 2005
$88,222 with Defense Logistics Agency for Airframe Structural Components. Signed on 2004-06-25. Completion date: 2004-09-17.
$34,175, same as above.Signed on 2005-04-21. Completion date: 2005-09-08.
FRUDAKIS CONSTRUCTION (24208 AMBASSADOR PL; small business) : $87,903 in 5 contractsfrom 2004 to 2006
Contracts for Construction of Structures and Facilities -- Restoration of real property, Maintenance, Repair or Alteration of Real Property -- Other Administrative Facilities and Service Buildings by Army Signed by year:2000: $0; 2001: $0; 2002: $0; 2003: $0; 2004: $43,737; 2005: $44,166; 2006: $0.
Biggest contracts:
$41,055 with Army for Construction of Structures and Facilities -- Restoration of real property. Signed on 2005-04-04. Completion date: 2005-06-20.
$23,809 with Army for Maintenance, Repair or Alteration of Real Property -- Other Administrative Facilities and Service Buildings. Signed on 2004-07-19. Completion date: 2004-09-01.
$19,928, same as above.Signed on 2004-09-26. Completion date: 2004-11-10.
$3,111, same as above.Signed on 2005-09-30. Completion date: 2004-09-01.
INTEGRAL PRODUCTS, INC (24030 FRAMPTON AVE; small business) : $40,728 in 3 contractsfrom 2001 to 2005
$32,646 with Air Force for Adhesives. Signed on 2001-08-14. Completion date: 2001-08-14.
$7,273 with Department of Defense for Miscellaneous Weapons. Signed on 2005-04-14. Completion date: 2005-05-19.
$809 with Federal Supply Service for Adhesives. Signed on 2005-03-18. Completion date: 2005-04-10.
DNH INDUSTRIES INC (24100 FRAMPTON AVE; small business)
$40,543 with Navy for Electrical Control Equipment. Signed on 2004-03-29. Completion date: 2004-06-15.
CAL PARTITIONS INC (23814 PRESIDENT AVE; small business)
$34,082 with Air Force for Modification of Equipment -- Weapons. Signed on 2003-07-08. Completion date: 2003-08-30.
NEMAD MANUFACTURING COMPANY (25103 S VERMONT AVE; small business) 50 employees, $0 revenue. Small Disadvantaged Business, Woman Owned Business
$22,723 with Navy for Cartridge and Propellant Actuated Devices and Components. Signed on 2006-03-24. Completion date: 2006-07-30.
Top industries in this zip code by the number of employees in 2005:
Health Care and Social Assistance: Offices of Physicians (except Mental Health Specialists) (over 1000 employees: 1 establishment, 10-19 employees: 1 establishment, 5-9 employees: 2 establishments, 1-4 employees: 7 establishments)
Health Care and Social Assistance: General Medical and Surgical Hospitals (500-999: 1)
Administrative and Support and Waste Management and Remediation Services: Landscaping Services (100-249: 1, 20-49: 1, 5-9: 1)
2005 - 2018 National Fire Incident Reporting System (NFIRS) incidents
According to the data from the years 2005 - 2018 the average number of fire incidents per year is 58. The highest number of fires - 88 took place in 2007, and the least - 34 in 2012. The data has a growing trend.
When looking into fire subcategories, the most reports belonged to: Structure Fires (38.6%), and Outside Fires (36.7%).
Fire incident types reported to NFIRS in Zip Code 90710


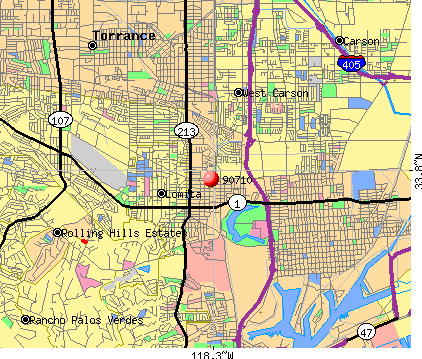 Nearest zip codes: 90717, 90502, 90501, 90745, 90744, 90505.
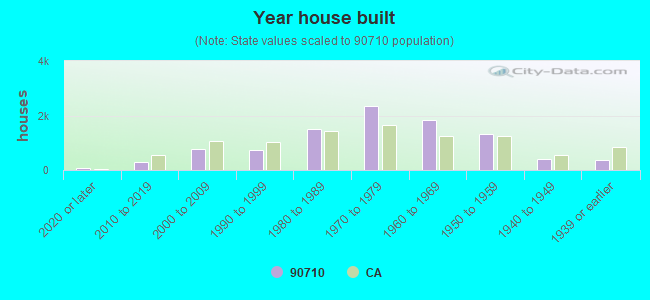


 According to the data from the years 2005 - 2018 the average number of fire incidents per year is 58. The highest number of fires - 88 took place in 2007, and the least - 34 in 2012. The data has a growing trend.
 When looking into fire subcategories, the most reports belonged to: Structure Fires (38.6%), and Outside Fires (36.7%).