Estimated zip code population in 2022: 430 Zip code population in 2010: 456 Zip code population in 2000: 170
Houses and condos: 364 Renter-occupied apartments: 60
% of renters here:
32%
State:
44%
March 2022 cost of living index in zip code 90743: 90.8 (less than average, U.S. average is 100)
Land area: 0.1 sq. mi. Water area: 0.4 sq. mi.
Population density: 5,194 people per square mile
(average).
OSM Map
General Map
Google Map
MSN Map
OSM Map
General Map
Google Map
MSN Map
OSM Map
General Map
Google Map
MSN Map
OSM Map
General Map
Google Map
MSN Map
Please wait while loading the map...
Real estate property taxes paid for housing units in 2022:
This zip code:
0.4% ($9,081)
California:
0.7% ($4,831)
Median real estate property taxes paid for housing units with mortgages in 2022: $9,532 (0.4%) Median real estate property taxes paid for housing units with no mortgage in 2022: $7,487 (0.3%)
Business Search- 14 Million verified businesses
Males: 234
(54.6%)
Females: 195
(45.4%)
For population 25 years and over in 90743:
High school or higher: 99.1%
Bachelor's degree or higher: 72.0%
Graduate or professional degree: 34.6%
Mean travel time to work (commute): 21.0 minutes
For population 15 years and over in 90743:
Never married: 24.6%
Now married: 55.0%
Separated: 0.0%
Widowed: 13.5%
Divorced: 7.0%
Zip code 90743 compared to state average:
Median household income above state average.
Median house value significantly above state average.
Unemployed percentage significantly below state average.
Black race population percentage significantly below state average.
Hispanic race population percentage significantly below state average.
Median age significantly above state average.
Foreign-born population percentage significantly below state average.
Length of stay since moving in significantly above state average.
Percentage of population with a bachelor's degree or higher above state average.
Estimated median house/condo value in 2022: $2,171,698
90743:
$2,171,698
California:
$715,900
Median resident age:
This zip code:
56.7 years
California median age:
37.9 years
Average household size:
This zip code:
2.3 people
California:
2.8 people
Averages for the 2004 tax year for zip code 90743, filed in 2005:
Average Adjusted Gross Income (AGI) in 2004: $185,888 (Individual Income Tax Returns)
Here:
$185,888
State:
$58,600
Salary/wage: $115,888 (reported on 75.2% of returns)
Here:
$115,888
State:
$49,455
(% of AGI for various income ranges: 57.4% for AGIs $10k-25k, 75.1% for AGIs $25k-50k, 58.8% for AGIs $50k-75k, 68.9% for AGIs $75k-100k, 43.7% for AGIs over 100k)
Taxable interest for individuals: $8,538 (reported on 66.8% of returns)
This zip code:
$8,538
California:
$2,365
(% of AGI for various income ranges: 5.6% for AGIs $10k-25k, 2.6% for AGIs $25k-50k, 1.1% for AGIs $50k-75k, 0.4% for AGIs $75k-100k, 3.3% for AGIs over 100k)
Taxable dividends: $22,533 (reported on 43.0% of returns)
Here:
$22,533
State:
$4,746
(% of AGI for various income ranges: 4.3% for AGIs $25k-50k, 0.2% for AGIs $75k-100k, 5.8% for AGIs over 100k)
Net capital gain/loss: +$45,469 (reported on 37.9% of returns)
Here:
+$45,469
State:
+$23,418
(% of AGI for various income ranges: -0.4% for AGIs $25k-50k, -0.8% for AGIs $75k-100k, 10.8% for AGIs over 100k)
Profit/loss from business: +$38,746 (reported on 27.6% of returns)
Here:
+$38,746
State:
+$16,826
Total itemized deductions: $57,301 (20% of AGI, reported on 62.1% of returns)
Here:
$57,301
State:
$28,113
Here:
20.2% of AGI
State:
25.3% of AGI
(% of AGI for various income ranges: 33.5% for AGIs $25k-50k, 22.0% for AGIs $50k-75k, 33.3% for AGIs $75k-100k, 17.9% for AGIs over 100k)
Charity contributions deductions: $6,810 (3% of AGI, reported on 58.9% of returns)
Here:
$6,810
State:
$3,923
Here:
2.7% of AGI
State:
3.3% of AGI
(% of AGI for various income ranges: 3.3% for AGIs $25k-50k, 2.0% for AGIs $50k-75k, 2.3% for AGIs $75k-100k, 2.1% for AGIs over 100k)
Total tax: $41,925 (reported on 87.4% of returns)
90743:
$41,925
State:
$10,761
(% of AGI for various income ranges: 6.0% for AGIs $10k-25k, 8.5% for AGIs $25k-50k, 10.8% for AGIs $50k-75k, 11.0% for AGIs $75k-100k, 21.2% for AGIs over 100k)
Earned income credit: $1,400 (reported on 4.7% of returns)
Here:
$1,400
State:
$1,763
Percentage of individuals using paid preparers for their 2004 taxes: 79.4%
Here:
79%
State:
66%
(% for various income ranges: 60.0% for AGIs below $10k, 67.7% for AGIs $10k-25k, 81.2% for AGIs $25k-50k, 70.8% for AGIs $50k-75k, 84.6% for AGIs $75k-100k, 90.8% for AGIs over 100k)
Household received Food Stamps/SNAP in the past 12 months: 0 Household did not receive Food Stamps/SNAP in the past 12 months: 186
Women who did not have a birth in the past 12 months: 37 (9 now married, 28 unmarried)
Housing units in zip code 90743 with a mortgage: 47 Median monthly owner costs for units with a mortgage: $2,685 Median monthly owner costs for units without a mortgage: $1,535
Residents with income below the poverty level in 2022:
This zip code:
5.3%
Whole state:
12.2%
Residents with income below 50% of the poverty level in 2022:
This zip code:
2.7%
Whole state:
6.2%
Median number of rooms in houses and condos:
Here:
6.5
State:
6.0
Median number of rooms in apartments:
Here:
5.5
State:
3.9
Notable locations in this zip code not listed on our city pages
Size of family households: 68 2-persons, 15 3-persons, 22 4-persons, 12 5-persons
Size of nonfamily households: 55 1-person, 17 2-persons
50 married couples with children.
0 single-parent households ().
85.4% of residents of 90743 zip code speak English at home.
6.7% of residents speak Spanish at home (100% very well).
7.2% of residents speak Asian or Pacific Island language at home (32% very well, 32% well, 35% not well).
Foreign born population: 49 (11.5%) (100.0% of them are naturalized citizens)
This zip code:
11.5%
Whole state:
26.7%
35%Guyana
21%Hong Kong
17%Germany
15%English
12%Irish
9%American
9%Norwegian
7%Scottish
5%Basque
Year of entry for the foreign-born population
02010 or later
02000 to 2009
01990 to 1999
46Before 1990
Housing units lacking complete plumbing facilities: 2.5% Housing units lacking complete kitchen facilities: 2.3%
61.3%Utility gas
34.1%Electricity
4.8%No fuel used
Place of birth for U.S.-born residents:
This state: 315
Northeast: 9
Midwest: 23
South: 25
West: 5
74% of the 90743 zip code residents lived in the same house 5 years ago. Out of people who lived in different houses, 41% lived in this county.
95% of the 90743 zip code residents lived in the same house 1 year ago. Out of people who lived in different houses, 112% moved from different state.
Private vs. public school enrollment:
Students in private schools in grades 1 to 8 (elementary and middle school):
Here:
0.0%
California:
10.5%
Students in private schools in grades 9 to 12 (high school):
Here:
0.0%
California:
8.5%
Students in private undergraduate colleges:
Here:
0.0%
California:
15.9%
Occupation by median earnings in the past 12 months ($)
134,793Health diagnosing and treating practitioners and other technical occupations
62,883Management occupations
Top industries in this zip code by the number of employees in 2005:
Accommodation and Food Services: Full-Service Restaurants (20-49 employees: 1 establishment)
Accommodation and Food Services: Limited-Service Restaurants (20-49: 1)
Construction: New Single-Family Housing Construction (except Operative Builders) (5-9: 1)
Other Services (except Public Administration): Other Similar Organizations (except Business, Professional, Labor, and Political Organizations) (5-9: 1)
Real Estate and Rental and Leasing: Lessors of Residential Buildings and Dwellings (1-4: 1)
Real Estate and Rental and Leasing: Other Activities Related to Real Estate (1-4: 1)
Real Estate and Rental and Leasing: Residential Property Managers (1-4: 1)
Accommodation and Food Services: Recreational and Vacation Camps (except Campgrounds) (1-4: 1)
Professional, Scientific, and Technical Services: Research and Development in the Physical, Engineering, and Life Sciences (1-4: 1)
Professional, Scientific, and Technical Services: Other Accounting Services (1-4: 1)
Home Mortgage Disclosure Act Aggregated Statistics For Year 2009 (Based on 2 partial tracts)
B) Conventional Home Purchase Loans
C) Refinancings
D) Home Improvement Loans
F) Non-occupant Loans on < 5 Family Dwellings (A B C & D)
Number
Average Value
Number
Average Value
Number
Average Value
Number
Average Value
LOANS ORIGINATED
4
$846,615
18
$582,334
0
$0
6
$544,102
APPLICATIONS APPROVED, NOT ACCEPTED
1
$1,909,150
0
$0
0
$0
0
$0
APPLICATIONS DENIED
0
$0
5
$541,696
1
$550,760
0
$0
APPLICATIONS WITHDRAWN
0
$0
4
$482,770
0
$0
0
$0
FILES CLOSED FOR INCOMPLETENESS
0
$0
0
$0
0
$0
0
$0
Aggregated Statistics For Year 2008 (Based on 2 partial tracts)
B) Conventional Home Purchase Loans
C) Refinancings
D) Home Improvement Loans
F) Non-occupant Loans on < 5 Family Dwellings (A B C & D)
Number
Average Value
Number
Average Value
Number
Average Value
Number
Average Value
LOANS ORIGINATED
1
$2,684,600
7
$846,266
0
$0
2
$1,250,910
APPLICATIONS APPROVED, NOT ACCEPTED
0
$0
1
$960,670
0
$0
0
$0
APPLICATIONS DENIED
3
$1,591,687
7
$705,199
1
$774,970
1
$2,028,560
APPLICATIONS WITHDRAWN
1
$2,661,200
2
$799,825
0
$0
0
$0
FILES CLOSED FOR INCOMPLETENESS
0
$0
2
$801,285
0
$0
0
$0
Aggregated Statistics For Year 2007 (Based on 2 partial tracts)
B) Conventional Home Purchase Loans
C) Refinancings
D) Home Improvement Loans
F) Non-occupant Loans on < 5 Family Dwellings (A B C & D)
Number
Average Value
Number
Average Value
Number
Average Value
Number
Average Value
LOANS ORIGINATED
9
$1,385,787
11
$928,675
1
$723,300
7
$1,254,150
APPLICATIONS APPROVED, NOT ACCEPTED
4
$1,238,850
3
$938,083
0
$0
2
$1,029,630
APPLICATIONS DENIED
6
$986,660
8
$1,119,801
0
$0
4
$683,700
APPLICATIONS WITHDRAWN
1
$3,012,130
5
$1,050,250
1
$1,379,340
1
$1,549,930
FILES CLOSED FOR INCOMPLETENESS
1
$1,894,520
0
$0
0
$0
0
$0
Aggregated Statistics For Year 2006 (Based on 2 partial tracts)
B) Conventional Home Purchase Loans
C) Refinancings
D) Home Improvement Loans
F) Non-occupant Loans on < 5 Family Dwellings (A B C & D)
Number
Average Value
Number
Average Value
Number
Average Value
Number
Average Value
LOANS ORIGINATED
13
$1,137,479
15
$742,180
5
$963,004
10
$1,075,838
APPLICATIONS APPROVED, NOT ACCEPTED
6
$497,553
3
$806,973
0
$0
3
$742,473
APPLICATIONS DENIED
9
$1,328,328
6
$848,077
1
$2,047,080
6
$1,324,510
APPLICATIONS WITHDRAWN
5
$1,234,390
3
$827,930
0
$0
1
$2,130,910
FILES CLOSED FOR INCOMPLETENESS
1
$609,250
0
$0
0
$0
1
$609,250
Aggregated Statistics For Year 2005 (Based on 2 partial tracts)
B) Conventional Home Purchase Loans
C) Refinancings
D) Home Improvement Loans
F) Non-occupant Loans on < 5 Family Dwellings (A B C & D)
Number
Average Value
Number
Average Value
Number
Average Value
Number
Average Value
LOANS ORIGINATED
9
$949,456
18
$711,767
2
$738,410
6
$660,508
APPLICATIONS APPROVED, NOT ACCEPTED
1
$717,450
1
$536,630
0
$0
0
$0
APPLICATIONS DENIED
3
$1,423,533
4
$855,998
0
$0
1
$821,270
APPLICATIONS WITHDRAWN
3
$1,000,143
4
$565,018
0
$0
1
$438,660
FILES CLOSED FOR INCOMPLETENESS
2
$999,900
1
$491,300
0
$0
0
$0
Aggregated Statistics For Year 2004 (Based on 2 partial tracts)
B) Conventional Home Purchase Loans
C) Refinancings
D) Home Improvement Loans
F) Non-occupant Loans on < 5 Family Dwellings (A B C & D)
Number
Average Value
Number
Average Value
Number
Average Value
Number
Average Value
LOANS ORIGINATED
9
$778,378
28
$535,426
1
$394,310
10
$537,651
APPLICATIONS APPROVED, NOT ACCEPTED
3
$437,360
3
$543,777
0
$0
1
$378,710
APPLICATIONS DENIED
6
$892,105
5
$542,964
0
$0
2
$607,055
APPLICATIONS WITHDRAWN
2
$804,695
3
$770,580
0
$0
1
$547,840
FILES CLOSED FOR INCOMPLETENESS
2
$584,880
1
$338,740
0
$0
2
$723,790
Aggregated Statistics For Year 2003 (Based on 2 partial tracts)
B) Conventional Home Purchase Loans
C) Refinancings
D) Home Improvement Loans
F) Non-occupant Loans on < 5 Family Dwellings (A B C & D)
Number
Average Value
Number
Average Value
Number
Average Value
Number
Average Value
LOANS ORIGINATED
13
$490,212
68
$397,331
1
$158,410
18
$396,933
APPLICATIONS APPROVED, NOT ACCEPTED
1
$594,630
7
$411,993
0
$0
2
$347,515
APPLICATIONS DENIED
3
$431,023
14
$376,760
0
$0
5
$439,732
APPLICATIONS WITHDRAWN
2
$491,300
10
$275,381
0
$0
1
$269,530
FILES CLOSED FOR INCOMPLETENESS
1
$325,580
2
$424,280
0
$0
0
$0
Aggregated Statistics For Year 2002 (Based on 2 partial tracts)
B) Conventional Home Purchase Loans
C) Refinancings
D) Home Improvement Loans
F) Non-occupant Loans on < 5 Family Dwellings (A B C & D)
Number
Average Value
Number
Average Value
Number
Average Value
Number
Average Value
LOANS ORIGINATED
11
$566,846
50
$406,657
1
$73,110
12
$413,356
APPLICATIONS APPROVED, NOT ACCEPTED
3
$437,687
6
$362,463
0
$0
0
$0
APPLICATIONS DENIED
1
$890,970
10
$433,981
0
$0
0
$0
APPLICATIONS WITHDRAWN
3
$630,857
6
$394,793
0
$0
1
$765,710
FILES CLOSED FOR INCOMPLETENESS
0
$0
2
$232,490
0
$0
0
$0
Aggregated Statistics For Year 2001 (Based on 2 partial tracts)
B) Conventional Home Purchase Loans
C) Refinancings
D) Home Improvement Loans
F) Non-occupant Loans on < 5 Family Dwellings (A B C & D)
Number
Average Value
Number
Average Value
Number
Average Value
Number
Average Value
LOANS ORIGINATED
12
$487,481
19
$405,978
0
$0
6
$401,293
APPLICATIONS APPROVED, NOT ACCEPTED
1
$223,720
3
$344,593
0
$0
0
$0
APPLICATIONS DENIED
2
$433,785
10
$433,883
1
$23,400
1
$587,320
APPLICATIONS WITHDRAWN
3
$200,483
5
$443,340
3
$36,230
1
$952,870
FILES CLOSED FOR INCOMPLETENESS
0
$0
3
$595,603
0
$0
0
$0
Aggregated Statistics For Year 2000 (Based on 2 partial tracts)
B) Conventional Home Purchase Loans
C) Refinancings
D) Home Improvement Loans
F) Non-occupant Loans on < 5 Family Dwellings (A B C & D)
Number
Average Value
Number
Average Value
Number
Average Value
Number
Average Value
LOANS ORIGINATED
9
$355,964
2
$524,930
1
$77,980
2
$429,645
APPLICATIONS APPROVED, NOT ACCEPTED
1
$613,640
2
$505,680
0
$0
0
$0
APPLICATIONS DENIED
3
$290,817
0
$0
0
$0
0
$0
APPLICATIONS WITHDRAWN
2
$220,790
1
$526,390
0
$0
0
$0
FILES CLOSED FOR INCOMPLETENESS
1
$437,690
1
$475,210
0
$0
0
$0
Aggregated Statistics For Year 1999 (Based on 1 partial tract)
B) Conventional Home Purchase Loans
C) Refinancings
F) Non-occupant Loans on < 5 Family Dwellings (A B C & D)

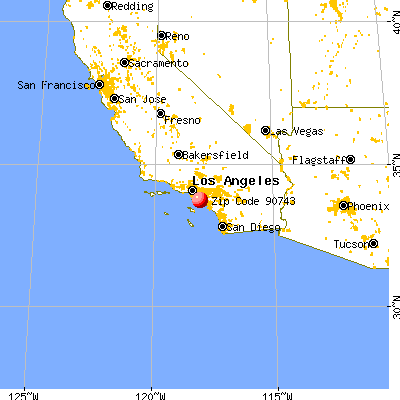


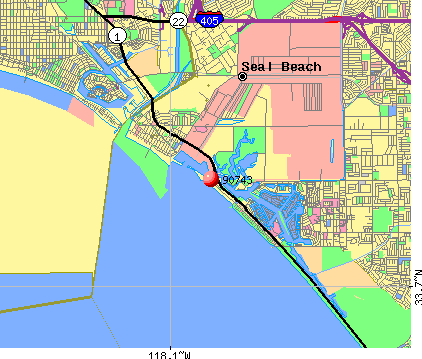 Nearest zip codes: 90742, 90740, 92649, 90803, 90822, 90814.


