Estimated zip code population in 2022: 41,474 Zip code population in 2010: 40,598 Zip code population in 2000: 41,050
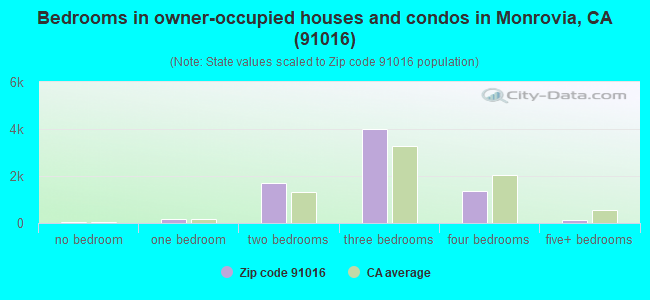
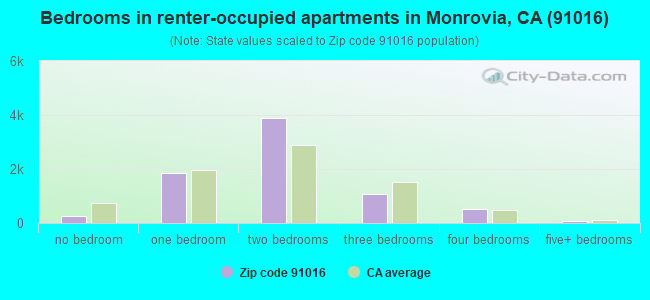
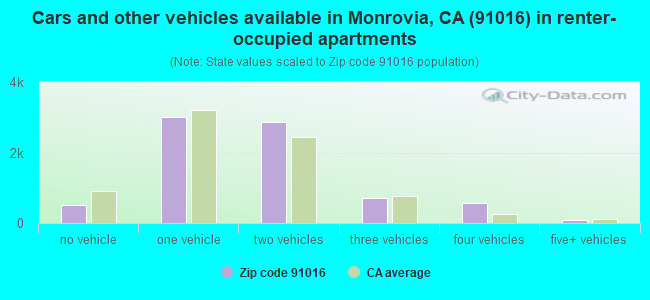
Houses and condos: 16,091 Renter-occupied apartments: 7,729
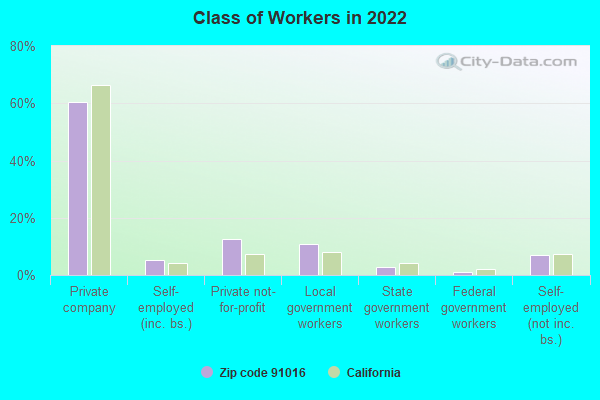
% of renters here:
51%
State:
44%
March 2022 cost of living index in zip code 91016: 136.1 (high, U.S. average is 100)
Land area: 8.5 sq. mi. Water area: 0.1 sq. mi.
Population density: 4,887 people per square mile
(average).
OSM Map
General Map
Google Map
MSN Map
OSM Map
General Map
Google Map
MSN Map
OSM Map
General Map
Google Map
MSN Map
OSM Map
General Map
Google Map
MSN Map
Please wait while loading the map...
Real estate property taxes paid for housing units in 2022:
This zip code:
0.6% ($5,632)
California:
0.7% ($4,831)
Median real estate property taxes paid for housing units with mortgages in 2022: $6,300 (0.7%) Median real estate property taxes paid for housing units with no mortgage in 2022: $3,863 (0.4%)
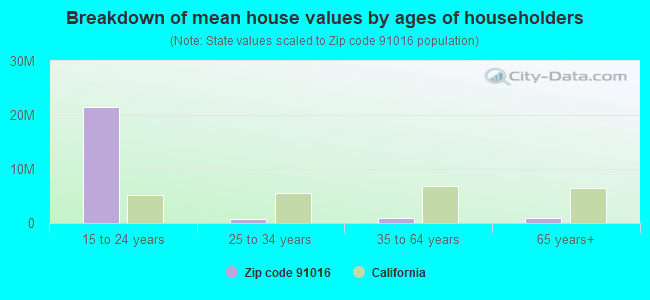
Estimated median house/condo value in 2022: $891,047
91016:
$891,047
California:
$715,900
According to our research of California and other state lists, there were 21 registered sex offenders living in 91016 zip code as of May 28, 2024. The ratio of all residents to sex offenders in zip code 91016 is 2,024 to 1. The ratio of registered sex offenders to all residents in this zip code is much lower than the state average.
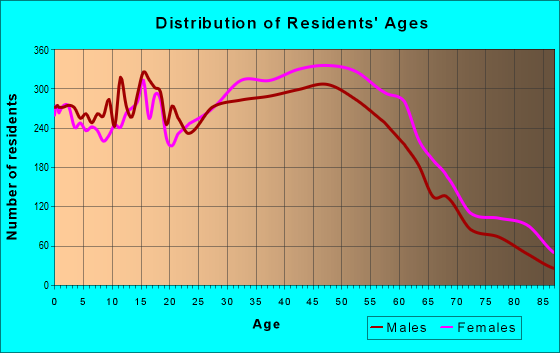
Median resident age:
This zip code:
39.1 years
California median age:
37.9 years
Average household size:
This zip code:
2.7 people
California:
2.8 people
Averages for the 2020 tax year for zip code 91016, filed in 2021:
Average Adjusted Gross Income (AGI) in 2020: $79,702 (Individual Income Tax Returns)
Here:
$79,702
State:
$95,910
Salary/wage: $70,503 (reported on 81.1% of returns)
Here:
$70,503
State:
$77,331
(% of AGI for various income ranges: 1171.8% for AGIs below $25k, 4021.9% for AGIs $25k-50k, 7318.6% for AGIs $50k-75k, 10860.6% for AGIs $75k-100k, 20625.1% for AGIs $100k-200k, 83323.9% for AGIs over 200k)
Taxable interest for individuals: $1,256 (reported on 36.1% of returns)
This zip code:
$1,256
California:
$2,294
(% of AGI for various income ranges: 19.3% for AGIs below $25k, 28.9% for AGIs $25k-50k, 42.6% for AGIs $50k-75k, 72.6% for AGIs $75k-100k, 142.4% for AGIs $100k-200k, 799.3% for AGIs over 200k)
Ordinary dividends: $6,173 (reported on 20.5% of returns)
Here:
$6,173
State:
$10,949
(% of AGI for various income ranges: 23.7% for AGIs below $25k, 39.6% for AGIs $25k-50k, 78.1% for AGIs $50k-75k, 91.4% for AGIs $75k-100k, 307.1% for AGIs $100k-200k, 3763.2% for AGIs over 200k)
Net capital gain/loss in AGI: +$18,603 (reported on 19.7% of returns)
Here:
+$18,603
State:
+$49,306
(% of AGI for various income ranges: 9.5% for AGIs below $25k, 27.1% for AGIs $25k-50k, 89.8% for AGIs $50k-75k, 178.1% for AGIs $75k-100k, 566.1% for AGIs $100k-200k, 14461.2% for AGIs over 200k)
Profit/loss from business: +$11,981 (reported on 20.7% of returns)
Here:
+$11,981
State:
+$15,671
(% of AGI for various income ranges: 219.4% for AGIs below $25k, 218.5% for AGIs $25k-50k, 272.9% for AGIs $50k-75k, 371.0% for AGIs $75k-100k, 583.1% for AGIs $100k-200k, 3583.2% for AGIs over 200k)
Taxable individual retirement arrangement distribution: $22,448 (reported on 6.5% of returns)
91016:
$22,448
California:
$23,505
(% of AGI for various income ranges: 41.0% for AGIs below $25k, 73.5% for AGIs $25k-50k, 178.0% for AGIs $50k-75k, 266.0% for AGIs $75k-100k, 543.4% for AGIs $100k-200k, 2304.1% for AGIs over 200k)
Self-employed (Keogh) retirement plans: $21,144 (reported on 0.8% of returns)
91016:
$21,144
California:
$30,163
(% of AGI for various income ranges: 17.1% for AGIs $50k-75k, 27.4% for AGIs $100k-200k, 622.7% for AGIs over 200k)
Total itemized deductions: $35,470 (reported on 17.4% of returns)
Here:
$35,470
State:
$39,517
(% of AGI for various income ranges: 100.1% for AGIs below $25k, 228.1% for AGIs $25k-50k, 560.6% for AGIs $50k-75k, 1064.9% for AGIs $75k-100k, 2394.3% for AGIs $100k-200k, 11583.4% for AGIs over 200k)
Charity contributions: $8,207 (reported on 14.8% of returns)
Here:
$8,207
State:
$12,598
(% of AGI for various income ranges: 5.2% for AGIs below $25k, 20.9% for AGIs $25k-50k, 70.3% for AGIs $50k-75k, 130.8% for AGIs $75k-100k, 395.3% for AGIs $100k-200k, 3339.0% for AGIs over 200k)
Taxes paid: $8,846 (reported on 17.4% of returns)
91016:
$8,846
State:
$8,807
(% of AGI for various income ranges: 19.9% for AGIs below $25k, 53.8% for AGIs $25k-50k, 153.2% for AGIs $50k-75k, 333.3% for AGIs $75k-100k, 719.2% for AGIs $100k-200k, 2136.3% for AGIs over 200k)
Earned income credit: $1,805 (reported on 12.8% of returns)
Here:
$1,805
State:
$2,074
(% of AGI for various income ranges: 76.8% for AGIs below $25k, 56.5% for AGIs $25k-50k, 0.8% for AGIs $50k-75k)
Percentage of individuals using paid preparers for their 2020 taxes: 92.3%
Here:
92%
State:
92%
(% for various income ranges: 90.8% for AGIs below $25k, 92.9% for AGIs $25k-50k, 92.8% for AGIs $50k-75k, 91.1% for AGIs $75k-100k, 94.1% for AGIs $100k-200k, 93.1% for AGIs over 200k)
Averages for the 2012 tax year for zip code 91016, filed in 2013:
Average Adjusted Gross Income (AGI) in 2012: $63,622 (Individual Income Tax Returns)
Here:
$63,622
State:
$72,726
Salary/wage: $56,075 (reported on 83.9% of returns)
Here:
$56,075
State:
$59,079
(% of AGI for various income ranges: 73.8% for AGIs below $25k, 82.5% for AGIs $25k-50k, 81.3% for AGIs $50k-75k, 80.8% for AGIs $75k-100k, 80.5% for AGIs $100k-200k, 53.5% for AGIs over 200k)
Taxable interest for individuals: $1,297 (reported on 36.2% of returns)
This zip code:
$1,297
California:
$2,146
(% of AGI for various income ranges: 0.9% for AGIs below $25k, 0.6% for AGIs $25k-50k, 0.5% for AGIs $50k-75k, 0.6% for AGIs $75k-100k, 0.5% for AGIs $100k-200k, 1.2% for AGIs over 200k)
Ordinary dividends: $5,149 (reported on 17.8% of returns)
Here:
$5,149
State:
$9,308
(% of AGI for various income ranges: 1.1% for AGIs below $25k, 0.8% for AGIs $25k-50k, 1.0% for AGIs $50k-75k, 0.9% for AGIs $75k-100k, 1.1% for AGIs $100k-200k, 2.8% for AGIs over 200k)
Net capital gain/loss in AGI: +$10,037 (reported on 15.1% of returns)
Here:
+$10,037
State:
+$30,460
(% of AGI for various income ranges: 0.2% for AGIs $50k-75k, 0.4% for AGIs $75k-100k, 0.8% for AGIs $100k-200k, 8.7% for AGIs over 200k)
Profit/loss from business: +$14,190 (reported on 18.9% of returns)
Here:
+$14,190
State:
+$17,064
(% of AGI for various income ranges: 12.8% for AGIs below $25k, 5.0% for AGIs $25k-50k, 3.0% for AGIs $50k-75k, 2.9% for AGIs $75k-100k, 3.4% for AGIs $100k-200k, 3.7% for AGIs over 200k)
Taxable individual retirement arrangement distribution: $15,847 (reported on 7.3% of returns)
91016:
$15,847
California:
$19,557
(% of AGI for various income ranges: 2.2% for AGIs below $25k, 1.6% for AGIs $25k-50k, 1.7% for AGIs $50k-75k, 1.7% for AGIs $75k-100k, 1.9% for AGIs $100k-200k, 1.8% for AGIs over 200k)
Self-employment retirement plans: $21,738 (reported on 0.7% of returns)
91016:
$21,738
California:
$24,530
(% of AGI for various income ranges: 0.2% for AGIs $50k-75k, 0.2% for AGIs $100k-200k, 0.6% for AGIs over 200k)
Total itemized deductions: $29,055 (25% of AGI, reported on 38.6% of returns)
Here:
$29,055
State:
$34,004
Here:
25.0% of AGI
State:
22.7% of AGI
(% of AGI for various income ranges: 10.9% for AGIs below $25k, 12.4% for AGIs $25k-50k, 18.4% for AGIs $50k-75k, 20.1% for AGIs $75k-100k, 20.9% for AGIs $100k-200k, 16.7% for AGIs over 200k)
Charity contributions: $3,709 (reported on 32.7% of returns)
Here:
$3,709
State:
$4,659
(% of AGI for various income ranges: 0.6% for AGIs below $25k, 1.2% for AGIs $25k-50k, 1.8% for AGIs $50k-75k, 2.2% for AGIs $75k-100k, 2.2% for AGIs $100k-200k, 2.3% for AGIs over 200k)
Taxes paid: $10,983 (reported on 38.5% of returns)
91016:
$10,983
State:
$14,448
(% of AGI for various income ranges: 2.2% for AGIs below $25k, 3.0% for AGIs $25k-50k, 5.1% for AGIs $50k-75k, 6.7% for AGIs $75k-100k, 8.3% for AGIs $100k-200k, 8.9% for AGIs over 200k)
Earned income credit: $2,148 (reported on 16.8% of returns)
Here:
$2,148
State:
$2,286
(% of AGI for various income ranges: 6.0% for AGIs below $25k, 1.0% for AGIs $25k-50k)
Percentage of individuals using paid preparers for their 2012 taxes: 65.4%
Here:
65%
State:
64%
(% for various income ranges: 62.2% for AGIs below $25k, 65.6% for AGIs $25k-50k, 66.3% for AGIs $50k-75k, 67.6% for AGIs $75k-100k, 69.1% for AGIs $100k-200k, 74.2% for AGIs over 200k)
Averages for the 2004 tax year for zip code 91016, filed in 2005:
Average Adjusted Gross Income (AGI) in 2004: $50,803 (Individual Income Tax Returns)
Here:
$50,803
State:
$58,600
Salary/wage: $47,238 (reported on 85.4% of returns)
Here:
$47,238
State:
$49,455
(% of AGI for various income ranges: 121.6% for AGIs below $10k, 78.9% for AGIs $10k-25k, 85.7% for AGIs $25k-50k, 85.2% for AGIs $50k-75k, 84.3% for AGIs $75k-100k, 71.1% for AGIs over 100k)
Taxable interest for individuals: $1,463 (reported on 44.4% of returns)
This zip code:
$1,463
California:
$2,365
(% of AGI for various income ranges: 6.7% for AGIs below $10k, 1.7% for AGIs $10k-25k, 1.0% for AGIs $25k-50k, 0.9% for AGIs $50k-75k, 0.9% for AGIs $75k-100k, 1.4% for AGIs over 100k)
Taxable dividends: $2,229 (reported on 20.2% of returns)
Here:
$2,229
State:
$4,746
(% of AGI for various income ranges: 3.7% for AGIs below $10k, 0.9% for AGIs $10k-25k, 0.7% for AGIs $25k-50k, 0.8% for AGIs $50k-75k, 0.7% for AGIs $75k-100k, 1.0% for AGIs over 100k)
Net capital gain/loss: +$7,625 (reported on 16.6% of returns)
Here:
+$7,625
State:
+$23,418
(% of AGI for various income ranges: -3.0% for AGIs below $10k, 0.1% for AGIs $10k-25k, 0.3% for AGIs $25k-50k, 0.4% for AGIs $50k-75k, 0.9% for AGIs $75k-100k, 5.6% for AGIs over 100k)
Profit/loss from business: +$13,369 (reported on 17.6% of returns)
Here:
+$13,369
State:
+$16,826
(% of AGI for various income ranges: 8.2% for AGIs below $10k, 8.4% for AGIs $10k-25k, 4.3% for AGIs $25k-50k, 3.8% for AGIs $50k-75k, 3.7% for AGIs $75k-100k, 4.6% for AGIs over 100k)
IRA payment deduction: $3,065 (reported on 3.0% of returns)
91016:
$3,065
California:
$3,192
(% of AGI for various income ranges: 0.3% for AGIs below $10k, 0.2% for AGIs $10k-25k, 0.3% for AGIs $25k-50k, 0.2% for AGIs $50k-75k, 0.2% for AGIs $75k-100k, 0.1% for AGIs over 100k)
Self-employed pension: $14,212 (reported on 1.2% of returns)
Here:
$14,212
California:
$17,688
(% of AGI for various income ranges: 0.1% for AGIs $10k-25k, 0.1% for AGIs $25k-50k, 0.2% for AGIs $50k-75k, 0.1% for AGIs $75k-100k, 0.6% for AGIs over 100k)
Total itemized deductions: $24,634 (28% of AGI, reported on 40.9% of returns)
Here:
$24,634
State:
$28,113
Here:
27.8% of AGI
State:
25.3% of AGI
(% of AGI for various income ranges: 22.0% for AGIs below $10k, 11.9% for AGIs $10k-25k, 16.1% for AGIs $25k-50k, 22.0% for AGIs $50k-75k, 23.8% for AGIs $75k-100k, 20.6% for AGIs over 100k)
Charity contributions deductions: $3,272 (4% of AGI, reported on 36.9% of returns)
Here:
$3,272
State:
$3,923
Here:
3.5% of AGI
State:
3.3% of AGI
(% of AGI for various income ranges: 1.1% for AGIs below $10k, 1.0% for AGIs $10k-25k, 1.8% for AGIs $25k-50k, 2.6% for AGIs $50k-75k, 2.7% for AGIs $75k-100k, 2.8% for AGIs over 100k)
Total tax: $7,731 (reported on 76.7% of returns)
91016:
$7,731
State:
$10,761
(% of AGI for various income ranges: 4.6% for AGIs below $10k, 4.3% for AGIs $10k-25k, 6.7% for AGIs $25k-50k, 9.2% for AGIs $50k-75k, 10.2% for AGIs $75k-100k, 17.1% for AGIs over 100k)
Earned income credit: $1,708 (reported on 14.7% of returns)
Here:
$1,708
State:
$1,763
Percentage of individuals using paid preparers for their 2004 taxes: 67.8%
Here:
68%
State:
66%
(% for various income ranges: 59.8% for AGIs below $10k, 67.9% for AGIs $10k-25k, 69.1% for AGIs $25k-50k, 69.6% for AGIs $50k-75k, 69.6% for AGIs $75k-100k, 72.5% for AGIs over 100k)
Likely homosexual households (counted as self-reported same-sex unmarried-partner households)
Lesbian couples: 0.1% of all households
Gay men: 0.0% of all households
Household received Food Stamps/SNAP in the past 12 months: 1,480 Household did not receive Food Stamps/SNAP in the past 12 months: 13,597
Women who had a birth in the past 12 months: 347 (263 now married, 83 unmarried) Women who did not have a birth in the past 12 months: 9,828 (3,966 now married, 5,858 unmarried)
Housing units in zip code 91016 with a mortgage: 4,864 (522 second mortgage, 38 home equity loan, 458 both second mortgage and home equity loan) Houses without a mortgage: 29
Median monthly owner costs for units with a mortgage: $2,828 Median monthly owner costs for units without a mortgage: $841
Residents with income below the poverty level in 2022:
This zip code:
9.6%
Whole state:
12.2%
Residents with income below 50% of the poverty level in 2022:
This zip code:
6.7%
Whole state:
6.2%
Median number of rooms in houses and condos:
Here:
5.9
State:
6.0
Median number of rooms in apartments:
Here:
4.1
State:
3.9
Notable locations in this zip code not listed on our city pages
Notable locations in zip code 91016: Monrovia Public Library (A), Monrovia City Hall (B), Medic 1 Ambulance Service Monrovia (C), Medic 1 Ambulance Service Headquarters (D), Monarc Ambulance (E), Aegis Ambulance Service (F), City of Monrovia Fire Department Station 102 (G), City of Monrovia Fire Department Station 101 Headquarters (H). Display/hide their locations on the map
Shopping Centers: Monrovia Shopping Center (1), Huntington Oaks Shopping Center (2), Foothill Park Plaza Shopping Center (3), Arcadia Specialty Center Shopping Center (4). Display/hide their locations on the map
Churches in zip code 91016 include: All Nation's Seventh Day Adventist Church (A), Antioch Church (B), Bethlehem Temple Apostolic Church (C), Calvary Road Baptist Church (D), First Baptist Church (E), First Church of the Nazarene (F), Greater Ambassador Church of God (G), Immaculate Conception Church (H), Kingdom Hall of Jehovahs Witnesses (I). Display/hide their locations on the map
Parks in zip code 91016 include: Monrovia Mountain Park (1), Olive Park (2), Grand Avenue Park (3), Julian Fisher Park (4), Library Park (5), Recreation Park (6), Oak Park (7). Display/hide their locations on the map
5,690 married couples with children.
1,989 single-parent households (600 men, 1,389 women).
56.0% of residents of 91016 zip code speak English at home.
29.0% of residents speak Spanish at home (74% very well, 14% well, 9% not well, 3% not at all).
2.4% of residents speak other Indo-European language at home (70% very well, 27% well, 2% not well, 1% not at all).
11.9% of residents speak Asian or Pacific Island language at home (62% very well, 25% well, 11% not well, 3% not at all).
0.3% of residents speak other language at home (76% very well, 20% well, 5% not well).
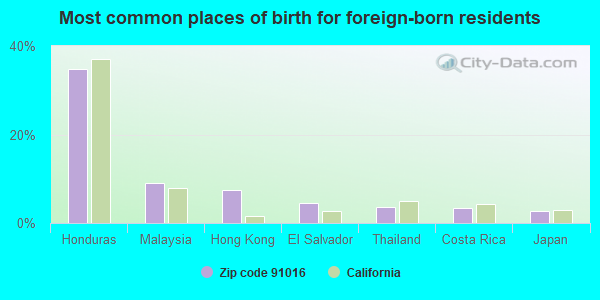
Foreign born population: 10,325 (24.9%) (62.2% of them are naturalized citizens)
This zip code:
24.9%
Whole state:
26.7%
35%Honduras
9%Malaysia
8%Hong Kong
5%El Salvador
4%Thailand
3%Costa Rica
3%Japan
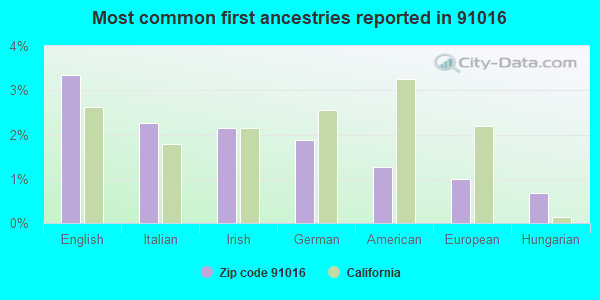
3%English
2%Italian
2%Irish
2%German
1%American
1%European
1%Hungarian
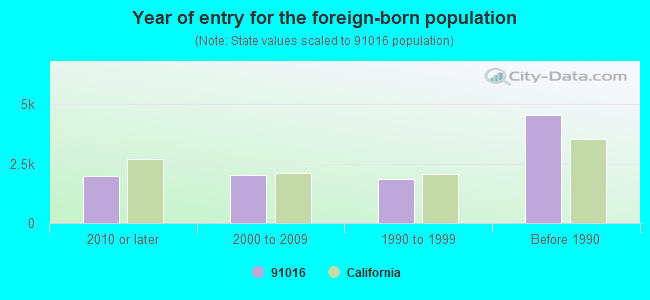
Year of entry for the foreign-born population
1,8182010 or later
2,1662000 to 2009
2,0211990 to 1999
4,552Before 1990
Major facilities with environmental interests located in this zip code:
CEREXAGRI, INC. DECCO (1713 S. CALIFORNIA AVE. in MONROVIA, CA)
STATE MASTER (California - Hazardous Waste Tracking) - HAZARDOU WASTE PROGRAM COMPLIANCE ACTIVITY (Tracking inspections of insecticide, fungicide, and rodenticide, and toxic substances) Small Quantity Generators, between 100 kg and 1000 kg of hazardous waste/month (Resource Conservation and Recovery Act (tracking hazardous waste)) - notification TRI REPORTER (Tracking of toxic chemicals releasing facilities) - ICIS-, ENFORCEMENT/COMPLIANCE ACTIVITY Business SIC classification: SHORTENING, TABLE OILS, MARGARINE, AND OTHER EDIBLE FATS AND OILS Organizations: ELF ATOCHEM N AMERICA INC (CONTACT/OWNER)
Alternative names: CEREXAGRI-DECCO INC, ELF ATOCHEM N.A. INC., ELF ATOCHEM NORTH AMERICA INC
JAN-KENS ENAMELING CO INC (715 E CYPRESS in MONROVIA, CA)
AIR MINOR (AIRS/AFS) STATE MASTER (California - Hazardous Waste Tracking) - HAZARDOU WASTE PROGRAM (Integrated Compliance Information System) - ICIS-09-2002-0056, FORMAL ENFORCEMENT ACTION Small Quantity Generators, between 100 kg and 1000 kg of hazardous waste/month (Resource Conservation and Recovery Act (tracking hazardous waste)) Business SIC classification: MACHINE TOOLS, METAL FORMING TYPES
3M UNITEK (2724 S. PECK RD. in MONROVIA, CA)
STATE MASTER (California - Hazardous Waste Tracking) - HAZARDOU WASTE PROGRAM PERFORMANCE TRACK (National Environmental Performance Track) HAZARDOUS WASTE BIENNIAL REPORTER (Resource Conservation and Recovery Act (tracking hazardous waste)) Large Quantity Generators, more that 1000 kg of hazardous waste/month (Resource Conservation and Recovery Act (tracking hazardous waste)) - notification TRI REPORTER (Tracking of toxic chemicals releasing facilities) Business SIC and NAICS classification: DENTAL EQUIPMENT AND SUPPLIES Organizations: 3M UNITEK CORPORATION (CONTACT/OPERATOR)
, 3M CORPORATION (CONTACT/OWNER)
Alternative names: 3M Unitek Corporation - Monrovia, California, UNITEK CORP
ELECTROCUBE INC (1307 S MYRTLE AVE in MONROVIA, CA)
AIR MINOR (AIRS/AFS) STATE MASTER (California - Hazardous Waste Tracking) - HAZARDOU WASTE PROGRAM Small Quantity Generators, between 100 kg and 1000 kg of hazardous waste/month (Resource Conservation and Recovery Act (tracking hazardous waste)) - notification TRI REPORTER (Tracking of toxic chemicals releasing facilities) Business SIC classification: ELECTRONIC CAPACITORS; ELECTRONIC COMPONENTS Business NAICS classification: OTHER ELECTRONIC COMPONENT MANUFACTURING. Organizations: ELECTROCUBE, INC (CONTACT/OWNER)
MWH LABORATORIES DIV OF MWH AMERICAS INC (750 ROYAL OAKS DRIVE SUITE 100 in MONROVIA, CA)
STATE MASTER (New Jersey environmental info) - NJEMS-CA008, LAB CERTIFICATION - COMMERCIAL ENVIRONMENTAL LAB Large Quantity Generators, more that 1000 kg of hazardous waste/month (Resource Conservation and Recovery Act (tracking hazardous waste)) Business SIC classification: TESTING LABORATORIES Organizations: MONTGOMERY WATSON LABORATORIES, MWH LABORATORY A DIVISION OF MWH AMERICAS INC, MWH LABORATORIES, A DIV. OF MWH AMERICAS (CONTACT/OPERATOR)
, MWH AMERICAS, INC. (CONTACT/OWNER)
Alternative names: M W H LABORATORIES
801 ROYAL OAKS GROUP (801 ROYAL OAKS DR LOT A in MONROVIA, CA) . Federal Facility
STATE MASTER (California - Hazardous Waste Tracking) - HAZARDOU WASTE PROGRAM HAZARDOUS WASTE BIENNIAL REPORTER (Resource Conservation and Recovery Act (tracking hazardous waste)) Large Quantity Generators, more that 1000 kg of hazardous waste/month (Resource Conservation and Recovery Act (tracking hazardous waste)) - notification Organizations: ALCOA INC AND WHITTAKER CORP (CONTACT/OWNER)
Alternative names: 801 ROYAL OAKS INSTALLATION A, ALUMINUM COMPANY OF AMERICA
METAL RUBBER CORP (1225 S AHMROCK AVE in MONROVIA, CA)
STATE MASTER (California - Hazardous Waste Tracking) - HAZARDOU WASTE PROGRAM (Resource Conservation and Recovery Act (tracking hazardous waste)) Organizations: FERNANDO ALVAREZ (CONTACT/OWNER)
EQUILON ENTERPRISES (102 W HUNTINGTON in MONROVIA, CA) . Federal Facility
STATE MASTER (California - Hazardous Waste Tracking) - HAZARDOU WASTE PROGRAM Small Quantity Generators, between 100 kg and 1000 kg of hazardous waste/month (Resource Conservation and Recovery Act (tracking hazardous waste)) Small Quantity Generators, between 100 kg and 1000 kg of hazardous waste/month (Resource Conservation and Recovery Act (tracking hazardous waste)) - notification Organizations: WALTER RASPUDIC (CONTACT/OWNER)
Alternative names: MONROVIA SHELL, SHELL S/S 204-5076-0200
INTEGRATED MICROMACHINES INC (1400 SHAMROCK AVE in MONROVIA, CA)
STATE MASTER (California - Hazardous Waste Tracking) - HAZARDOU WASTE PROGRAM Large Quantity Generators, more that 1000 kg of hazardous waste/month (Resource Conservation and Recovery Act (tracking hazardous waste)) - notification Organizations: BIXBY RANCH COMPANY (CONTACT/OWNER)
HOMERS AUTO SERVICE (148 E LEMON in MONROVIA, CA)
Small Quantity Generators, between 100 kg and 1000 kg of hazardous waste/month (Resource Conservation and Recovery Act (tracking hazardous waste)) - notification STATE MASTER (California - Used Oil Recycling System ) - USED OIL RECYCLING Organizations: HOMER T RIGBY (CONTACT/OWNER)
Alternative names: HOMER S AUTO SERVICE
MACS AUTOMOTIVE (804 E HUNTINGTON "D" in MONROVIA, CA)
STATE MASTER (California - Hazardous Waste Tracking) - HAZARDOU WASTE PROGRAM Small Quantity Generators, between 100 kg and 1000 kg of hazardous waste/month (Resource Conservation and Recovery Act (tracking hazardous waste)) - notification Organizations: JIM MCKENDRICK (CONTACT/OWNER)
LIEDER DEVELOPMENT INC (335 GENOA ST in MONROVIA, CA)
STATE MASTER (California - Hazardous Waste Tracking) - HAZARDOU WASTE PROGRAM Small Quantity Generators, between 100 kg and 1000 kg of hazardous waste/month (Resource Conservation and Recovery Act (tracking hazardous waste)) - notification Business NAICS classification: OTHER ELECTRONIC COMPONENT MANUFACTURING. Organizations: GORDON LESLIE (CONTACT/OWNER)
JOHNS AUTOMATIC TRAS SERVICE INC (1827 S MYRTLE AVE in MONROVIA, CA)
STATE MASTER (California - Hazardous Waste Tracking) - HAZARDOU WASTE PROGRAM Small Quantity Generators, between 100 kg and 1000 kg of hazardous waste/month (Resource Conservation and Recovery Act (tracking hazardous waste)) - notification Organizations: JOHN SEARS (CONTACT/OWNER)
Alternative names: JOHNS AUTOMATIC TRANS SVC INC
Housing units lacking complete plumbing facilities: 1.1% Housing units lacking complete kitchen facilities: 2.2%
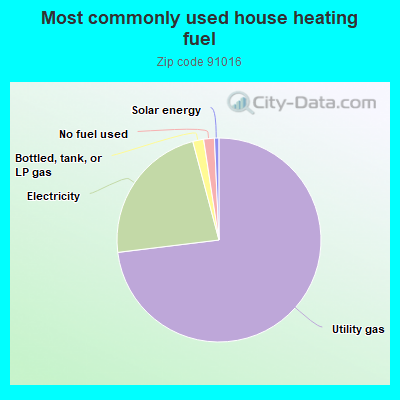
72.7%Utility gas
22.7%Electricity
1.7%Bottled, tank, or LP gas
1.7%No fuel used
0.7%Solar energy
Population in 1990: 39,015. Population change in the 1990s: +2,035 (+5.2%).
Place of birth for U.S.-born residents:
This state: 25,591
Northeast: 927
Midwest: 1,620
South: 1,490
West: 1,170
52% of the 91016 zip code residents lived in the same house 5 years ago. Out of people who lived in different houses, 84% lived in this county. Out of people who lived in different counties, 50% lived in California.
92% of the 91016 zip code residents lived in the same house 1 year ago. Out of people who lived in different houses, 75% moved from this county. Out of people who lived in different houses, 12% moved from different county within same state. Out of people who lived in different houses, 6% moved from different state. Out of people who lived in different houses, 6% moved from abroad.
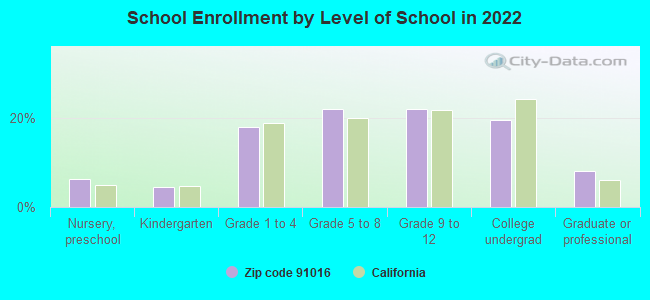
Private vs. public school enrollment:
Students in private schools in grades 1 to 8 (elementary and middle school): 409
Here:
9.9%
California:
10.5%
Students in private schools in grades 9 to 12 (high school): 273
Here:
12.1%
California:
8.5%
Students in private undergraduate colleges: 222
Here:
11.1%
California:
15.9%
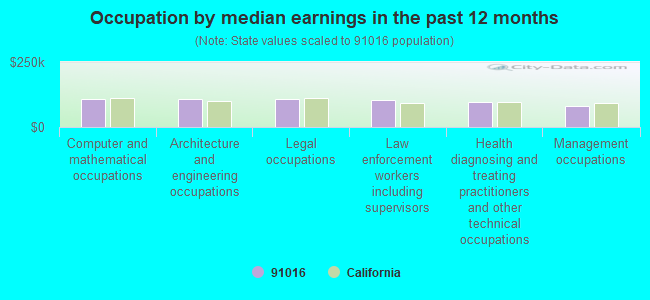
Occupation by median earnings in the past 12 months ($)
103,918Architecture and engineering occupations
102,654Law enforcement workers including supervisors
97,709Legal occupations
96,504Health diagnosing and treating practitioners and other technical occupations
93,809Computer and mathematical occupations
81,112Life, physical, and social science occupations
Companies with biggest federal contracts located in this zip code (MONROVIA, CA):
AEROVIRONMENT INC (825 SOUTH MYRTLE; small business) : $209,544,979 in 282 contractsfrom 1999 to 2006
Contracts for Drones, Airframe Structural Components, Aircraft, Fixed Wing, Gliders, and moreby Army, Air Force, Navy, NASA, and others Signed by year:2000: $3,107,385; 2001: $6,858,009; 2002: $9,013,469; 2003: $30,138,894; 2004: $54,078,699; 2005: $101,206,461; 2006: $5,046,625.
Biggest contracts:
$24,191,303 with Army for Drones. Signed on 2005-02-25. Completion date: 2004-12-31.
$20,700,000, same as above.Signed on 2004-01-02. Completion date: 2004-12-31.
$17,579,617, same as above.Signed on 2005-09-08. Completion date: 2006-02-25.
$12,095,651, same as above.Signed on 2005-08-11. Completion date: 2004-12-31.
DUCOMMUN AEROSTRUCTURES (801 ROYAL OAKS DRIVE; small business) : $8,466,302 in 15 contractsfrom 2000 to 2006
Contracts for Airframe Structural Components, Helicopter Rotor Blades, Drive Mechanisms and Components, Bearings, Plain, Unmounted, Maintenance, Repair and Rebuilding of Equipment -- Aircraft and Airframe Structural Components, and moreby Army, Defense Logistics Agency Signed by year:2000: $612,046; 2001: $925,915; 2002: $0; 2003: $2,182,726; 2004: $1,245,816; 2005: $176,831; 2006: $3,322,968.
Biggest contracts:
$3,321,000 with Army for Airframe Structural Components. Signed on 2006-05-09. Completion date: 2008-06-30.
$1,227,684, same as above.Signed on 2004-10-07. Completion date: 2007-01-31.
$1,118,600, same as above.Signed on 2003-01-30. Completion date: 2004-12-31.
$1,062,751, same as above.Signed on 2003-08-15. Completion date: 2005-09-30.
AIR LOGISTICS CORPORATION (146 E RAILROAD AVE; small business) : $3,397,944 in 23 contractsfrom 2000 to 2006
Contracts for Storage Tanks, Power and Hand Pumps, Gas Generating and Dispensing Systems, Fixed or Mobile, Aircraft Maintenance and Repair Shop Specialized Equipment, and moreby Air Force, U.S. Special Operations Command, Department of Defense, Army, and others Signed by year:2000: $713,045; 2001: $600,598; 2002: $744,983; 2003: $66,248; 2004: $552,000; 2005: $683,498; 2006: $37,572.
Biggest contracts:
$682,295 with Air Force for Storage Tanks. Signed on 2000-07-26. Completion date: 2001-06-30.
$666,975, same as above.Signed on 2002-05-14. Completion date: 2003-03-31.
$552,000 with U.S. Special Operations Command for Power and Hand Pumps. Taking place in NC. Signed on 2004-06-10. Completion date: 2005-01-31.
$473,750 with Department of Defense for Power and Hand Pumps. Signed on 2005-09-30. Completion date: 2006-03-31.
LINEAR INDUSTRIES, LTD (1850 ENTERPRISE WAY; small business) : $1,487,740 in 31 contractsfrom 2001 to 2006
Contracts for Hand Tools, Nonedged, Nonpowered, Radar Equipment, Except Airborne, Maintenance, Repair and Rebuilding of Equipment -- Aircraft Components and Accessories, Maintenance, Repair and Rebuilding of Equipment -- Electrical and Electronic Equipment Components, and moreby Army, Air Force Signed by year:2000: $0; 2001: $66,230; 2002: $271,887; 2003: $252,598; 2004: $67,493; 2005: $721,190; 2006: $108,342.
Biggest contracts:
$155,185 with Army for Hand Tools, Nonedged, Nonpowered. Signed on 2005-02-07. Completion date: 2005-04-29.
$142,488 with Army for Radar Equipment, Except Airborne. Signed on 2005-08-17. Completion date: 2005-12-23.
$117,900 with Army for Hand Tools, Nonedged, Nonpowered. Signed on 2005-03-29. Completion date: 2005-07-29.
$108,342, same as above.Signed on 2006-03-15. Completion date: 2006-07-14.
PARASOFT CORPORATION (101 EAST HUNTINGTON DRIVE; small business) : $751,948 in 45 contractsfrom 2000 to 2006
Contracts for ADP Software, ADP Components, ADP System Acquisition Support Services. Includes preparation of statement of work, benchmarks, specifications, etc., Other ADP and Telecommunications Services (includes data storage on tapes, compact disks, etc.), and moreby Centers for Disease Control and Prevention, Navy, Internal Revenue Service, Food and Drug Administration, and others Signed by year:2000: $41,940; 2001: $0; 2002: $3,865; 2003: $8,234; 2004: $66,869; 2005: $464,058; 2006: $166,982.
Biggest contracts:
$86,645 with Centers for Disease Control and Prevention for ADP Software. Taking place in GA. Signed on 2005-08-23. Completion date: 2006-08-01.
$83,880 with Navy for ADP Components. Taking place in VA. Signed on 2005-07-21. Completion date: 2005-08-12.
$76,390 with Internal Revenue Service for ADP System Acquisition Support Services. Includes preparation of statement of work, benchmarks, specifications, etc.. Taking place in MD. Signed on 2006-06-29. Effective on 2006-06-28. Completion date: 2007-07-31.
$60,000 with Navy for ADP Software. Signed on 2005-04-29. Completion date: 2005-05-09.
JOHN CHADWICK CORPORATION (1005 S MOUNTAIN AVE; small business) : $679,115 in 18 contractsfrom 2000 to 2006
Contracts for Optical Instruments, Test Equipment, Components and Accessories, Laboratory Equipment and Supplies, Other Quality Control, Testing and Inspection Services -- Aircraft and Airframe Structural Components, Technical Assistance, and moreby Air Force, Navy, Army, Defense Logistics Agency, and others Signed by year:2000: $34,935; 2001: $81,000; 2002: $209,625; 2003: $3,450; 2004: $118,704; 2005: $27,400; 2006: $204,001.
Biggest contracts:
$209,625 with Air Force for Optical Instruments, Test Equipment, Components and Accessories. Signed on 2002-08-26. Completion date: 2002-10-31.
$102,364, same as above.Signed on 2006-06-06. Completion date: 2006-08-15.
$98,212 with Navy for Optical Instruments, Test Equipment, Components and Accessories. Signed on 2006-01-05. Completion date: 2006-04-05.
$87,750 with Navy for Laboratory Equipment and Supplies. Signed on 2004-02-04. Completion date: 2004-03-01.
MIYACHI UNITEK CORPORATION (1820 S MYRTLE AVE; small business) : $356,912 in 6 contractsfrom 2000 to 2005
Contracts for Miscellaneous Welding, Soldering, and Brazing Supplies and Accessories, Electric Arc Welding Equipment, Converters, Electrical, Nonrotating, Miscellaneous Welding Equipment, and moreby Army, NASA, Air Force, Navy, and others Signed by year:2000: $144,000; 2001: $0; 2002: $35,660; 2003: $13,180; 2004: $0; 2005: $164,072; 2006: $0.
Biggest contracts:
$148,650 with Army for Miscellaneous Welding, Soldering, and Brazing Supplies and Accessories. Signed on 2005-05-03. Completion date: 2005-08-05.
$144,000 with NASA for Electric Arc Welding Equipment. Signed on 2000-05-15. Completion date: 2000-07-15.
$35,660 with Air Force for Electric Arc Welding Equipment. Signed on 2002-10-31. Completion date: 2002-12-20.
$13,180 with Navy for Converters, Electrical, Nonrotating. Signed on 2003-07-28. Completion date: 2003-08-29.
INDIGO INNOVATIONS INCORPORATE (215 FOWLER DR; small business) : $199,878 in 2 contractsin 2005
$99,939 with Air Force for Defense Electronics and Communication Equipment -- Applied Research and Exploratory Development (R&D). Signed on 2005-03-08. Completion date: 2005-10-31.
$99,939, same as above.Signed on 2005-02-22. Completion date: 2005-09-30.
TEC-AMERICA, INC (137 W POMONA AVE UNIT C; small business) : $125,856 in 4 contractsfrom 2003 to 2005
$62,928 with Defense Finance and Accounting Service for Maintenance, Repair and Rebuilding of Equipment -- Communication, Detection, and Coherent Radiation Equipment. Taking place in OH. Signed on 2003-10-17. Completion date: 2004-09-30.
$62,928, same as above.Signed on 2004-09-01. Completion date: 2005-09-30.
$8,012 with Navy for Maintenance, Repair and Rebuilding of Equipment -- Office Machines, Text Processing Systems and Visible Record Equipment. Taking place in MD. Signed on 2004-11-30. Completion date: 2005-09-30.
-$8,012, same as above.Signed on 2005-01-13. Completion date: 2005-09-30.
STAYHEALTHY, INC (222 E HUNTINGTON DRIVE SU; small business)
$100,000 with Army for Other Medical -- Operational Systems Development (R&D). Signed on 2001-01-08. Completion date: 2001-08-07.
Top industries in this zip code by the number of employees in 2005:
2005 - 2018 National Fire Incident Reporting System (NFIRS) incidents
Based on the data from the years 2005 - 2018 the average number of fires per year is 72. The highest number of reported fire incidents - 145 took place in 2006, and the least - 2 in 2014. The data has a dropping trend.
When looking into fire subcategories, the most incidents belonged to: Structure Fires (45.5%), and Outside Fires (30.7%).
Fire incident types reported to NFIRS in Zip Code 91016
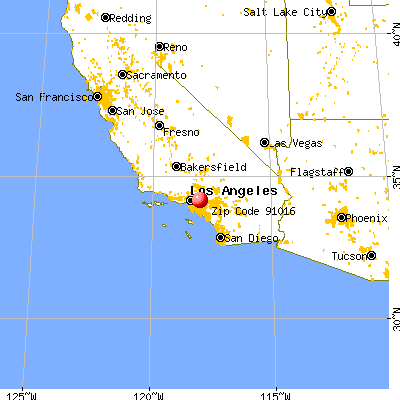


 Nearest zip codes: 91006, 91008, 91010, 91024, 91007, 91706.


 Based on the data from the years 2005 - 2018 the average number of fires per year is 72. The highest number of reported fire incidents - 145 took place in 2006, and the least - 2 in 2014. The data has a dropping trend.
 When looking into fire subcategories, the most incidents belonged to: Structure Fires (45.5%), and Outside Fires (30.7%).