Estimated zip code population in 2022: 4,245 Zip code population in 2010: 3,627 Zip code population in 2000: 3,122
Houses and condos: 1,408 Renter-occupied apartments: 350
% of renters here:
27%
State:
44%
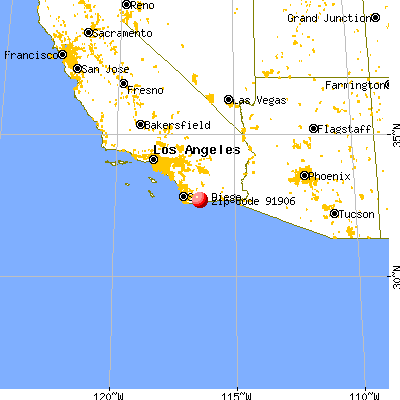
March 2022 cost of living index in zip code 91906: 104.5 (near average, U.S. average is 100)
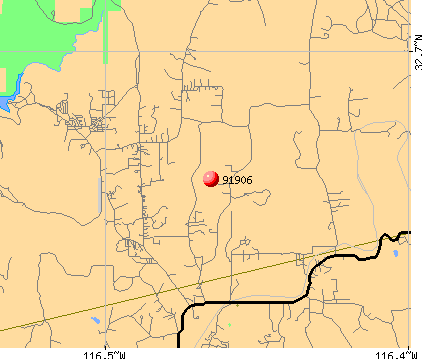
Land area: 105.5 sq. mi. Water area: 0.7 sq. mi.
Population density: 40 people per square mile
(very low).
OSM Map
General Map
Google Map
MSN Map
OSM Map
General Map
Google Map
MSN Map
OSM Map
General Map
Google Map
MSN Map
OSM Map
General Map
Google Map
MSN Map
Please wait while loading the map...
Real estate property taxes paid for housing units in 2022:
This zip code:
0.9% ($2,963)
California:
0.7% ($4,831)
Median real estate property taxes paid for housing units with mortgages in 2022: $3,219 (0.9%) Median real estate property taxes paid for housing units with no mortgage in 2022: $2,515 (0.9%)
Estimated median house/condo value in 2022: $328,795
91906:
$328,795
California:
$715,900
According to our research of California and other state lists, there were 6 registered sex offenders living in 91906 zip code as of May 29, 2024. The ratio of all residents to sex offenders in zip code 91906 is 603 to 1. The ratio of registered sex offenders to all residents in this zip code is near the state average.
Median resident age:
This zip code:
34.3 years
California median age:
37.9 years
Average household size:
This zip code:
3.1 people
California:
2.8 people
Averages for the 2020 tax year for zip code 91906, filed in 2021:
Average Adjusted Gross Income (AGI) in 2020: $58,386 (Individual Income Tax Returns)
Here:
$58,386
State:
$95,910
Salary/wage: $53,385 (reported on 77.6% of returns)
Here:
$53,385
State:
$77,331
(% of AGI for various income ranges: 992.6% for AGIs below $25k, 3357.9% for AGIs $25k-50k, 6152.3% for AGIs $50k-75k, 8768.7% for AGIs $75k-100k, 16276.7% for AGIs $100k-200k)
Taxable interest for individuals: $736 (reported on 27.0% of returns)
This zip code:
$736
California:
$2,294
(% of AGI for various income ranges: 11.6% for AGIs below $25k, 3.3% for AGIs $25k-50k, 8.2% for AGIs $50k-75k, 6.0% for AGIs $75k-100k, 23.3% for AGIs $100k-200k)
Ordinary dividends: $1,550 (reported on 6.9% of returns)
Here:
$1,550
State:
$10,949
(% of AGI for various income ranges: 11.1% for AGIs below $25k, 25.9% for AGIs $50k-75k, 58.0% for AGIs $100k-200k)
Net capital gain/loss in AGI: +$16,655 (reported on 6.3% of returns)
Here:
+$16,655
State:
+$49,306
(% of AGI for various income ranges: 1226.0% for AGIs $100k-200k)
Profit/loss from business: +$9,700 (reported on 13.2% of returns)
Here:
+$9,700
State:
+$15,671
(% of AGI for various income ranges: 137.4% for AGIs below $25k, 137.3% for AGIs $25k-50k, 146.4% for AGIs $50k-75k, 296.0% for AGIs $75k-100k, 326.7% for AGIs $100k-200k)
Taxable individual retirement arrangement distribution: $11,371 (reported on 4.0% of returns)
91906:
$11,371
California:
$23,505
(% of AGI for various income ranges: 166.4% for AGIs $25k-50k, 164.7% for AGIs $75k-100k)
Total itemized deductions: $29,722 (reported on 10.3% of returns)
Here:
$29,722
State:
$39,517
(% of AGI for various income ranges: 116.3% for AGIs below $25k, 423.2% for AGIs $50k-75k, 820.0% for AGIs $75k-100k, 1172.7% for AGIs $100k-200k)
Charity contributions: $5,808 (reported on 7.5% of returns)
Here:
$5,808
State:
$12,598
(% of AGI for various income ranges: 23.0% for AGIs $25k-50k, 88.0% for AGIs $75k-100k, 364.7% for AGIs $100k-200k)
Taxes paid: $8,261 (reported on 10.3% of returns)
91906:
$8,261
State:
$8,807
(% of AGI for various income ranges: 26.3% for AGIs below $25k, 109.1% for AGIs $50k-75k, 233.3% for AGIs $75k-100k, 383.3% for AGIs $100k-200k)
Earned income credit: $2,347 (reported on 18.4% of returns)
Here:
$2,347
State:
$2,074
(% of AGI for various income ranges: 118.4% for AGIs below $25k, 91.2% for AGIs $25k-50k)
Percentage of individuals using paid preparers for their 2020 taxes: 93.7%
Here:
94%
State:
92%
(% for various income ranges: 90.7% for AGIs below $25k, 93.2% for AGIs $25k-50k, 96.6% for AGIs $50k-75k, 95.0% for AGIs $75k-100k, 95.7% for AGIs $100k-200k, 100.0% for AGIs over 200k)
Averages for the 2012 tax year for zip code 91906, filed in 2013:
Average Adjusted Gross Income (AGI) in 2012: $47,566 (Individual Income Tax Returns)
Here:
$47,566
State:
$72,726
Salary/wage: $43,389 (reported on 81.2% of returns)
Here:
$43,389
State:
$59,079
(% of AGI for various income ranges: 63.4% for AGIs below $25k, 75.4% for AGIs $25k-50k, 76.9% for AGIs $50k-75k, 80.7% for AGIs $75k-100k, 71.0% for AGIs $100k-200k)
Taxable interest for individuals: $373 (reported on 30.8% of returns)
This zip code:
$373
California:
$2,146
(% of AGI for various income ranges: 1.1% for AGIs below $25k, 0.1% for AGIs $25k-50k, 0.2% for AGIs $50k-75k, 0.2% for AGIs $100k-200k)
Ordinary dividends: $1,742 (reported on 9.0% of returns)
Here:
$1,742
State:
$9,308
(% of AGI for various income ranges: 0.6% for AGIs below $25k, 0.2% for AGIs $25k-50k, 0.5% for AGIs $50k-75k, 0.2% for AGIs $75k-100k, 0.3% for AGIs $100k-200k)
Net capital gain/loss in AGI: +$1,036 (reported on 8.3% of returns)
Here:
+$1,036
State:
+$30,460
(% of AGI for various income ranges: 0.4% for AGIs $50k-75k, 0.4% for AGIs $100k-200k)
Profit/loss from business: +$4,100 (reported on 14.3% of returns)
Here:
+$4,100
State:
+$17,064
(% of AGI for various income ranges: 9.2% for AGIs below $25k, 1.5% for AGIs $25k-50k, 0.4% for AGIs $50k-75k)
Taxable individual retirement arrangement distribution: $12,400 (reported on 6.0% of returns)
91906:
$12,400
California:
$19,557
(% of AGI for various income ranges: 3.9% for AGIs below $25k, 2.0% for AGIs $50k-75k, 4.2% for AGIs $75k-100k)
Total itemized deductions: $21,367 (26% of AGI, reported on 33.8% of returns)
Here:
$21,367
State:
$34,004
Here:
25.8% of AGI
State:
22.7% of AGI
(% of AGI for various income ranges: 6.3% for AGIs below $25k, 11.4% for AGIs $25k-50k, 16.4% for AGIs $50k-75k, 18.5% for AGIs $75k-100k, 17.7% for AGIs $100k-200k)
Charity contributions: $2,264 (reported on 24.8% of returns)
Here:
$2,264
State:
$4,659
(% of AGI for various income ranges: 0.8% for AGIs $25k-50k, 1.2% for AGIs $50k-75k, 1.4% for AGIs $75k-100k, 1.7% for AGIs $100k-200k)
Taxes paid: $6,387 (reported on 33.8% of returns)
91906:
$6,387
State:
$14,448
(% of AGI for various income ranges: 1.2% for AGIs below $25k, 2.6% for AGIs $25k-50k, 4.0% for AGIs $50k-75k, 5.1% for AGIs $75k-100k, 6.9% for AGIs $100k-200k)
Earned income credit: $2,225 (reported on 24.1% of returns)
Here:
$2,225
State:
$2,286
(% of AGI for various income ranges: 8.2% for AGIs below $25k, 1.5% for AGIs $25k-50k)
Percentage of individuals using paid preparers for their 2012 taxes: 63.2%
Here:
63%
State:
64%
(% for various income ranges: 58.8% for AGIs below $25k, 65.7% for AGIs $25k-50k, 65.0% for AGIs $50k-75k, 61.5% for AGIs $75k-100k, 71.4% for AGIs $100k-200k)
Averages for the 2004 tax year for zip code 91906, filed in 2005:
Average Adjusted Gross Income (AGI) in 2004: $42,434 (Individual Income Tax Returns)
Here:
$42,434
State:
$58,600
Salary/wage: $41,041 (reported on 81.9% of returns)
Here:
$41,041
State:
$49,455
(% of AGI for various income ranges: 126.7% for AGIs below $10k, 70.6% for AGIs $10k-25k, 81.1% for AGIs $25k-50k, 83.0% for AGIs $50k-75k, 87.7% for AGIs $75k-100k, 67.3% for AGIs over 100k)
Taxable interest for individuals: $807 (reported on 40.7% of returns)
This zip code:
$807
California:
$2,365
(% of AGI for various income ranges: 2.3% for AGIs below $10k, 1.5% for AGIs $10k-25k, 0.9% for AGIs $25k-50k, 0.4% for AGIs $50k-75k, 0.2% for AGIs $75k-100k, 1.2% for AGIs over 100k)
Taxable dividends: $836 (reported on 11.4% of returns)
Here:
$836
State:
$4,746
(% of AGI for various income ranges: 6.0% for AGIs below $10k, 0.5% for AGIs $10k-25k, 0.2% for AGIs $25k-50k, 0.2% for AGIs $50k-75k, 0.0% for AGIs $75k-100k, 0.1% for AGIs over 100k)
Net capital gain/loss: +$9,650 (reported on 10.4% of returns)
Here:
+$9,650
State:
+$23,418
(% of AGI for various income ranges: 14.9% for AGIs below $10k, -0.3% for AGIs $10k-25k, 0.2% for AGIs $25k-50k, -0.1% for AGIs $50k-75k, 0.2% for AGIs $75k-100k, 10.3% for AGIs over 100k)
Profit/loss from business: +$4,413 (reported on 13.3% of returns)
Here:
+$4,413
State:
+$16,826
(% of AGI for various income ranges: 15.8% for AGIs below $10k, 5.2% for AGIs $10k-25k, -0.2% for AGIs $25k-50k, 2.5% for AGIs $50k-75k, 0.8% for AGIs $75k-100k, -0.3% for AGIs over 100k)
IRA payment deduction: $2,500 (reported on 1.1% of returns)
91906:
$2,500
California:
$3,192
Total itemized deductions: $20,635 (29% of AGI, reported on 37.5% of returns)
Here:
$20,635
State:
$28,113
Here:
29.3% of AGI
State:
25.3% of AGI
(% of AGI for various income ranges: 12.7% for AGIs $10k-25k, 14.4% for AGIs $25k-50k, 20.1% for AGIs $50k-75k, 24.4% for AGIs $75k-100k, 18.5% for AGIs over 100k)
Charity contributions deductions: $2,134 (3% of AGI, reported on 33.1% of returns)
Here:
$2,134
State:
$3,923
Here:
3.0% of AGI
State:
3.3% of AGI
(% of AGI for various income ranges: 0.6% for AGIs $10k-25k, 1.2% for AGIs $25k-50k, 1.8% for AGIs $50k-75k, 2.2% for AGIs $75k-100k, 2.1% for AGIs over 100k)
Total tax: $4,916 (reported on 76.4% of returns)
91906:
$4,916
State:
$10,761
(% of AGI for various income ranges: 6.0% for AGIs below $10k, 4.0% for AGIs $10k-25k, 6.1% for AGIs $25k-50k, 7.7% for AGIs $50k-75k, 9.3% for AGIs $75k-100k, 15.3% for AGIs over 100k)
Earned income credit: $1,736 (reported on 15.8% of returns)
Here:
$1,736
State:
$1,763
Percentage of individuals using paid preparers for their 2004 taxes: 64.1%
Here:
64%
State:
66%
(% for various income ranges: 47.1% for AGIs below $10k, 66.9% for AGIs $10k-25k, 62.1% for AGIs $25k-50k, 67.0% for AGIs $50k-75k, 71.0% for AGIs $75k-100k, 81.5% for AGIs over 100k)
Household received Food Stamps/SNAP in the past 12 months: 174 Household did not receive Food Stamps/SNAP in the past 12 months: 1,129
Women who had a birth in the past 12 months: 23 (17 now married, 6 unmarried) Women who did not have a birth in the past 12 months: 608 (484 now married, 114 unmarried)
Housing units in zip code 91906 with a mortgage: 587 (30 second mortgage, 19 both second mortgage and home equity loan) Houses without a mortgage: 32
Median monthly owner costs for units with a mortgage: $1,935 Median monthly owner costs for units without a mortgage: $610
Residents with income below the poverty level in 2022:
This zip code:
26.9%
Whole state:
12.2%
Residents with income below 50% of the poverty level in 2022:
This zip code:
19.3%
Whole state:
6.2%
Median number of rooms in houses and condos:
Here:
5.5
State:
6.0
Median number of rooms in apartments:
Here:
5.1
State:
3.9
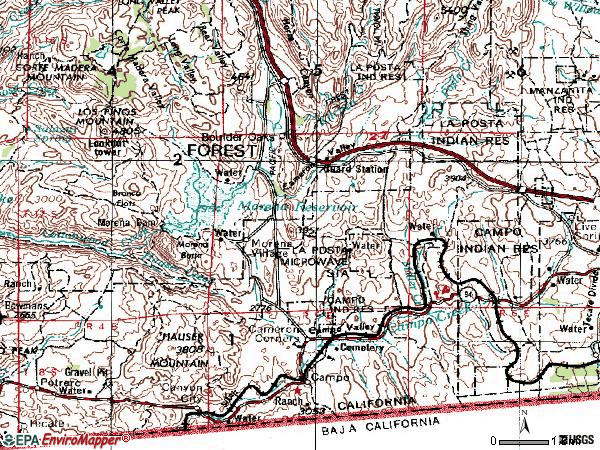
Notable locations in this zip code not listed on our city pages
Notable locations in zip code 91906: Lake Morena Campground (A), Lake Morena Picnic Site (B), Boulder Oaks Campground (C), Boulder Oaks Trailhead (D), Camp Morena (E), Clover Flat Pit (F), Campo Forest Fire Station (G), Morena Conservation Camp (H), Miller Ranch (I), Castle Rock Ranch (J), Curro Ranch (K), La Posta Microwave Station (L), La Posta Service (M), La Posta Ranch (N), San Diego Railroad Museum (O), Campo Branch San Diego County Library (P), California Department of Forestry and Fire Protection Station 42 - Lake Morena (Q), Campo Volunteer Fire Department Station 46 (R), Campo Reservation Fire Protection District Station 65 (S), California Department of Forestry and Fire Protection Station 40 Campo (T). Display/hide their locations on the map
In group quarters: 216 (-1 institutionalized population)
Size of family households: 287 2-persons, 199 3-persons, 183 4-persons, 86 5-persons, 126 6-persons, 50 7-or-more-persons
Size of nonfamily households: 290 1-person, 75 2-persons
918 married couples with children.
167 single-parent households (24 men, 143 women).
74.0% of residents of 91906 zip code speak English at home.
24.3% of residents speak Spanish at home (39% very well, 26% well, 32% not well, 3% not at all).
1.1% of residents speak other Indo-European language at home (55% very well, 45% well).
0.3% of residents speak Asian or Pacific Island language at home (100% very well).
0.4% of residents speak other language at home (100% very well).
Foreign born population: 450 (10.6%) (34.2% of them are naturalized citizens)
This zip code:
10.6%
Whole state:
26.7%
88%Honduras
8%Romania
2%Bhutan
14%German
4%Swedish
4%American
3%English
2%Irish
2%Scottish
1%Russian
Year of entry for the foreign-born population
3142010 or later
282000 to 2009
321990 to 1999
160Before 1990
Facilities with environmental interests located in this zip code:
HILLSIDE JR/SR HIGH (ALT) (31360 HWY. 94 in CAMPO, CA)
(National Center for Education Statistics) - STATE ID-3730991 Organizations: MOUNTAIN EMPIRE UNIFIED (SCHOOL DISTRICT)
CAMPO ELEMENTARY (1654 BUCKMAN SPRINGS ROAD in CAMPO, CA)
(National Center for Education Statistics) - STATE ID-6038681 Organizations: MOUNTAIN EMPIRE UNIFIED (SCHOOL DISTRICT)
CAMPO HIGH (CONT.) (31360 HWY. 94 in CAMPO, CA)
(National Center for Education Statistics) - STATE ID-3730934 Organizations: MOUNTAIN EMPIRE UNIFIED (SCHOOL DISTRICT)
CALIFORNIA DEPT OF TRANS (RTE 94 KP 62 TO KP 105 in CAMPO, CA)
Large Quantity Generators, more that 1000 kg of hazardous waste/month (Resource Conservation and Recovery Act (tracking hazardous waste)) - notification
CAMPO TRANS STATION (1515 BUCKMAN SPRINGS RD in CAMPO, CA)
CRITERIA AND HAZARDOUS AIR POLLUTANT INVENTORY (Inventory of air pollution sources) Small Quantity Generators, between 100 kg and 1000 kg of hazardous waste/month (Resource Conservation and Recovery Act (tracking hazardous waste)) - notification Business SIC classification: REFUSE SYSTEMS Business NAICS classification: SOLID WASTE LANDFILL. Organizations: RAMONA LANFILL INC (CONTACT/OWNER)
MORENA MARKET & GAS (29801 OAK DR in CAMPO, CA)
CRITERIA AND HAZARDOUS AIR POLLUTANT INVENTORY (Inventory of air pollution sources) Business SIC classification: GASOLINE SERVICE STATIONS
CAMERON CORNER CONVENIENCE (31484 HY 94 in CAMPO, CA)
CRITERIA AND HAZARDOUS AIR POLLUTANT INVENTORY (Inventory of air pollution sources) Business SIC classification: GASOLINE SERVICE STATIONS
Housing units lacking complete plumbing facilities: 4.4% Housing units lacking complete kitchen facilities: 6.0%
53.3%Bottled, tank, or LP gas
20.3%Wood
15.8%Electricity
5.4%Utility gas
3.6%No fuel used
1.2%Solar energy
0.6%Other fuel
Population in 1990: 2,657. Population change in the 1990s: +465 (+17.5%).
Place of birth for U.S.-born residents:
This state: 2,960
Northeast: 104
Midwest: 251
South: 164
West: 250
52% of the 91906 zip code residents lived in the same house 5 years ago. Out of people who lived in different houses, 73% lived in this county. Out of people who lived in different counties, 50% lived in California.
97% of the 91906 zip code residents lived in the same house 1 year ago. Out of people who lived in different houses, 51% moved from this county. Out of people who lived in different houses, 14% moved from different county within same state. Out of people who lived in different houses, 46% moved from different state.
Private vs. public school enrollment:
Students in private schools in grades 1 to 8 (elementary and middle school): 41
Here:
7.9%
California:
10.5%
Students in private schools in grades 9 to 12 (high school): 9
Here:
2.8%
California:
8.5%
Students in private undergraduate colleges: 21
Here:
17.6%
California:
15.9%
Occupation by median earnings in the past 12 months ($)
116,155Computer and mathematical occupations
105,362Installation, maintenance, and repair occupations
100,265Life, physical, and social science occupations
60,008Business and financial operations occupations
57,119Management occupations
50,960Sales and related occupations
Companies with federal contracts located in this zip code (CAMPO, CA):
CAMPO ENTERPRISES (995 C PARKER RD) 2 employees, $200000 revenue: $171,000 in 7 contractsfrom 1999 to 2002
Contracts for Lease or Rental of Facilities -- Parking Facilities Conservation, Lease or Rental of Facilities -- Office Buildings by Immigration and Naturalization Service Signed by year:2000: $43,000; 2001: $42,000; 2002: $44,000; 2003: $0; 2004: $0; 2005: $0; 2006: $0.
Biggest contracts:
$44,000 with Immigration and Naturalization Service for Lease or Rental of Facilities -- Parking Facilities Conservation. Signed on 2002-10-15. Completion date: 2003-09-15.
$43,000 with Immigration and Naturalization Service for Lease or Rental of Facilities -- Office Buildings. Signed on 2000-10-15. Completion date: 2001-09-15.
$42,000 with Immigration and Naturalization Service for Lease or Rental of Facilities -- Parking Facilities Conservation. Signed on 2001-10-15. Completion date: 2002-09-15.
$42,000, same as above.Signed on 1999-10-15. Completion date: 2000-09-15.
PEK PRODUCTS (995 PARKER RD STE C; small business) 4 employees, $500000 revenue. Veteran Owned Business: $63,887 in 38 contractsfrom 2002 to 2006
Contracts for Individual Equipment by Navy, Federal Supply Service Signed by year:2000: $0; 2001: $0; 2002: $28,864; 2003: $15,355; 2004: $4,784; 2005: $9,497; 2006: $5,387.
Biggest contracts:
$28,248 with Navy for Individual Equipment. Signed on 2002-09-25. Completion date: 2002-11-01.
$5,400 with Federal Supply Service for Individual Equipment. Signed on 2003-04-15. Completion date: 2003-05-15.
$2,824, same as above.Signed on 2005-04-21. Completion date: 2005-05-24.
$2,700, same as above.Signed on 2003-04-15. Completion date: 2003-05-15.
GT AEROSPACE (33212 SHOCKEY TRUCK TRAIL; small business)
$25,104 with Defense Logistics Agency for Engine Cooling System Components, Nonaircraft. Signed on 2000-04-26. Completion date: 2000-10-05.
MARYLIN DOBYAN (1075 MEANWHILE RANCH RD; small business) : $17,376 in 2 contractsfrom 2004 to 2005
$8,896 with U.S. Special Operations Command for Custodial Janitorial Services. Signed on 2005-10-01. Completion date: 2006-09-30.
$8,480 with Department of Defense for Custodial Janitorial Services. Signed on 2004-10-01. Completion date: 2004-10-01.
Top industries in this zip code by the number of employees in 2005:
Detailed PMIC statistics for the following Tracts:0211.00
2005 - 2018 National Fire Incident Reporting System (NFIRS) incidents
According to the data from the years 2005 - 2018 the average number of fires per year is 18. The highest number of reported fire incidents - 35 took place in 2009, and the least - 1 in 2005. The data has an increasing trend.
When looking into fire subcategories, the most incidents belonged to: Outside Fires (60.2%), and Structure Fires (18.7%).
Fire incident types reported to NFIRS in Zip Code 91906


 Nearest zip codes: 91962, 91963, 91905, 91980, 91948, 91931.


 According to the data from the years 2005 - 2018 the average number of fires per year is 18. The highest number of reported fire incidents - 35 took place in 2009, and the least - 1 in 2005. The data has an increasing trend.
 When looking into fire subcategories, the most incidents belonged to: Outside Fires (60.2%), and Structure Fires (18.7%).