Estimated zip code population in 2022: 9,242 Zip code population in 2010: 8,624 Zip code population in 2000: 8,742
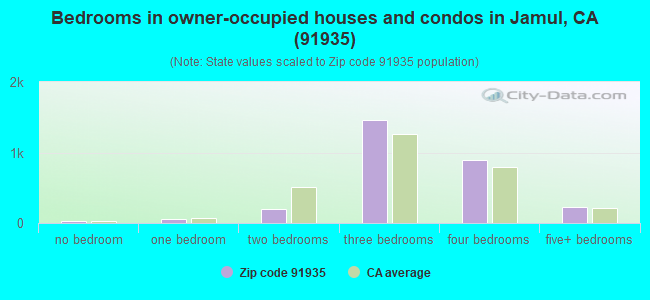
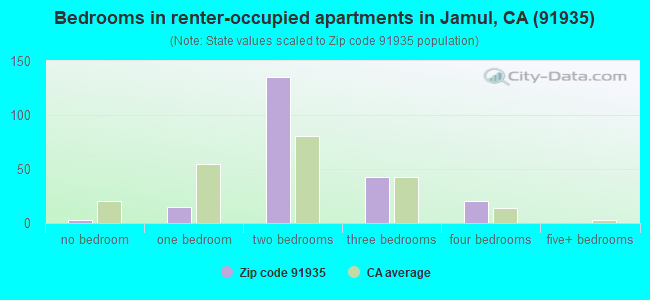
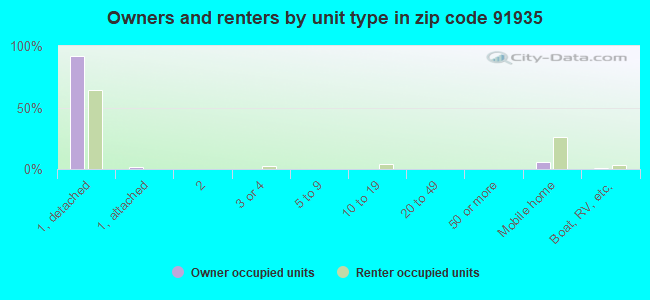
Houses and condos: 3,222 Renter-occupied apartments: 217
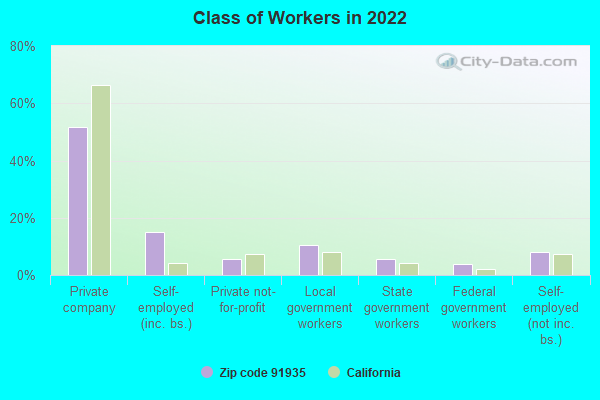
% of renters here:
7%
State:
44%
March 2022 cost of living index in zip code 91935: 106.3 (more than average, U.S. average is 100)
Land area: 96.6 sq. mi. Water area: 0.6 sq. mi.
Population density: 96 people per square mile
(very low).
OSM Map
General Map
Google Map
MSN Map
OSM Map
General Map
Google Map
MSN Map
OSM Map
General Map
Google Map
MSN Map
OSM Map
General Map
Google Map
MSN Map
Please wait while loading the map...
Real estate property taxes paid for housing units in 2022:
This zip code:
0.7% ($6,289)
California:
0.7% ($4,831)
Median real estate property taxes paid for housing units with mortgages in 2022: $6,696 (0.7%) Median real estate property taxes paid for housing units with no mortgage in 2022: $5,188 (0.7%)
Estimated median house/condo value in 2022: $861,512
91935:
$861,512
California:
$715,900
According to our research of California and other state lists, there were 8 registered sex offenders living in 91935 zip code as of May 28, 2024. The ratio of all residents to sex offenders in zip code 91935 is 1,058 to 1. The ratio of registered sex offenders to all residents in this zip code is lower than the state average.
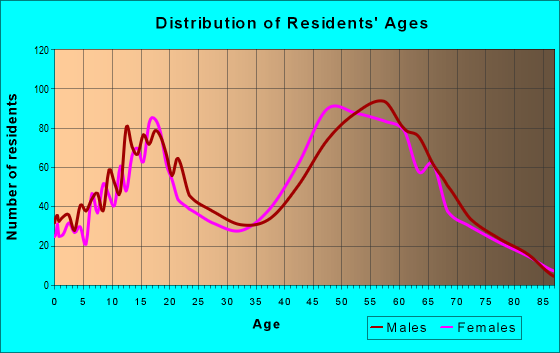
Median resident age:
This zip code:
53.0 years
California median age:
37.9 years
Average household size:
This zip code:
3.0 people
California:
2.8 people
Averages for the 2020 tax year for zip code 91935, filed in 2021:
Average Adjusted Gross Income (AGI) in 2020: $110,415 (Individual Income Tax Returns)
Here:
$110,415
State:
$95,910
Salary/wage: $77,138 (reported on 74.1% of returns)
Here:
$77,138
State:
$77,331
(% of AGI for various income ranges: 1275.7% for AGIs below $25k, 3536.0% for AGIs $25k-50k, 6791.7% for AGIs $50k-75k, 9665.2% for AGIs $75k-100k, 17459.4% for AGIs $100k-200k, 77986.2% for AGIs over 200k)
Taxable interest for individuals: $1,803 (reported on 46.9% of returns)
This zip code:
$1,803
California:
$2,294
(% of AGI for various income ranges: 23.7% for AGIs below $25k, 59.0% for AGIs $25k-50k, 55.0% for AGIs $50k-75k, 80.4% for AGIs $75k-100k, 235.0% for AGIs $100k-200k, 1425.4% for AGIs over 200k)
Ordinary dividends: $7,048 (reported on 22.7% of returns)
Here:
$7,048
State:
$10,949
(% of AGI for various income ranges: 35.7% for AGIs below $25k, 74.8% for AGIs $25k-50k, 124.7% for AGIs $50k-75k, 244.0% for AGIs $75k-100k, 399.2% for AGIs $100k-200k, 2852.3% for AGIs over 200k)
Net capital gain/loss in AGI: +$39,783 (reported on 22.5% of returns)
Here:
+$39,783
State:
+$49,306
(% of AGI for various income ranges: 21.1% for AGIs below $25k, 57.7% for AGIs $25k-50k, 145.8% for AGIs $50k-75k, 341.2% for AGIs $75k-100k, 754.6% for AGIs $100k-200k, 27592.3% for AGIs over 200k)
Profit/loss from business: +$15,758 (reported on 19.9% of returns)
Here:
+$15,758
State:
+$15,671
(% of AGI for various income ranges: 172.5% for AGIs below $25k, 333.3% for AGIs $25k-50k, 373.3% for AGIs $50k-75k, 544.4% for AGIs $75k-100k, 358.8% for AGIs $100k-200k, 5212.3% for AGIs over 200k)
Taxable individual retirement arrangement distribution: $23,171 (reported on 10.4% of returns)
91935:
$23,171
California:
$23,505
(% of AGI for various income ranges: 50.0% for AGIs below $25k, 129.0% for AGIs $25k-50k, 326.4% for AGIs $50k-75k, 619.2% for AGIs $75k-100k, 931.5% for AGIs $100k-200k, 2137.7% for AGIs over 200k)
Self-employed (Keogh) retirement plans: $39,167 (reported on 0.6% of returns)
91935:
$39,167
California:
$30,163
(% of AGI for various income ranges: 244.8% for AGIs $100k-200k)
Total itemized deductions: $39,232 (reported on 24.2% of returns)
Here:
$39,232
State:
$39,517
(% of AGI for various income ranges: 190.0% for AGIs below $25k, 349.7% for AGIs $25k-50k, 929.7% for AGIs $50k-75k, 1831.6% for AGIs $75k-100k, 2986.9% for AGIs $100k-200k, 13964.6% for AGIs over 200k)
Charity contributions: $8,776 (reported on 19.9% of returns)
Here:
$8,776
State:
$12,598
(% of AGI for various income ranges: 7.3% for AGIs below $25k, 37.7% for AGIs $25k-50k, 101.1% for AGIs $50k-75k, 167.6% for AGIs $75k-100k, 400.2% for AGIs $100k-200k, 3914.6% for AGIs over 200k)
Taxes paid: $9,032 (reported on 24.2% of returns)
91935:
$9,032
State:
$8,807
(% of AGI for various income ranges: 34.4% for AGIs below $25k, 75.2% for AGIs $25k-50k, 223.3% for AGIs $50k-75k, 500.0% for AGIs $75k-100k, 859.2% for AGIs $100k-200k, 2483.8% for AGIs over 200k)
Earned income credit: $1,777 (reported on 10.4% of returns)
Here:
$1,777
State:
$2,074
(% of AGI for various income ranges: 68.3% for AGIs below $25k, 56.8% for AGIs $25k-50k)
Percentage of individuals using paid preparers for their 2020 taxes: 92.0%
Here:
92%
State:
92%
(% for various income ranges: 91.2% for AGIs below $25k, 92.9% for AGIs $25k-50k, 91.5% for AGIs $50k-75k, 93.3% for AGIs $75k-100k, 90.9% for AGIs $100k-200k, 94.0% for AGIs over 200k)
Averages for the 2012 tax year for zip code 91935, filed in 2013:
Average Adjusted Gross Income (AGI) in 2012: $88,362 (Individual Income Tax Returns)
Here:
$88,362
State:
$72,726
Salary/wage: $67,622 (reported on 77.4% of returns)
Here:
$67,622
State:
$59,079
(% of AGI for various income ranges: 70.4% for AGIs below $25k, 69.2% for AGIs $25k-50k, 66.1% for AGIs $50k-75k, 63.7% for AGIs $75k-100k, 68.3% for AGIs $100k-200k, 46.5% for AGIs over 200k)
Taxable interest for individuals: $1,830 (reported on 48.4% of returns)
This zip code:
$1,830
California:
$2,146
(% of AGI for various income ranges: 1.7% for AGIs below $25k, 1.3% for AGIs $25k-50k, 0.9% for AGIs $50k-75k, 1.1% for AGIs $75k-100k, 0.7% for AGIs $100k-200k, 1.1% for AGIs over 200k)
Ordinary dividends: $5,606 (reported on 24.6% of returns)
Here:
$5,606
State:
$9,308
(% of AGI for various income ranges: 2.0% for AGIs below $25k, 1.5% for AGIs $25k-50k, 1.7% for AGIs $50k-75k, 1.5% for AGIs $75k-100k, 0.9% for AGIs $100k-200k, 2.0% for AGIs over 200k)
Net capital gain/loss in AGI: +$25,862 (reported on 22.1% of returns)
Here:
+$25,862
State:
+$30,460
(% of AGI for various income ranges: 0.2% for AGIs below $25k, 0.7% for AGIs $75k-100k, 1.1% for AGIs $100k-200k, 15.5% for AGIs over 200k)
Profit/loss from business: +$21,853 (reported on 20.4% of returns)
Here:
+$21,853
State:
+$17,064
(% of AGI for various income ranges: 10.1% for AGIs below $25k, 7.8% for AGIs $25k-50k, 3.4% for AGIs $50k-75k, 4.0% for AGIs $75k-100k, 3.8% for AGIs $100k-200k, 5.6% for AGIs over 200k)
Taxable individual retirement arrangement distribution: $19,096 (reported on 11.8% of returns)
91935:
$19,096
California:
$19,557
(% of AGI for various income ranges: 4.3% for AGIs below $25k, 2.2% for AGIs $25k-50k, 3.7% for AGIs $50k-75k, 3.0% for AGIs $75k-100k, 3.1% for AGIs $100k-200k, 1.6% for AGIs over 200k)
Self-employment retirement plans: $25,350 (reported on 1.5% of returns)
91935:
$25,350
California:
$24,530
Total itemized deductions: $36,877 (25% of AGI, reported on 48.6% of returns)
Here:
$36,877
State:
$34,004
Here:
24.9% of AGI
State:
22.7% of AGI
(% of AGI for various income ranges: 17.4% for AGIs below $25k, 16.4% for AGIs $25k-50k, 20.6% for AGIs $50k-75k, 24.1% for AGIs $75k-100k, 23.0% for AGIs $100k-200k, 18.2% for AGIs over 200k)
Charity contributions: $4,613 (reported on 41.0% of returns)
Here:
$4,613
State:
$4,659
(% of AGI for various income ranges: 0.9% for AGIs below $25k, 1.1% for AGIs $25k-50k, 1.7% for AGIs $50k-75k, 2.1% for AGIs $75k-100k, 2.2% for AGIs $100k-200k, 2.5% for AGIs over 200k)
Taxes paid: $15,077 (reported on 48.6% of returns)
91935:
$15,077
State:
$14,448
(% of AGI for various income ranges: 3.8% for AGIs below $25k, 3.9% for AGIs $25k-50k, 5.8% for AGIs $50k-75k, 7.3% for AGIs $75k-100k, 8.3% for AGIs $100k-200k, 10.4% for AGIs over 200k)
Earned income credit: $1,906 (reported on 11.5% of returns)
Here:
$1,906
State:
$2,286
(% of AGI for various income ranges: 4.4% for AGIs below $25k, 0.9% for AGIs $25k-50k)
Percentage of individuals using paid preparers for their 2012 taxes: 65.6%
Here:
66%
State:
64%
(% for various income ranges: 56.2% for AGIs below $25k, 61.6% for AGIs $25k-50k, 66.7% for AGIs $50k-75k, 71.7% for AGIs $75k-100k, 74.4% for AGIs $100k-200k, 81.2% for AGIs over 200k)
Averages for the 2004 tax year for zip code 91935, filed in 2005:
Average Adjusted Gross Income (AGI) in 2004: $86,666 (Individual Income Tax Returns)
Here:
$86,666
State:
$58,600
Salary/wage: $62,973 (reported on 79.2% of returns)
Here:
$62,973
State:
$49,455
(% of AGI for various income ranges: 100.4% for AGIs below $10k, 67.7% for AGIs $10k-25k, 70.9% for AGIs $25k-50k, 71.9% for AGIs $50k-75k, 76.5% for AGIs $75k-100k, 50.1% for AGIs over 100k)
Taxable interest for individuals: $2,138 (reported on 59.5% of returns)
This zip code:
$2,138
California:
$2,365
(% of AGI for various income ranges: 4.9% for AGIs below $10k, 2.3% for AGIs $10k-25k, 1.7% for AGIs $25k-50k, 1.9% for AGIs $50k-75k, 1.2% for AGIs $75k-100k, 1.3% for AGIs over 100k)
Taxable dividends: $3,277 (reported on 29.9% of returns)
Here:
$3,277
State:
$4,746
(% of AGI for various income ranges: 4.8% for AGIs below $10k, 2.2% for AGIs $10k-25k, 1.5% for AGIs $25k-50k, 1.8% for AGIs $50k-75k, 1.0% for AGIs $75k-100k, 0.9% for AGIs over 100k)
Net capital gain/loss: +$31,761 (reported on 26.6% of returns)
Here:
+$31,761
State:
+$23,418
(% of AGI for various income ranges: -3.6% for AGIs below $10k, 1.4% for AGIs $10k-25k, 0.5% for AGIs $25k-50k, 0.8% for AGIs $50k-75k, 1.1% for AGIs $75k-100k, 14.0% for AGIs over 100k)
Profit/loss from business: +$21,148 (reported on 22.8% of returns)
Here:
+$21,148
State:
+$16,826
(% of AGI for various income ranges: 9.7% for AGIs below $10k, 12.0% for AGIs $10k-25k, 9.5% for AGIs $25k-50k, 7.8% for AGIs $50k-75k, 4.0% for AGIs $75k-100k, 4.6% for AGIs over 100k)
IRA payment deduction: $3,874 (reported on 3.6% of returns)
91935:
$3,874
California:
$3,192
(% of AGI for various income ranges: 1.2% for AGIs below $10k, 0.4% for AGIs $25k-50k, 0.2% for AGIs $50k-75k, 0.1% for AGIs $75k-100k, 0.1% for AGIs over 100k)
Self-employed pension: $17,308 (reported on 2.7% of returns)
Here:
$17,308
California:
$17,688
Total itemized deductions: $33,432 (23% of AGI, reported on 51.3% of returns)
Here:
$33,432
State:
$28,113
Here:
23.2% of AGI
State:
25.3% of AGI
(% of AGI for various income ranges: 31.6% for AGIs below $10k, 18.5% for AGIs $10k-25k, 20.0% for AGIs $25k-50k, 25.2% for AGIs $50k-75k, 27.6% for AGIs $75k-100k, 17.8% for AGIs over 100k)
Charity contributions deductions: $4,403 (3% of AGI, reported on 45.7% of returns)
Here:
$4,403
State:
$3,923
Here:
2.9% of AGI
State:
3.3% of AGI
(% of AGI for various income ranges: 1.2% for AGIs below $10k, 1.4% for AGIs $10k-25k, 1.6% for AGIs $25k-50k, 2.1% for AGIs $50k-75k, 3.1% for AGIs $75k-100k, 2.4% for AGIs over 100k)
Total tax: $16,831 (reported on 81.3% of returns)
91935:
$16,831
State:
$10,761
(% of AGI for various income ranges: 4.2% for AGIs below $10k, 5.2% for AGIs $10k-25k, 7.3% for AGIs $25k-50k, 8.6% for AGIs $50k-75k, 9.0% for AGIs $75k-100k, 19.5% for AGIs over 100k)
Earned income credit: $1,386 (reported on 8.1% of returns)
Here:
$1,386
State:
$1,763
Percentage of individuals using paid preparers for their 2004 taxes: 67.4%
Here:
67%
State:
66%
(% for various income ranges: 56.7% for AGIs below $10k, 61.2% for AGIs $10k-25k, 64.5% for AGIs $25k-50k, 72.1% for AGIs $50k-75k, 74.4% for AGIs $75k-100k, 77.1% for AGIs over 100k)
Likely homosexual households (counted as self-reported same-sex unmarried-partner households)
Lesbian couples: 0.0% of all households
Gay men: 0.5% of all households
Household received Food Stamps/SNAP in the past 12 months: 281 Household did not receive Food Stamps/SNAP in the past 12 months: 2,772
Women who had a birth in the past 12 months: 172 (164 now married, 7 unmarried) Women who did not have a birth in the past 12 months: 1,308 (645 now married, 656 unmarried)
Housing units in zip code 91935 with a mortgage: 1,933 (243 second mortgage, 7 home equity loan, 211 both second mortgage and home equity loan) Houses without a mortgage: 39
Median monthly owner costs for units with a mortgage: $3,399 Median monthly owner costs for units without a mortgage: $1,081
Residents with income below the poverty level in 2022:
This zip code:
4.8%
Whole state:
12.2%
Residents with income below 50% of the poverty level in 2022:
This zip code:
1.4%
Whole state:
6.2%
Median number of rooms in houses and condos:
Here:
6.8
State:
6.0
Median number of rooms in apartments:
Here:
4.7
State:
3.9
Notable locations in this zip code not listed on our city pages
Notable locations in zip code 91935: Ivanhoe Ranch (A), Honey Springs Ranch (B), Bratton Ranch (C), Skyline Ranch Campground (D), Diamond Jack Campground (E), Skyline Ranch (F), Sloan Ranch (G), Mountain Shadows Ranch (H), Daley Ranch (I), Harper Ranch (J), Mellor Ranch (K), Walker Ranch (L), San Diego Rural Fire Protection District Station 36 Jamul (M), California Department of Forestry and Fire Protection Station 33 - Lawson Valley (N), California Department of Forestry and Fire Protection Station 34 - Lee Valley (O), California Department of Forestry and Fire Protection Station 37 - Deerhorn Valley (P), California Department of Forestry and Fire Protection Station 36 Jamul (Q), California Department of Forestry and Fire Protection Station 32 - Lyons Valley (R). Display/hide their locations on the map
Churches in zip code 91935 include: Indian Church (A), Jamul Community Church (B), Saint Pius X Catholic Church (C). Display/hide their locations on the map
1,400 married couples with children.
83 single-parent households (33 men, 50 women).
75.8% of residents of 91935 zip code speak English at home.
20.4% of residents speak Spanish at home (65% very well, 26% well, 5% not well, 4% not at all).
0.4% of residents speak other Indo-European language at home (100% very well).
1.5% of residents speak Asian or Pacific Island language at home (40% very well, 45% well, 15% not well).
2.3% of residents speak other language at home (89% very well, 11% well).
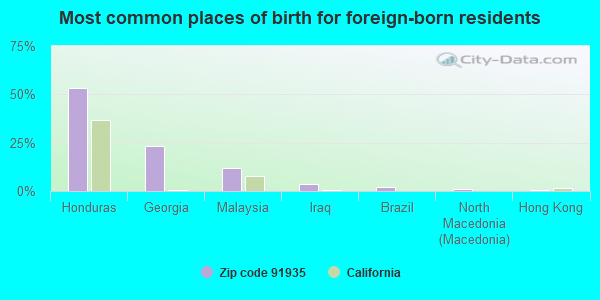
Foreign born population: 1,206 (13.0%) (76.2% of them are naturalized citizens)
This zip code:
13.0%
Whole state:
26.7%
65%Honduras
17%Georgia
7%Malaysia
2%France
2%Brazil
1%North Macedonia (Macedonia)
1%Thailand
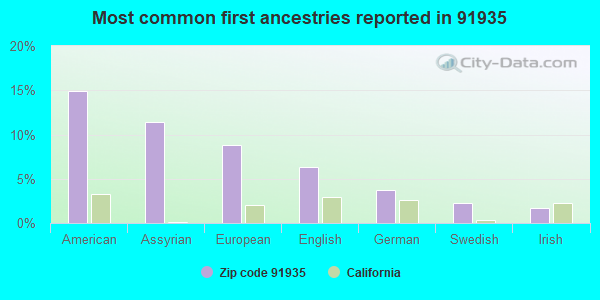
12%Assyrian
7%American
6%English
5%European
5%German
3%Swedish
2%Irish
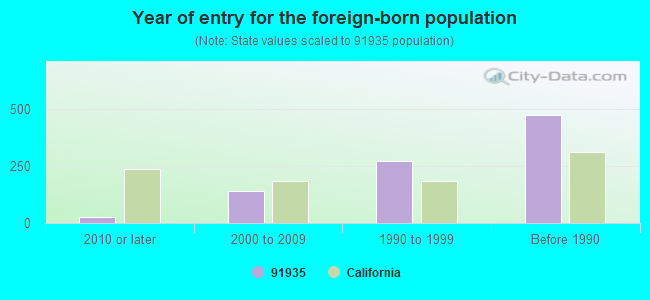
Year of entry for the foreign-born population
1642010 or later
1932000 to 2009
3001990 to 1999
658Before 1990
Facilities with environmental interests located in this zip code:
GREATER SAN DIEGO ACADEMY (14581 LYONS VALLEY ROAD in JAMUL, CA)
(National Center for Education Statistics) - STATE ID-6117303 Organizations: JAMUL-DULZURA UNION ELEMENTARY (SCHOOL DISTRICT)
JAMUL INTERMEDIATE (14545 LYONS VALLEY ROAD in JAMUL, CA)
(National Center for Education Statistics) - STATE ID-6112205 Organizations: JAMUL-DULZURA UNION ELEMENTARY (SCHOOL DISTRICT)
JAMUL PRIMARY (14567 LYONS VALLEY ROAD in JAMUL, CA)
(National Center for Education Statistics) - STATE ID-6038319 Organizations: JAMUL-DULZURA UNION ELEMENTARY (SCHOOL DISTRICT)
JAMMAL, TALAL BAKRI - JAMUL RANCH (14726 CAMPO ROAD in JAMUL, CA)
National Pollutant Discharge Elimination System NON-MAJOR (Tracking pollutant discharge elimination systems) - permit
HOUSE OF STEEL (3552 FOWLER CANYON ROAD in JAMUL, CA)
Small Quantity Generators, between 100 kg and 1000 kg of hazardous waste/month (Resource Conservation and Recovery Act (tracking hazardous waste))
JAMUL BURNSITE (JAMUL DR. in JAMUL, CA)
CRITERIA AND HAZARDOUS AIR POLLUTANT INVENTORY (Inventory of air pollution sources) Business SIC classification: REFUSE SYSTEMS Business NAICS classification: SOLID WASTE LANDFILL.
JAMUL CHRISTIAN SCHOOL (P.O. BOX 74 in JAMUL, CA)
COMPLIANCE ACTIVITY (Tracking inspections of insecticide, fungicide, and rodenticide, and toxic substances)
Housing units lacking complete plumbing facilities: 1.8% Housing units lacking complete kitchen facilities: 2.7%
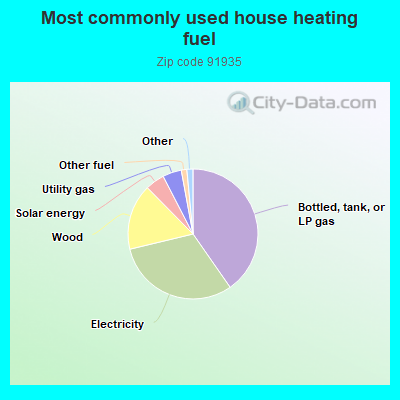
40.4%Bottled, tank, or LP gas
31.0%Electricity
16.4%Wood
4.8%Solar energy
4.7%Utility gas
1.4%Other fuel
0.8%No fuel used
0.7%Fuel oil, kerosene, etc.
Population in 1990: 7,879. Population change in the 1990s: +863 (+11.0%).
Place of birth for U.S.-born residents:
This state: 5,043
Northeast: 982
Midwest: 929
South: 579
West: 303
61% of the 91935 zip code residents lived in the same house 5 years ago. Out of people who lived in different houses, 78% lived in this county. Out of people who lived in different counties, 50% lived in California.
98% of the 91935 zip code residents lived in the same house 1 year ago. Out of people who lived in different houses, 106% moved from this county. Out of people who lived in different houses, 7% moved from different county within same state. Out of people who lived in different houses, 1% moved from different state.
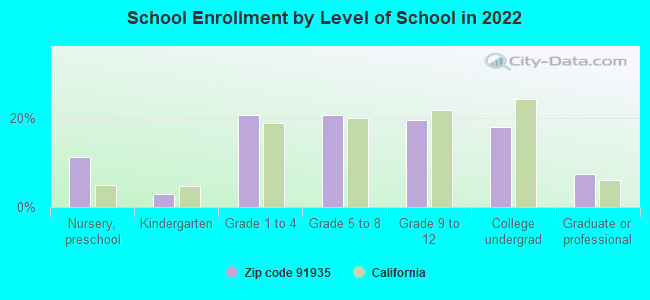
Private vs. public school enrollment:
Students in private schools in grades 1 to 8 (elementary and middle school): 301
Here:
36.0%
California:
10.5%
Students in private schools in grades 9 to 12 (high school): 91
Here:
23.9%
California:
8.5%
Students in private undergraduate colleges: 35
Here:
10.1%
California:
15.9%
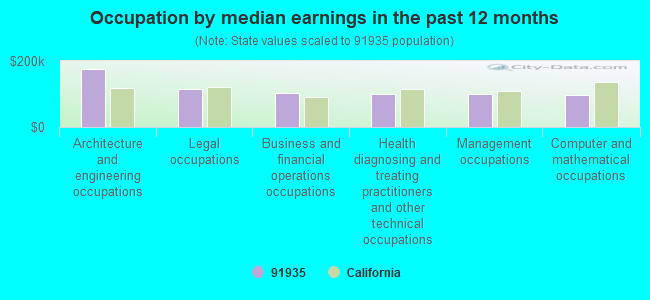
Occupation by median earnings in the past 12 months ($)
175,663Architecture and engineering occupations
113,792Legal occupations
104,519Business and financial operations occupations
99,625Health diagnosing and treating practitioners and other technical occupations
99,572Management occupations
98,309Computer and mathematical occupations
Companies with federal contracts located in this zip code (JAMUL, CA):
AIR ADVENTURES SKYDIVING INC (13531 OTAY LAKES RD; small business) : $3,891,588 in 39 contractsfrom 2003 to 2006
Contracts for Other Education and Training Services, Education Services, Parachutes; Aerial Pick Up, Delivery, Recovery Systems; and Cargo Tie Down Equipment, Training Aids, and moreby Navy, U.S. Special Operations Command, Department of Defense Signed by year:2000: $0; 2001: $0; 2002: $0; 2003: $1,995,432; 2004: $549,998; 2005: $1,301,166; 2006: $44,992.
Biggest contracts:
$1,500,420 with Navy for Other Education and Training Services. Signed on 2003-01-15. Completion date: 2004-03-31.
$449,438, same as above.Signed on 2005-07-07. Completion date: 2005-10-31.
$308,531, same as above.Signed on 2003-10-30. Completion date: 2004-03-31.
$143,981, same as above.Signed on 2003-11-13. Completion date: 2004-01-30.
KAREN CONNOLLY (3023 SCHLEE CANYON RD; small business) : $123,376 in 17 contractsfrom 1999 to 2006
Contracts for Valves, Nonpowered, Pipe, Tube and Rigid Tubing, Miscellaneous Special Industry Machinery, Hose and Flexible Tubing, and moreby Navy Signed by year:2000: $0; 2001: $0; 2002: $0; 2003: $38,793; 2004: $37,182; 2005: $18,564; 2006: $187.
Biggest contracts:
$28,650 with Navy for Valves, Nonpowered. Signed on 1999-12-14. Completion date: 2000-04-21.
$21,525 with Navy for Pipe, Tube and Rigid Tubing. Signed on 2004-10-28. Completion date: 2004-11-02.
$11,920 with Navy for Miscellaneous Special Industry Machinery. Signed on 2003-07-31. Completion date: 2003-08-15.
$10,965 with Navy for Hose and Flexible Tubing. Signed on 2005-12-07. Completion date: 2005-12-21.
ARCTIC CONTAINERS (18052 BUNNY DR; small business) : $14,388 in 4 contractsfrom 2003 to 2005
$7,488 with Navy for Refrigeration Equipment. Signed on 2003-04-23. Completion date: 2003-09-30.
$6,900 with Navy for Laundry and Dry Cleaning Equipment. Signed on 2003-06-09. Completion date: 2003-08-07.
$5,566 with Navy for Lease or Rental of Equipment -- Refrigeration, Air Conditioning, and Air Circulating Equipment. Signed on 2005-06-14. Completion date: 2005-09-15.
-$5,566, same as above.Signed on 2005-06-29. Completion date: 2005-09-15.
SARACEN SERVICES, INC (13531 OTAY LAKES RD; small business)
$10,000 with Navy for Parachutes; Aerial Pick Up, Delivery, Recovery Systems; and Cargo Tie Down Equipment. Signed on 2006-05-25. Completion date: 2006-05-31.
DEREK WILSON (3588 FOWLER CANYON RD; small business) : $5,989 in 2 contractsfrom 2004 to 2005
$3,066 with Defense Logistics Agency for Fruits and Vegetables. Signed on 2005-06-08. Completion date: 2005-06-08.
$2,923, same as above.Signed on 2004-12-02. Completion date: 2004-12-02.
Top industries in this zip code by the number of employees in 2005:
Administrative and Support and Waste Management and Remediation Services: Security Guards and Patrol Services (100-249 employees: 1 establishment)
Arts, Entertainment, and Recreation: Golf Courses and Country Clubs (100-249: 1)
Accommodation and Food Services: RV (Recreational Vehicle) Parks and Campgrounds (50-99: 1)
Construction: All Other Specialty Trade Contractors (20-49: 1, 10-19: 1, 5-9: 1, 1-4: 2)
Accommodation and Food Services: Full-Service Restaurants (20-49: 1, 1-4: 1)
Accommodation and Food Services: Recreational and Vacation Camps (except Campgrounds) (20-49: 1)
Construction: Drywall and Insulation Contractors (20-49: 1)
Construction: Tile and Terrazzo Contractors (20-49: 1)
People in group quarters in 2010:
6 people in other noninstitutional facilities
Fatal accident statistics in 2013:
Fatal accident count: 2
Vehicles involved in fatal accidents: 5
Fatal accidents caused by drunken drivers: 1
Fatalities: 2
Persons involved in fatal accidents: 6
Pedestrians involved in fatal accidents: 0
Fatal accident statistics in 2012:
Fatal accident count: 2
Vehicles involved in fatal accidents: 2
Fatal accidents caused by drunken drivers: 2
Fatalities: 2
Persons involved in fatal accidents: 3
Pedestrians involved in fatal accidents: 0
Home Mortgage Disclosure Act Aggregated Statistics For Year 2009 (Based on 2 full and 4 partial tracts)
A) FHA, FSA/RHS & VA Home Purchase Loans
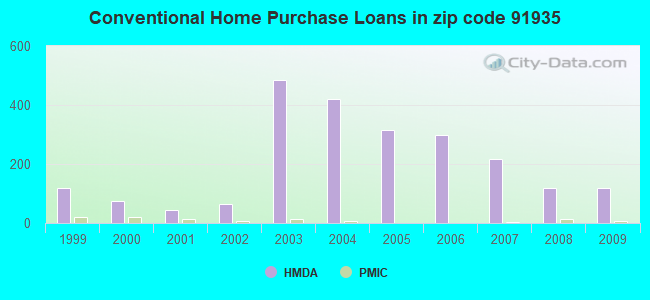
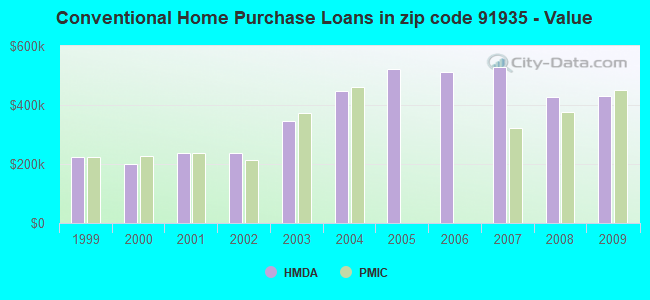
B) Conventional Home Purchase Loans
C) Refinancings
D) Home Improvement Loans
F) Non-occupant Loans on < 5 Family Dwellings (A B C & D)
G) Loans On Manufactured Home Dwelling (A B C & D)
Number
Average Value
Number
Average Value
Number
Average Value
Number
Average Value
Number
Average Value
Number
Average Value
LOANS ORIGINATED
55
$425,711
120
$431,801
401
$329,252
13
$292,631
22
$345,390
11
$258,528
APPLICATIONS APPROVED, NOT ACCEPTED
10
$390,904
18
$476,271
51
$337,245
0
$0
5
$280,714
1
$182,280
APPLICATIONS DENIED
19
$402,517
28
$423,950
149
$379,732
7
$131,010
13
$356,780
11
$235,261
APPLICATIONS WITHDRAWN
19
$444,447
19
$429,534
99
$357,750
4
$103,515
3
$425,800
4
$202,710
FILES CLOSED FOR INCOMPLETENESS
4
$497,488
4
$605,630
26
$442,523
2
$80,530
0
$0
1
$127,990
Aggregated Statistics For Year 2008 (Based on 2 full and 4 partial tracts)
A) FHA, FSA/RHS & VA Home Purchase Loans
B) Conventional Home Purchase Loans
C) Refinancings
D) Home Improvement Loans
F) Non-occupant Loans on < 5 Family Dwellings (A B C & D)
G) Loans On Manufactured Home Dwelling (A B C & D)
Number
Average Value
Number
Average Value
Number
Average Value
Number
Average Value
Number
Average Value
Number
Average Value
LOANS ORIGINATED
20
$464,734
120
$426,458
162
$365,489
11
$170,977
14
$363,199
10
$252,451
APPLICATIONS APPROVED, NOT ACCEPTED
1
$419,190
35
$374,830
49
$485,558
3
$120,437
3
$335,957
6
$173,988
APPLICATIONS DENIED
5
$432,024
67
$545,853
159
$479,493
17
$226,774
17
$344,953
8
$279,128
APPLICATIONS WITHDRAWN
6
$461,672
34
$465,173
63
$390,769
7
$454,364
5
$281,950
1
$261,790
FILES CLOSED FOR INCOMPLETENESS
0
$0
2
$553,130
13
$471,108
5
$225,516
0
$0
0
$0
Aggregated Statistics For Year 2007 (Based on 2 full and 4 partial tracts)
A) FHA, FSA/RHS & VA Home Purchase Loans
B) Conventional Home Purchase Loans
C) Refinancings
D) Home Improvement Loans
F) Non-occupant Loans on < 5 Family Dwellings (A B C & D)
G) Loans On Manufactured Home Dwelling (A B C & D)
Number
Average Value
Number
Average Value
Number
Average Value
Number
Average Value
Number
Average Value
Number
Average Value
LOANS ORIGINATED
2
$271,190
216
$530,177
487
$452,296
64
$324,093
32
$394,937
15
$288,622
APPLICATIONS APPROVED, NOT ACCEPTED
1
$336,450
34
$490,337
127
$473,236
13
$138,958
10
$426,070
8
$260,822
APPLICATIONS DENIED
1
$339,360
123
$523,298
281
$559,363
31
$268,458
20
$508,795
24
$319,341
APPLICATIONS WITHDRAWN
0
$0
46
$561,255
145
$520,235
19
$299,251
13
$520,832
6
$362,393
FILES CLOSED FOR INCOMPLETENESS
0
$0
18
$533,768
51
$369,359
2
$488,225
3
$254,077
1
$344,780
Aggregated Statistics For Year 2006 (Based on 2 full and 4 partial tracts)
B) Conventional Home Purchase Loans
C) Refinancings
D) Home Improvement Loans
F) Non-occupant Loans on < 5 Family Dwellings (A B C & D)
G) Loans On Manufactured Home Dwelling (A B C & D)
Number
Average Value
Number
Average Value
Number
Average Value
Number
Average Value
Number
Average Value
LOANS ORIGINATED
300
$513,475
670
$445,738
76
$323,091
33
$404,710
21
$261,069
APPLICATIONS APPROVED, NOT ACCEPTED
70
$473,804
153
$453,841
22
$305,930
9
$429,922
11
$150,641
APPLICATIONS DENIED
142
$470,279
310
$577,952
40
$237,894
27
$546,917
25
$254,728
APPLICATIONS WITHDRAWN
58
$524,549
245
$485,745
20
$250,776
18
$388,473
8
$222,402
FILES CLOSED FOR INCOMPLETENESS
12
$583,050
51
$435,427
1
$66,140
10
$323,492
1
$79,510
Aggregated Statistics For Year 2005 (Based on 2 full and 4 partial tracts)
A) FHA, FSA/RHS & VA Home Purchase Loans
B) Conventional Home Purchase Loans
C) Refinancings
D) Home Improvement Loans
F) Non-occupant Loans on < 5 Family Dwellings (A B C & D)
G) Loans On Manufactured Home Dwelling (A B C & D)
Number
Average Value
Number
Average Value
Number
Average Value
Number
Average Value
Number
Average Value
Number
Average Value
LOANS ORIGINATED
1
$293,790
315
$523,020
794
$446,337
101
$311,670
43
$472,388
26
$274,692
APPLICATIONS APPROVED, NOT ACCEPTED
0
$0
111
$414,463
139
$480,527
17
$271,183
11
$353,583
6
$210,655
APPLICATIONS DENIED
0
$0
118
$537,873
300
$492,324
46
$372,320
18
$395,828
17
$255,668
APPLICATIONS WITHDRAWN
0
$0
79
$439,233
231
$435,374
14
$477,497
7
$296,106
7
$208,470
FILES CLOSED FOR INCOMPLETENESS
0
$0
23
$453,296
98
$429,855
5
$206,850
5
$226,202
3
$156,767
Aggregated Statistics For Year 2004 (Based on 2 full and 4 partial tracts)
B) Conventional Home Purchase Loans
C) Refinancings
D) Home Improvement Loans
E) Loans on Dwellings For 5+ Families
F) Non-occupant Loans on < 5 Family Dwellings (A B C & D)
G) Loans On Manufactured Home Dwelling (A B C & D)
Number
Average Value
Number
Average Value
Number
Average Value
Number
Average Value
Number
Average Value
Number
Average Value
LOANS ORIGINATED
420
$446,585
927
$370,379
51
$260,379
0
$0
43
$451,807
26
$194,093
APPLICATIONS APPROVED, NOT ACCEPTED
91
$389,328
143
$362,034
15
$278,275
0
$0
8
$359,214
13
$227,652
APPLICATIONS DENIED
161
$475,839
238
$383,230
25
$146,081
1
$824,160
22
$292,040
17
$209,269
APPLICATIONS WITHDRAWN
113
$388,047
269
$342,522
18
$215,095
0
$0
16
$388,688
8
$242,642
FILES CLOSED FOR INCOMPLETENESS
18
$305,949
71
$363,442
6
$401,388
0
$0
5
$315,398
2
$294,275
Aggregated Statistics For Year 2003 (Based on 2 full and 4 partial tracts)
A) FHA, FSA/RHS & VA Home Purchase Loans
B) Conventional Home Purchase Loans
C) Refinancings
D) Home Improvement Loans
F) Non-occupant Loans on < 5 Family Dwellings (A B C & D)
Number
Average Value
Number
Average Value
Number
Average Value
Number
Average Value
Number
Average Value
LOANS ORIGINATED
2
$284,260
484
$346,104
1,848
$286,353
28
$77,061
62
$282,820
APPLICATIONS APPROVED, NOT ACCEPTED
2
$150,065
93
$357,374
243
$295,320
8
$81,858
21
$342,859
APPLICATIONS DENIED
1
$240,460
95
$337,456
395
$279,051
22
$76,750
25
$238,564
APPLICATIONS WITHDRAWN
0
$0
105
$340,433
263
$275,881
7
$107,827
21
$229,313
FILES CLOSED FOR INCOMPLETENESS
0
$0
30
$337,233
68
$288,958
1
$62,010
2
$218,160
Aggregated Statistics For Year 2002 (Based on 2 partial tracts)
A) FHA, FSA/RHS & VA Home Purchase Loans
B) Conventional Home Purchase Loans
C) Refinancings
D) Home Improvement Loans
F) Non-occupant Loans on < 5 Family Dwellings (A B C & D)
Number
Average Value
Number
Average Value
Number
Average Value
Number
Average Value
Number
Average Value
LOANS ORIGINATED
5
$206,718
66
$238,345
275
$214,373
10
$63,994
12
$141,077
APPLICATIONS APPROVED, NOT ACCEPTED
0
$0
12
$261,388
59
$236,862
7
$57,069
4
$397,535
APPLICATIONS DENIED
1
$85,320
25
$207,145
95
$228,938
6
$76,760
3
$172,913
APPLICATIONS WITHDRAWN
1
$232,700
7
$214,143
55
$200,795
5
$84,936
0
$0
FILES CLOSED FOR INCOMPLETENESS
0
$0
7
$196,136
24
$216,463
1
$35,880
4
$247,732
Aggregated Statistics For Year 2001 (Based on 2 partial tracts)
A) FHA, FSA/RHS & VA Home Purchase Loans
B) Conventional Home Purchase Loans
C) Refinancings
D) Home Improvement Loans
F) Non-occupant Loans on < 5 Family Dwellings (A B C & D)
Number
Average Value
Number
Average Value
Number
Average Value
Number
Average Value
Number
Average Value
LOANS ORIGINATED
4
$192,222
44
$237,574
230
$193,848
5
$36,844
3
$148,350
APPLICATIONS APPROVED, NOT ACCEPTED
0
$0
16
$223,069
38
$181,111
3
$22,623
1
$215,250
APPLICATIONS DENIED
0
$0
17
$249,929
79
$182,935
8
$69,448
1
$169,680
APPLICATIONS WITHDRAWN
1
$229,800
11
$193,920
47
$193,239
6
$79,022
1
$215,250
FILES CLOSED FOR INCOMPLETENESS
0
$0
1
$16,480
15
$183,707
2
$125,080
0
$0
Aggregated Statistics For Year 2000 (Based on 2 partial tracts)
A) FHA, FSA/RHS & VA Home Purchase Loans
B) Conventional Home Purchase Loans
C) Refinancings
D) Home Improvement Loans
E) Loans on Dwellings For 5+ Families
F) Non-occupant Loans on < 5 Family Dwellings (A B C & D)
Number
Average Value
Number
Average Value
Number
Average Value
Number
Average Value
Number
Average Value
Number
Average Value
LOANS ORIGINATED
2
$137,200
73
$200,601
69
$163,286
14
$37,953
1
$693,260
0
$0
APPLICATIONS APPROVED, NOT ACCEPTED
1
$216,220
10
$172,783
21
$114,690
4
$39,510
0
$0
1
$151,260
APPLICATIONS DENIED
0
$0
19
$200,044
46
$150,162
3
$30,703
0
$0
4
$99,628
APPLICATIONS WITHDRAWN
1
$195,860
7
$215,667
16
$85,991
4
$24,240
0
$0
2
$25,210
FILES CLOSED FOR INCOMPLETENESS
0
$0
3
$159,013
13
$186,909
0
$0
0
$0
0
$0
Aggregated Statistics For Year 1999 (Based on 2 partial tracts)
A) FHA, FSA/RHS & VA Home Purchase Loans
B) Conventional Home Purchase Loans
C) Refinancings
D) Home Improvement Loans
F) Non-occupant Loans on < 5 Family Dwellings (A B C & D)
2005 - 2018 National Fire Incident Reporting System (NFIRS) incidents
According to the data from the years 2005 - 2018 the average number of fires per year is 40. The highest number of reported fire incidents - 201 took place in 2007, and the least - 8 in 2005. The data has an increasing trend.
When looking into fire subcategories, the most incidents belonged to: Structure Fires (40.2%), and Outside Fires (39.6%).
Fire incident types reported to NFIRS in Zip Code 91935
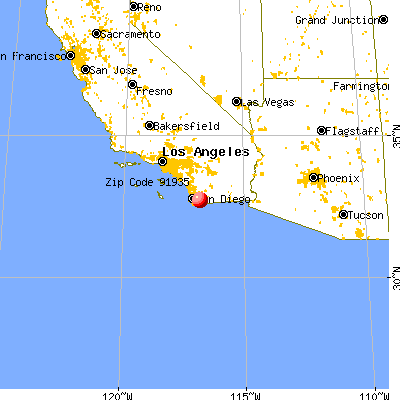


 Nearest zip codes: 92019, 91901, 91917, 92021, 91978, 91914.


 According to the data from the years 2005 - 2018 the average number of fires per year is 40. The highest number of reported fire incidents - 201 took place in 2007, and the least - 8 in 2005. The data has an increasing trend.
 When looking into fire subcategories, the most incidents belonged to: Structure Fires (40.2%), and Outside Fires (39.6%).