Estimated zip code population in 2022: 27,312 Zip code population in 2010: 25,460 Zip code population in 2000: 24,953
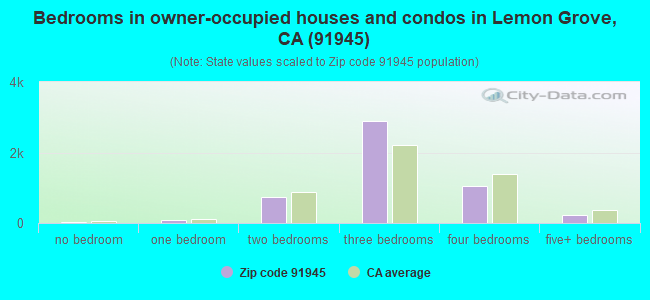
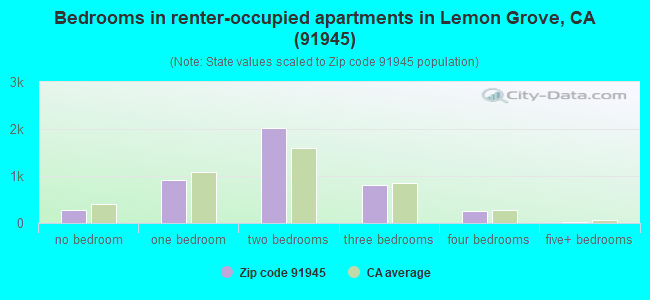
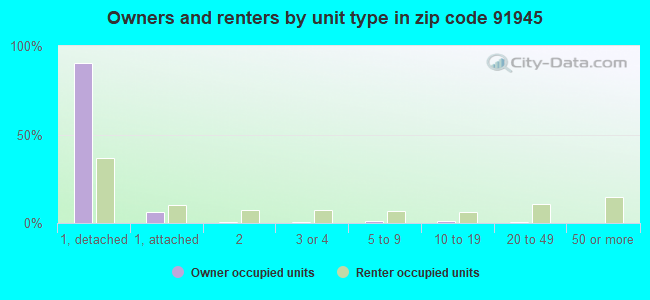
Houses and condos: 9,662 Renter-occupied apartments: 4,288
% of renters here:
46%
State:
44%
March 2022 cost of living index in zip code 91945: 122.2 (high, U.S. average is 100)
Land area: 3.9 sq. mi. Water area: 0.0 sq. mi.
Population density: 6,960 people per square mile
(high).
OSM Map
General Map
Google Map
MSN Map
OSM Map
General Map
Google Map
MSN Map
OSM Map
General Map
Google Map
MSN Map
OSM Map
General Map
Google Map
MSN Map
Please wait while loading the map...
Real estate property taxes paid for housing units in 2022:
This zip code:
0.7% ($4,311)
California:
0.7% ($4,831)
Median real estate property taxes paid for housing units with mortgages in 2022: $4,474 (0.7%) Median real estate property taxes paid for housing units with no mortgage in 2022: $3,775 (0.6%)
Estimated median house/condo value in 2022: $644,234
91945:
$644,234
California:
$715,900
According to our research of California and other state lists, there were 37 registered sex offenders living in 91945 zip code as of May 28, 2024. The ratio of all residents to sex offenders in zip code 91945 is 731 to 1. The ratio of registered sex offenders to all residents in this zip code is near the state average.
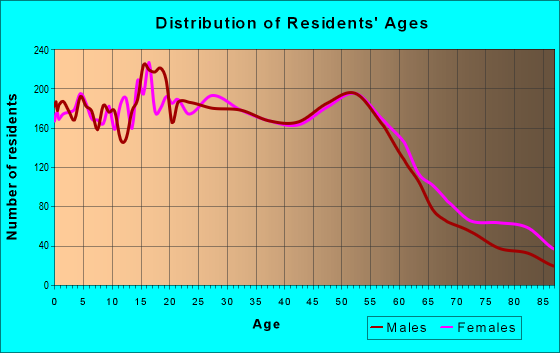
Median resident age:
This zip code:
38.0 years
California median age:
37.9 years
Average household size:
This zip code:
2.9 people
California:
2.8 people
Averages for the 2020 tax year for zip code 91945, filed in 2021:
Average Adjusted Gross Income (AGI) in 2020: $51,594 (Individual Income Tax Returns)
Here:
$51,594
State:
$95,910
Salary/wage: $47,958 (reported on 83.4% of returns)
Here:
$47,958
State:
$77,331
(% of AGI for various income ranges: 1114.5% for AGIs below $25k, 3797.9% for AGIs $25k-50k, 7151.2% for AGIs $50k-75k, 10405.7% for AGIs $75k-100k, 19417.2% for AGIs $100k-200k, 49336.7% for AGIs over 200k)
Taxable interest for individuals: $477 (reported on 28.0% of returns)
This zip code:
$477
California:
$2,294
(% of AGI for various income ranges: 8.0% for AGIs below $25k, 9.7% for AGIs $25k-50k, 24.1% for AGIs $50k-75k, 37.3% for AGIs $75k-100k, 48.5% for AGIs $100k-200k, 270.0% for AGIs over 200k)
Ordinary dividends: $2,233 (reported on 9.3% of returns)
Here:
$2,233
State:
$10,949
(% of AGI for various income ranges: 9.6% for AGIs below $25k, 13.2% for AGIs $25k-50k, 29.4% for AGIs $50k-75k, 28.1% for AGIs $75k-100k, 74.7% for AGIs $100k-200k, 1340.0% for AGIs over 200k)
Net capital gain/loss in AGI: +$7,276 (reported on 8.9% of returns)
Here:
+$7,276
State:
+$49,306
(% of AGI for various income ranges: 4.4% for AGIs below $25k, 11.1% for AGIs $25k-50k, 32.3% for AGIs $50k-75k, 55.2% for AGIs $75k-100k, 300.3% for AGIs $100k-200k, 8098.3% for AGIs over 200k)
Profit/loss from business: +$6,676 (reported on 15.4% of returns)
Here:
+$6,676
State:
+$15,671
(% of AGI for various income ranges: 132.1% for AGIs below $25k, 108.8% for AGIs $25k-50k, 133.6% for AGIs $50k-75k, 205.6% for AGIs $75k-100k, 240.6% for AGIs $100k-200k, 1070.0% for AGIs over 200k)
Taxable individual retirement arrangement distribution: $14,135 (reported on 4.7% of returns)
91945:
$14,135
California:
$23,505
(% of AGI for various income ranges: 27.2% for AGIs below $25k, 35.1% for AGIs $25k-50k, 107.5% for AGIs $50k-75k, 159.3% for AGIs $75k-100k, 475.1% for AGIs $100k-200k)
Total itemized deductions: $27,264 (reported on 11.8% of returns)
Here:
$27,264
State:
$39,517
(% of AGI for various income ranges: 62.0% for AGIs below $25k, 162.6% for AGIs $25k-50k, 522.1% for AGIs $50k-75k, 1005.0% for AGIs $75k-100k, 2056.3% for AGIs $100k-200k, 4558.3% for AGIs over 200k)
Charity contributions: $4,494 (reported on 8.8% of returns)
Here:
$4,494
State:
$12,598
(% of AGI for various income ranges: 2.7% for AGIs below $25k, 12.8% for AGIs $25k-50k, 53.0% for AGIs $50k-75k, 120.2% for AGIs $75k-100k, 293.0% for AGIs $100k-200k, 923.3% for AGIs over 200k)
Taxes paid: $8,026 (reported on 11.7% of returns)
91945:
$8,026
State:
$8,807
(% of AGI for various income ranges: 11.9% for AGIs below $25k, 36.7% for AGIs $25k-50k, 152.4% for AGIs $50k-75k, 310.4% for AGIs $75k-100k, 638.5% for AGIs $100k-200k, 1318.3% for AGIs over 200k)
Earned income credit: $2,051 (reported on 18.6% of returns)
Here:
$2,051
State:
$2,074
(% of AGI for various income ranges: 94.3% for AGIs below $25k, 71.9% for AGIs $25k-50k, 1.2% for AGIs $50k-75k)
Percentage of individuals using paid preparers for their 2020 taxes: 93.4%
Here:
93%
State:
92%
(% for various income ranges: 92.4% for AGIs below $25k, 93.8% for AGIs $25k-50k, 93.8% for AGIs $50k-75k, 94.1% for AGIs $75k-100k, 93.7% for AGIs $100k-200k, 94.4% for AGIs over 200k)
Averages for the 2012 tax year for zip code 91945, filed in 2013:
Average Adjusted Gross Income (AGI) in 2012: $42,022 (Individual Income Tax Returns)
Here:
$42,022
State:
$72,726
Salary/wage: $39,311 (reported on 84.3% of returns)
Here:
$39,311
State:
$59,079
(% of AGI for various income ranges: 73.4% for AGIs below $25k, 82.4% for AGIs $25k-50k, 79.6% for AGIs $50k-75k, 81.8% for AGIs $75k-100k, 78.6% for AGIs $100k-200k, 53.3% for AGIs over 200k)
Taxable interest for individuals: $595 (reported on 28.8% of returns)
This zip code:
$595
California:
$2,146
(% of AGI for various income ranges: 0.5% for AGIs below $25k, 0.4% for AGIs $25k-50k, 0.5% for AGIs $50k-75k, 0.4% for AGIs $75k-100k, 0.4% for AGIs $100k-200k, 0.3% for AGIs over 200k)
Ordinary dividends: $2,229 (reported on 9.7% of returns)
Here:
$2,229
State:
$9,308
(% of AGI for various income ranges: 0.8% for AGIs below $25k, 0.5% for AGIs $25k-50k, 0.5% for AGIs $50k-75k, 0.5% for AGIs $75k-100k, 0.4% for AGIs $100k-200k, 0.9% for AGIs over 200k)
Net capital gain/loss in AGI: +$4,431 (reported on 6.1% of returns)
Here:
+$4,431
State:
+$30,460
(% of AGI for various income ranges: 0.2% for AGIs $50k-75k, 0.3% for AGIs $75k-100k, 0.4% for AGIs $100k-200k, 15.3% for AGIs over 200k)
Profit/loss from business: +$8,483 (reported on 14.0% of returns)
Here:
+$8,483
State:
+$17,064
(% of AGI for various income ranges: 9.7% for AGIs below $25k, 2.6% for AGIs $25k-50k, 2.0% for AGIs $50k-75k, 1.3% for AGIs $75k-100k, 1.4% for AGIs $100k-200k)
Taxable individual retirement arrangement distribution: $11,797 (reported on 6.4% of returns)
91945:
$11,797
California:
$19,557
(% of AGI for various income ranges: 1.6% for AGIs below $25k, 1.3% for AGIs $25k-50k, 1.9% for AGIs $50k-75k, 1.9% for AGIs $75k-100k, 2.6% for AGIs $100k-200k)
Total itemized deductions: $20,766 (29% of AGI, reported on 30.1% of returns)
Here:
$20,766
State:
$34,004
Here:
28.9% of AGI
State:
22.7% of AGI
(% of AGI for various income ranges: 9.2% for AGIs below $25k, 11.9% for AGIs $25k-50k, 16.3% for AGIs $50k-75k, 17.5% for AGIs $75k-100k, 18.3% for AGIs $100k-200k, 13.4% for AGIs over 200k)
Charity contributions: $2,612 (reported on 23.2% of returns)
Here:
$2,612
State:
$4,659
(% of AGI for various income ranges: 0.5% for AGIs below $25k, 1.0% for AGIs $25k-50k, 1.4% for AGIs $50k-75k, 1.9% for AGIs $75k-100k, 2.1% for AGIs $100k-200k, 2.6% for AGIs over 200k)
Taxes paid: $5,967 (reported on 30.0% of returns)
91945:
$5,967
State:
$14,448
(% of AGI for various income ranges: 1.7% for AGIs below $25k, 2.7% for AGIs $25k-50k, 4.3% for AGIs $50k-75k, 5.3% for AGIs $75k-100k, 6.4% for AGIs $100k-200k, 6.8% for AGIs over 200k)
Earned income credit: $2,324 (reported on 23.3% of returns)
Here:
$2,324
State:
$2,286
(% of AGI for various income ranges: 7.7% for AGIs below $25k, 1.3% for AGIs $25k-50k)
Percentage of individuals using paid preparers for their 2012 taxes: 57.7%
Here:
58%
State:
64%
(% for various income ranges: 54.8% for AGIs below $25k, 57.8% for AGIs $25k-50k, 58.9% for AGIs $50k-75k, 61.9% for AGIs $75k-100k, 64.6% for AGIs $100k-200k, 83.3% for AGIs over 200k)
Averages for the 2004 tax year for zip code 91945, filed in 2005:
Average Adjusted Gross Income (AGI) in 2004: $36,776 (Individual Income Tax Returns)
Here:
$36,776
State:
$58,600
Salary/wage: $34,936 (reported on 86.1% of returns)
Here:
$34,936
State:
$49,455
(% of AGI for various income ranges: 104.2% for AGIs below $10k, 78.3% for AGIs $10k-25k, 85.2% for AGIs $25k-50k, 84.1% for AGIs $50k-75k, 84.9% for AGIs $75k-100k, 68.2% for AGIs over 100k)
Taxable interest for individuals: $889 (reported on 39.1% of returns)
This zip code:
$889
California:
$2,365
(% of AGI for various income ranges: 3.3% for AGIs below $10k, 1.3% for AGIs $10k-25k, 0.9% for AGIs $25k-50k, 0.8% for AGIs $50k-75k, 0.5% for AGIs $75k-100k, 1.2% for AGIs over 100k)
Taxable dividends: $1,530 (reported on 13.4% of returns)
Here:
$1,530
State:
$4,746
(% of AGI for various income ranges: 2.6% for AGIs below $10k, 0.7% for AGIs $10k-25k, 0.5% for AGIs $25k-50k, 0.5% for AGIs $50k-75k, 0.4% for AGIs $75k-100k, 0.7% for AGIs over 100k)
Net capital gain/loss: +$8,306 (reported on 10.2% of returns)
Here:
+$8,306
State:
+$23,418
(% of AGI for various income ranges: -1.3% for AGIs below $10k, 0.3% for AGIs $10k-25k, 0.2% for AGIs $25k-50k, 0.4% for AGIs $50k-75k, 1.1% for AGIs $75k-100k, 12.8% for AGIs over 100k)
Profit/loss from business: +$8,220 (reported on 13.6% of returns)
Here:
+$8,220
State:
+$16,826
(% of AGI for various income ranges: 6.4% for AGIs below $10k, 5.9% for AGIs $10k-25k, 3.4% for AGIs $25k-50k, 2.1% for AGIs $50k-75k, 1.6% for AGIs $75k-100k, 2.5% for AGIs over 100k)
IRA payment deduction: $2,538 (reported on 2.0% of returns)
91945:
$2,538
California:
$3,192
(% of AGI for various income ranges: 0.1% for AGIs $10k-25k, 0.2% for AGIs $25k-50k, 0.2% for AGIs $50k-75k, 0.1% for AGIs $75k-100k, 0.1% for AGIs over 100k)
Self-employed pension: $6,462 (reported on 0.4% of returns)
Here:
$6,462
California:
$17,688
(% of AGI for various income ranges: 0.1% for AGIs $10k-25k, 0.1% for AGIs $50k-75k, 0.2% for AGIs $75k-100k)
Total itemized deductions: $19,640 (32% of AGI, reported on 33.5% of returns)
Here:
$19,640
State:
$28,113
Here:
31.8% of AGI
State:
25.3% of AGI
(% of AGI for various income ranges: 13.2% for AGIs below $10k, 10.7% for AGIs $10k-25k, 15.8% for AGIs $25k-50k, 21.1% for AGIs $50k-75k, 22.4% for AGIs $75k-100k, 18.4% for AGIs over 100k)
Charity contributions deductions: $2,435 (4% of AGI, reported on 28.6% of returns)
Here:
$2,435
State:
$3,923
Here:
3.7% of AGI
State:
3.3% of AGI
(% of AGI for various income ranges: 0.5% for AGIs below $10k, 0.9% for AGIs $10k-25k, 1.4% for AGIs $25k-50k, 2.1% for AGIs $50k-75k, 2.9% for AGIs $75k-100k, 2.5% for AGIs over 100k)
Total tax: $3,921 (reported on 74.1% of returns)
91945:
$3,921
State:
$10,761
(% of AGI for various income ranges: 3.7% for AGIs below $10k, 4.3% for AGIs $10k-25k, 6.2% for AGIs $25k-50k, 7.7% for AGIs $50k-75k, 9.2% for AGIs $75k-100k, 13.6% for AGIs over 100k)
Earned income credit: $1,650 (reported on 18.1% of returns)
Here:
$1,650
State:
$1,763
Percentage of individuals using paid preparers for their 2004 taxes: 63.2%
Here:
63%
State:
66%
(% for various income ranges: 56.8% for AGIs below $10k, 63.0% for AGIs $10k-25k, 64.2% for AGIs $25k-50k, 66.4% for AGIs $50k-75k, 67.0% for AGIs $75k-100k, 66.4% for AGIs over 100k)
Likely homosexual households (counted as self-reported same-sex unmarried-partner households)
Lesbian couples: 0.1% of all households
Gay men: 0.1% of all households
Household received Food Stamps/SNAP in the past 12 months: 1,446 Household did not receive Food Stamps/SNAP in the past 12 months: 7,951
Women who had a birth in the past 12 months: 255 (214 now married, 40 unmarried) Women who did not have a birth in the past 12 months: 6,103 (2,254 now married, 3,856 unmarried)
Housing units in zip code 91945 with a mortgage: 4,116 (368 second mortgage, 218 both second mortgage and home equity loan) Houses without a mortgage: 39
Median monthly owner costs for units with a mortgage: $2,300 Median monthly owner costs for units without a mortgage: $687
Residents with income below the poverty level in 2022:
This zip code:
10.0%
Whole state:
12.2%
Residents with income below 50% of the poverty level in 2022:
This zip code:
5.5%
Whole state:
6.2%
Median number of rooms in houses and condos:
Here:
5.8
State:
6.0
Median number of rooms in apartments:
Here:
4.0
State:
3.9
Notable locations in this zip code not listed on our city pages
Notable locations in zip code 91945: Lemon Grove City Hall (A), Lemon Grove Chamber of Commerce (B), Lemon Grove Branch San Diego County Library (C), Lemon Grove Fire Department (D). Display/hide their locations on the map
Shopping Centers: San Altos Shopping Center (1), Lemon Grove Shopping Center (2), Lomita Village Shopping Center (3), Lemon Grove Square Shopping Center (4), Lemon Grove Plaza Shopping Center (5). Display/hide their locations on the map
Churches in zip code 91945 include: New Beginning Christian Assembly Church (A), Sixth Church of Christ Scientist (B), Lighthouse Tabernacle (C), Lemon Grove United Methodist Church (D), Lemon Grove Lutheran Church (E), Lemon Grove Congregational Church (F), Witness of the Word (G), Sion Centro Cristiano (H), Samoa Independent Full Gospel Church (I). Display/hide their locations on the map
Parks in zip code 91945 include: Lemon Grove Park (1), Berry City Park (2), Firemens Park (3), Monterey Heights County Park (4). Display/hide their locations on the map
3,217 married couples with children.
1,331 single-parent households (153 men, 1,178 women).
61.6% of residents of 91945 zip code speak English at home.
29.0% of residents speak Spanish at home (77% very well, 13% well, 8% not well, 2% not at all).
1.2% of residents speak other Indo-European language at home (68% very well, 13% well, 2% not well, 17% not at all).
5.4% of residents speak Asian or Pacific Island language at home (55% very well, 33% well, 11% not well, 1% not at all).
2.3% of residents speak other language at home (37% very well, 33% well, 23% not well, 7% not at all).
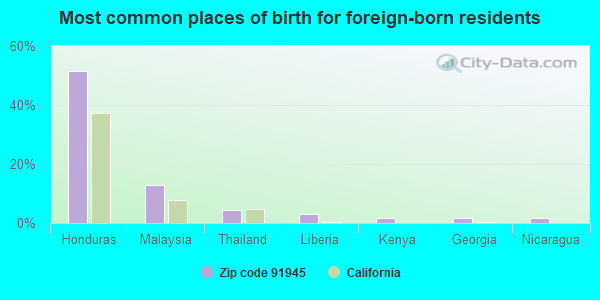
Foreign born population: 4,688 (17.2%) (62.1% of them are naturalized citizens)
This zip code:
17.2%
Whole state:
26.7%
51%Honduras
13%Malaysia
4%Thailand
3%Liberia
2%Kenya
2%Georgia
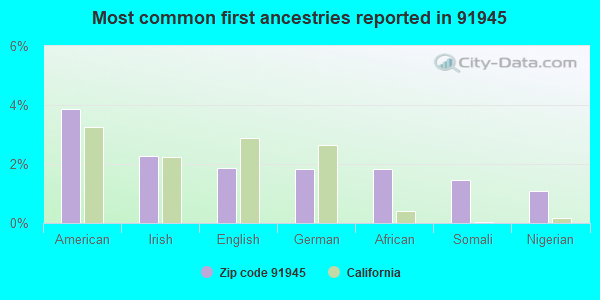
2%Nicaragua
2%American
2%Irish
2%German
2%Italian
2%African
1%Ethiopian
1%English
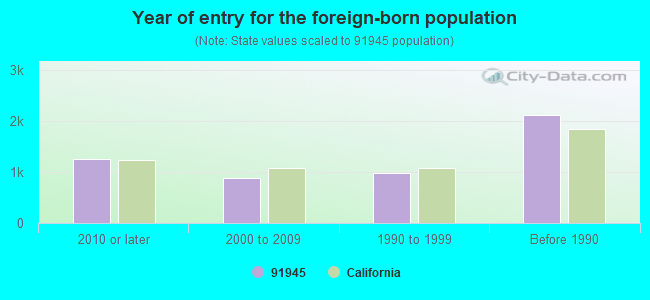
Year of entry for the foreign-born population
1,2442010 or later
8712000 to 2009
9861990 to 1999
2,112Before 1990
Major facilities with environmental interests located in this zip code:
EDCO DISPOSAL CORPORATION (6670 FEDERAL BLVD in LEMON GROVE, CA)
STATE MASTER (California - Hazardous Waste Tracking) - HAZARDOU WASTE PROGRAM (Resource Conservation and Recovery Act (tracking hazardous waste)) Organizations: EDWARD BURR (CONTACT/OWNER)
A & C PAINT & BODY (7083 BROADWAY in LEMON GROVE, CA)
STATE MASTER (California - Hazardous Waste Tracking) - HAZARDOU WASTE PROGRAM CRITERIA AND HAZARDOUS AIR POLLUTANT INVENTORY (Inventory of air pollution sources) Small Quantity Generators, between 100 kg and 1000 kg of hazardous waste/month (Resource Conservation and Recovery Act (tracking hazardous waste)) Business SIC classification: TOP, BODY, AND UPHOLSTERY REPAIR SHOPS AND PAINT SHOPS Business NAICS classification: AUTOMOTIVE BODY, PAINT, AND INTERIOR REPAIR AND MAINTENANCE.
LENCO EQUIPMENT CO INC (6470 FEDERAL BLVD in LEMON GROVE, CA)
STATE MASTER (California - Hazardous Waste Tracking) - HAZARDOU WASTE PROGRAM Small Quantity Generators, between 100 kg and 1000 kg of hazardous waste/month (Resource Conservation and Recovery Act (tracking hazardous waste)) - notification Organizations: GARY E SUMEK (CONTACT/OWNER)
LEMON GROVE SCHOOL DISTRICT (2875 SKYLINE DR in LEMON GROVE, CA)
STATE MASTER (California - Hazardous Waste Tracking) - HAZARDOU WASTE PROGRAM Small Quantity Generators, between 100 kg and 1000 kg of hazardous waste/month (Resource Conservation and Recovery Act (tracking hazardous waste)) - notification Organizations: LEMON GROVE USD (CONTACT/OWNER)
JENAL ENGINEERING CORP (7959 LEMON GROVE WAY in LEMON GROVE, CA)
STATE MASTER (California - Hazardous Waste Tracking) - HAZARDOU WASTE PROGRAM TRANSPORTER (Resource Conservation and Recovery Act (tracking hazardous waste)) Organizations: ALAN WESTERMEYER (CONTACT/OPERATOR)
, JENNIFER WESTERMEYER (CONTACT/OWNER)
EQUILON ENTERPRISES (7180 BROADWAY in LEMON GROVE, CA) . Federal Facility
STATE MASTER (California - Hazardous Waste Tracking) - HAZARDOU WASTE PROGRAM CRITERIA AND HAZARDOUS AIR POLLUTANT INVENTORY (Inventory of air pollution sources) Small Quantity Generators, between 100 kg and 1000 kg of hazardous waste/month (Resource Conservation and Recovery Act (tracking hazardous waste)) - notification Business SIC classification: GASOLINE SERVICE STATIONS Alternative names: TEXACO SERVICE STATION
LEMON GROVE AUTO BODY (7666 NORTH AVE in LEMON GROVE, CA)
STATE MASTER (California - Hazardous Waste Tracking) - HAZARDOU WASTE PROGRAM Small Quantity Generators, between 100 kg and 1000 kg of hazardous waste/month (Resource Conservation and Recovery Act (tracking hazardous waste)) - notification Business NAICS classification: AUTOMOTIVE BODY, PAINT, AND INTERIOR REPAIR AND MAINTENANCE. Organizations: TITO GONZALEZ (CONTACT/OWNER)
MICRO TOOL MANUFACTURING INC (6494 FEDERAL BLVD in LEMON GROVE, CA)
STATE MASTER (California - Hazardous Waste Tracking) - HAZARDOU WASTE PROGRAM Small Quantity Generators, between 100 kg and 1000 kg of hazardous waste/month (Resource Conservation and Recovery Act (tracking hazardous waste)) Business NAICS classification: SPECIAL DIE AND TOOL, DIE SET, JIG, AND FIXTURE MANUFACTURING. Alternative names: MICRO TOOL & MFG CO INC
LETTER KRAFT PRINTING (3135 LEMON GROVE AVENUE in LEMON GROVE, CA)
STATE MASTER (California - Hazardous Waste Tracking) - HAZARDOU WASTE PROGRAM Small Quantity Generators, between 100 kg and 1000 kg of hazardous waste/month (Resource Conservation and Recovery Act (tracking hazardous waste)) Business NAICS classification: COMMERCIAL LITHOGRAPHIC PRINTING.
LEMON GROVE MIDDLE (7866 LINCOLN ST. in LEMON GROVE, CA)
(National Center for Education Statistics) - STATE ID-6038616 Organizations: LEMON GROVE ELEMENTARY (SCHOOL DISTRICT)
MT. VERNON ELEMENTARY (8350 MT. VERNON ST. in LEMON GROVE, CA)
(National Center for Education Statistics) - STATE ID-6038632 Organizations: LEMON GROVE ELEMENTARY (SCHOOL DISTRICT)
MONTEREY HEIGHTS ELEMENTARY (7550 CANTON DR. in LEMON GROVE, CA)
(National Center for Education Statistics) - STATE ID-6038624 Organizations: LEMON GROVE ELEMENTARY (SCHOOL DISTRICT)
GOLDEN AVENUE ELEMENTARY (7885 GOLDEN AVE. in LEMON GROVE, CA)
(National Center for Education Statistics) - STATE ID-6038608 Organizations: LEMON GROVE ELEMENTARY (SCHOOL DISTRICT)
Housing units lacking complete plumbing facilities: 1.0% Housing units lacking complete kitchen facilities: 1.4%
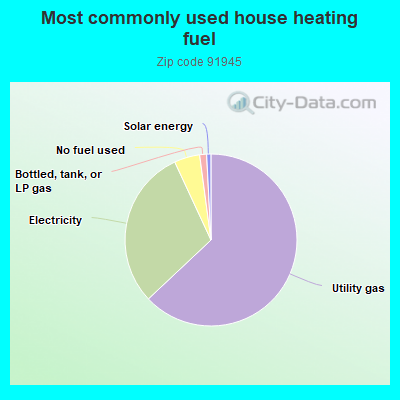
62.8%Utility gas
30.0%Electricity
4.8%No fuel used
1.3%Bottled, tank, or LP gas
0.8%Solar energy
Population in 1990: 24,268. Population change in the 1990s: +685 (+2.8%).
Place of birth for U.S.-born residents:
This state: 17,405
Northeast: 920
Midwest: 1,352
South: 1,524
West: 854
53% of the 91945 zip code residents lived in the same house 5 years ago. Out of people who lived in different houses, 81% lived in this county. Out of people who lived in different counties, 50% lived in California.
91% of the 91945 zip code residents lived in the same house 1 year ago. Out of people who lived in different houses, 68% moved from this county. Out of people who lived in different houses, 8% moved from different county within same state. Out of people who lived in different houses, 18% moved from different state. Out of people who lived in different houses, 6% moved from abroad.
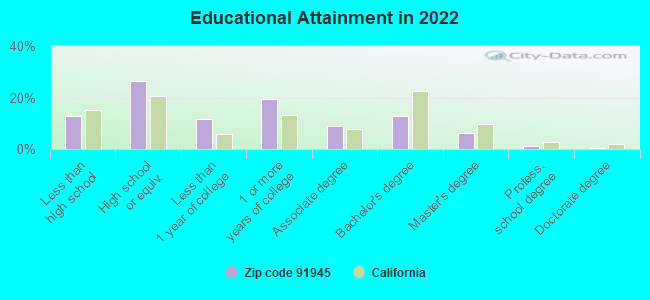
Private vs. public school enrollment:
Students in private schools in grades 1 to 8 (elementary and middle school): 148
Here:
6.3%
California:
10.5%
Students in private schools in grades 9 to 12 (high school): 33
Here:
2.0%
California:
8.5%
Students in private undergraduate colleges: 301
Here:
18.8%
California:
15.9%
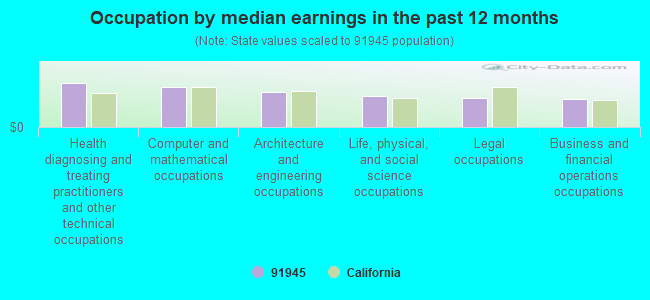
Occupation by median earnings in the past 12 months ($)
109,142Health diagnosing and treating practitioners and other technical occupations
105,131Computer and mathematical occupations
81,404Architecture and engineering occupations
78,837Life, physical, and social science occupations
65,904Legal occupations
65,461Business and financial operations occupations
Companies with biggest federal contracts located in this zip code (LEMON GROVE, CA):
EDCO DISPOSAL CORPORATION (6670 FEDERAL BLVD) : $7,691,234 in 238 contractsfrom 1999 to 2005
Contracts for Trash/Garbage Collection Services - Including Portable Sanitation Services, Other Housekeeping Services, Construction of Structures and Facilities -- Family Housing Facilities by Navy Signed by year:2000: $1,105,846; 2001: $1,016,484; 2002: $322,745; 2003: $2,691,163; 2004: $1,416,442; 2005: $1,064,715; 2006: $0.
Biggest contracts:
$838,434 with Navy for Trash/Garbage Collection Services - Including Portable Sanitation Services. Signed on 2005-09-29. Completion date: 2006-09-30.
$802,995, same as above.Signed on 2004-09-30. Completion date: 2004-09-30.
$784,581, same as above.Signed on 2000-10-01. Completion date: 2001-01-01.
$701,980, same as above.Signed on 2003-02-10. Completion date: 2002-09-30.
JCI METAL PRODUCTS INC (6540 FEDERAL BLVD; small business) : $2,506,817 in 88 contractsfrom 1999 to 2006
Contracts for Miscellaneous Ship and Marine Equipment, Non-nuclear Ship Repair (West) Ship repair (including overhauls and conversions) performed on. non-nuclear propelled and nonpropelled ships west of the 108th meridian, Miscellaneous Prefabricated Structures, Maintenance, Repair and Rebuilding of Equipment -- Ship and Marine Equipment, and moreby Navy Signed by year:2000: $498,303; 2001: $419,253; 2002: $457,284; 2003: $108,955; 2004: $435,278; 2005: $219,764; 2006: $269,156.
Biggest contracts:
$218,082 with Navy for Miscellaneous Ship and Marine Equipment. Signed on 2001-04-26. Completion date: 2002-04-27.
$151,995 with Navy for Non-nuclear Ship Repair (West) Ship repair (including overhauls and conversions) performed on. non-nuclear propelled and nonpropelled ships west of the 108th meridian. Signed on 2000-08-30. Completion date: 2000-09-29.
$129,940, same as above.Signed on 2000-09-11. Completion date: 2000-09-30.
$101,941, same as above.Signed on 2004-04-14. Completion date: 2004-06-06.
MICHAEL E NEWMAN (2330 DI FOSS ST; small business) : $587,956 in 7 contractsfrom 2000 to 2005
Contracts for Other Medical Services, Neurology Services, Drugs and Biologicals by Navy Signed by year:2000: $75,950; 2001: $75,950; 2002: $75,950; 2003: $170,060; 2004: $93,906; 2005: $96,140; 2006: $0.
Biggest contracts:
$96,140 with Navy for Other Medical Services. Signed on 2005-10-20. Completion date: 2005-09-30.
$94,110, same as above.Signed on 2003-10-01. Completion date: 2004-09-30.
$93,906, same as above.Signed on 2004-10-21. Completion date: 2005-09-30.
$75,950 with Navy for Neurology Services. Signed on 2003-09-16. Completion date: 2002-09-30.
AZTEC LANDSCAPING INC (7970 LEMON GROVE WAY; small business) : $523,831 in 15 contractsfrom 1999 to 2006
Contracts for Custodial Janitorial Services, Landscaping/Groundskeeping Services, Tree Thinning Services, Maintenance, Repair or Alteration of Real Property -- Miscellaneous Buildings, and moreby Navy, U.S. Coast Guard Signed by year:2000: $228,225; 2001: $0; 2002: $65,000; 2003: $450; 2004: $15,512; 2005: $35,190; 2006: $122,054.
Biggest contracts:
$122,054 with Navy for Custodial Janitorial Services. Signed on 2006-02-08. Completion date: 2004-10-01.
$100,057 with Navy for Landscaping/Groundskeeping Services. Signed on 2000-03-10. Completion date: 2000-09-30.
$65,000, same as above.Signed on 2002-06-05. Completion date: 2003-06-04.
$57,400, same as above.Signed on 1999-10-01. Completion date: 2000-09-30.
REPUBLIC BRASS SALES, INC (6566 FEDERAL BLVD; small business) : $478,313 in 30 contractsfrom 2000 to 2005
Contracts for Pipe, Tube and Rigid Tubing, Non-nuclear Ship Repair (West) Ship repair (including overhauls and conversions) performed on. non-nuclear propelled and nonpropelled ships west of the 108th meridian, Valves, Nonpowered, Valves, Powered, and moreby Navy Signed by year:2000: $28,800; 2001: $85,384; 2002: $71,191; 2003: $72,701; 2004: $90,249; 2005: $129,988; 2006: $0.
Biggest contracts:
$85,384 with Navy for Pipe, Tube and Rigid Tubing. Signed on 2001-06-15. Completion date: 2001-07-13.
$71,191 with Navy for Non-nuclear Ship Repair (West) Ship repair (including overhauls and conversions) performed on. non-nuclear propelled and nonpropelled ships west of the 108th meridian. Signed on 2002-11-27. Completion date: 2002-11-30.
$51,850 with Navy for Valves, Nonpowered. Signed on 2004-04-16. Completion date: 2004-05-08.
$46,760 with Navy for Non-nuclear Ship Repair (West) Ship repair (including overhauls and conversions) performed on. non-nuclear propelled and nonpropelled ships west of the 108th meridian. Signed on 2003-05-19. Completion date: 2003-06-15.
KAHL SCIENTIFIC INSTRUMENT COR (8161 LINCOLN ST; small business) : $375,249 in 26 contractsfrom 2000 to 2006
Contracts for Pressure, Temperature, and Humidity Measuring and Controlling Instruments, Navigational Instruments, Packing and Gasket Materials, Hardware, Commercial, and moreby Federal Supply Service, Navy, Defense Logistics Agency Signed by year:2000: $126,000; 2001: $0; 2002: $0; 2003: $39,399; 2004: $67,415; 2005: $31,428; 2006: $111,007.
Biggest contracts:
$47,252 with Federal Supply Service for Pressure, Temperature, and Humidity Measuring and Controlling Instruments. Signed on 2006-03-30. Completion date: 2006-05-17.
$46,000, same as above.Signed on 2000-10-15. Completion date: 2000-11-15.
$45,000, same as above.Signed on 2000-09-15. Completion date: 2000-10-15.
$44,651, same as above.Signed on 2004-02-25. Completion date: 2004-04-13.
FULLER AIR CONDITIONING (6550 FEDERAL BLVD; small business) : $117,657 in 5 contractsfrom 2003 to 2004
Contracts for Maintenance, Repair or Alteration of Real Property -- Other Administrative Facilities and Service Buildings, Maintenance, Repair or Alteration of Real Property -- Office Buildings, Maintenance, Repair or Alteration of Real Property -- Miscellaneous Buildings, Plumbing Fixtures and Accessories by Navy Signed by year:2000: $0; 2001: $0; 2002: $0; 2003: $116,687; 2004: $970; 2005: $0; 2006: $0.
Biggest contracts:
$38,210 with Navy for Maintenance, Repair or Alteration of Real Property -- Other Administrative Facilities and Service Buildings. Signed on 2003-09-11. Completion date: 2003-11-11.
$37,324 with Navy for Maintenance, Repair or Alteration of Real Property -- Office Buildings. Signed on 2003-12-05. Completion date: 2004-02-05.
$33,369 with Navy for Maintenance, Repair or Alteration of Real Property -- Miscellaneous Buildings. Signed on 2003-08-11. Completion date: 2003-10-31.
$7,784 with Navy for Plumbing Fixtures and Accessories. Signed on 2003-01-09. Completion date: 2003-01-23.
S-1 MARINE & INDUSTRIAL SPECIA (6590B FEDERAL BLVD; small business) : $55,408 in 10 contractsfrom 2002 to 2005
Contracts for Engine Fuel System Components, Nonaircraft, Non-nuclear Ship Repair (West) Ship repair (including overhauls and conversions) performed on. non-nuclear propelled and nonpropelled ships west of the 108th meridian, Marine Hardware and Hull Items, Plate, Sheet, Strip, Foil; and Leaf, and moreby Navy Signed by year:2000: $0; 2001: $0; 2002: $14,800; 2003: $15,374; 2004: $8,950; 2005: $16,284; 2006: $0.
Biggest contracts:
$14,800 with Navy for Engine Fuel System Components, Nonaircraft. Signed on 2002-11-12. Completion date: 2003-02-12.
$9,412 with Navy for Non-nuclear Ship Repair (West) Ship repair (including overhauls and conversions) performed on. non-nuclear propelled and nonpropelled ships west of the 108th meridian. Signed on 2005-03-11. Completion date: 2005-04-08.
$6,363 with Navy for Marine Hardware and Hull Items. Signed on 2003-04-03. Completion date: 2003-05-01.
$6,200 with Navy for Plate, Sheet, Strip, Foil; and Leaf. Signed on 2004-04-27. Completion date: 2004-05-11.
JOSEPHINE V BALL (2544 PERGL ST; small business) : $53,629 in 3 contractsfrom 2004 to 2006
$25,834 with Navy for Other Administrative Support Services. Signed on 2004-07-01. Completion date: 2005-09-30.
$14,775 with Navy for Other Education and Training Services. Signed on 2006-02-15. Completion date: 2006-02-13.
$13,020 with Navy for Other Administrative Support Services. Signed on 2004-02-17. Completion date: 2004-09-30.
TOOZE ENTERPRISE INC (3774 GROVE STREET UNIT C; small business) : $35,790 in 3 contractsfrom 2001 to 2004
$30,000 with Air Force for Measuring Tools, Craftsmen's. Signed on 2001-08-16. Completion date: 2001-08-09.
$3,000 with Navy for Torque Converters and Speed Changers. Signed on 2004-01-29. Completion date: 2004-02-04.
$2,790 with Navy for Compressors and Vacuum Pumps. Signed on 2003-03-28. Completion date: 2003-04-04.
Top industries in this zip code by the number of employees in 2005:
2005 - 2018 National Fire Incident Reporting System (NFIRS) incidents
According to the data from the years 2005 - 2018 the average number of fires per year is 24. The highest number of reported fire incidents - 53 took place in 2013, and the least - 2 in 2010. The data has a decreasing trend.
When looking into fire subcategories, the most incidents belonged to: Structure Fires (34.0%), and Outside Fires (32.2%).
Fire incident types reported to NFIRS in Zip Code 91945


 Nearest zip codes: 92114, 91977, 91941, 91942, 92115, 92139.


 According to the data from the years 2005 - 2018 the average number of fires per year is 24. The highest number of reported fire incidents - 53 took place in 2013, and the least - 2 in 2010. The data has a decreasing trend.
 When looking into fire subcategories, the most incidents belonged to: Structure Fires (34.0%), and Outside Fires (32.2%).