Estimated zip code population in 2022: 1,277 Zip code population in 2010: 1,048 Zip code population in 2000: 1,061
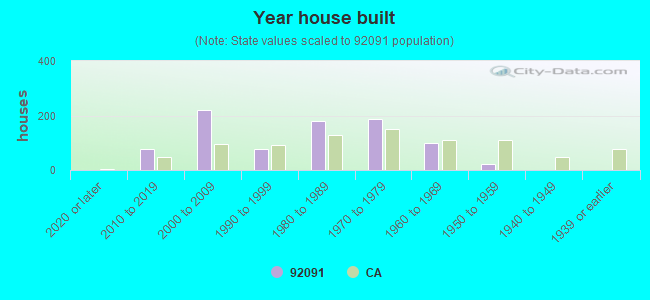
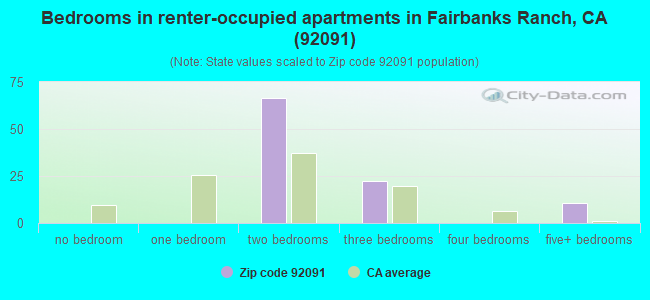
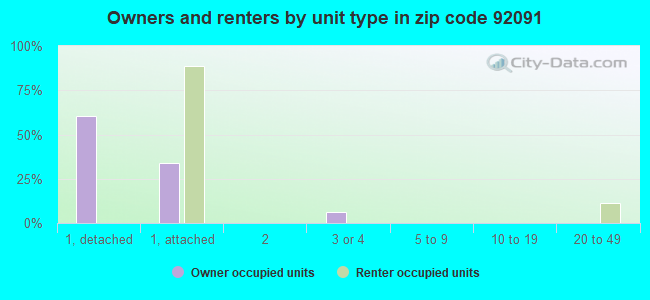
Houses and condos: 858 Renter-occupied apartments: 99
% of renters here:
15%
State:
44%
March 2022 cost of living index in zip code 92091: 138.4 (high, U.S. average is 100)
Land area: 0.7 sq. mi. Water area: 0.0 sq. mi.
Population density: 1,949 people per square mile
(low).
OSM Map
General Map
Google Map
MSN Map
OSM Map
General Map
Google Map
MSN Map
OSM Map
General Map
Google Map
MSN Map
OSM Map
General Map
Google Map
MSN Map
Please wait while loading the map...
Real estate property taxes paid for housing units in 2022:
This zip code:
0.6% ($9,906)
California:
0.7% ($4,831)
Median real estate property taxes paid for housing units with mortgages in 2022: $10,330 (0.6%) Median real estate property taxes paid for housing units with no mortgage in 2022: $7,812 (0.5%)
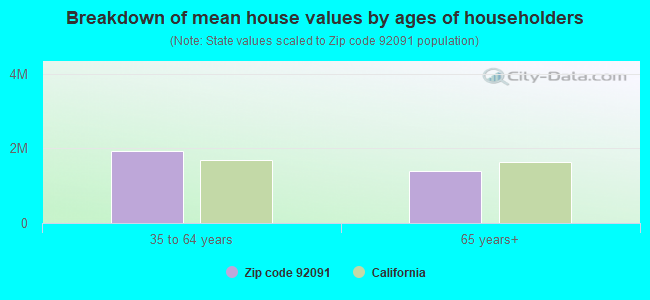
Estimated median house/condo value in 2022: $1,720,201
92091:
$1,720,201
California:
$715,900
Median resident age:
This zip code:
62.9 years
California median age:
37.9 years
Average household size:
This zip code:
1.9 people
California:
2.8 people
Averages for the 2020 tax year for zip code 92091, filed in 2021:
Average Adjusted Gross Income (AGI) in 2020: $379,972 (Individual Income Tax Returns)
Here:
$379,972
State:
$95,910
Salary/wage: $263,442 (reported on 60.0% of returns)
Here:
$263,442
State:
$77,331
(% of AGI for various income ranges: 1253.8% for AGIs below $25k, 3332.5% for AGIs $25k-50k, 7253.3% for AGIs $50k-75k, 12220.0% for AGIs $75k-100k, 17744.0% for AGIs $100k-200k, 205442.0% for AGIs over 200k)
Taxable interest for individuals: $10,994 (reported on 68.0% of returns)
This zip code:
$10,994
California:
$2,294
(% of AGI for various income ranges: 170.0% for AGIs below $25k, 310.0% for AGIs $25k-50k, 613.3% for AGIs $50k-75k, 640.0% for AGIs $75k-100k, 612.0% for AGIs $100k-200k, 9458.0% for AGIs over 200k)
Ordinary dividends: $35,440 (reported on 62.7% of returns)
Here:
$35,440
State:
$10,949
(% of AGI for various income ranges: 376.2% for AGIs below $25k, 577.5% for AGIs $25k-50k, 1610.0% for AGIs $50k-75k, 1805.0% for AGIs $75k-100k, 3230.0% for AGIs $100k-200k, 27332.0% for AGIs over 200k)
Net capital gain/loss in AGI: +$151,361 (reported on 61.3% of returns)
Here:
+$151,361
State:
+$49,306
(% of AGI for various income ranges: 103.8% for AGIs below $25k, 352.5% for AGIs $25k-50k, 233.3% for AGIs $50k-75k, 970.0% for AGIs $75k-100k, 4006.0% for AGIs $100k-200k, 134270.0% for AGIs over 200k)
Profit/loss from business: +$37,883 (reported on 24.0% of returns)
Here:
+$37,883
State:
+$15,671
(% of AGI for various income ranges: 490.0% for AGIs below $25k, 2270.0% for AGIs $50k-75k, 1112.0% for AGIs $100k-200k, 10380.0% for AGIs over 200k)
Taxable individual retirement arrangement distribution: $56,600 (reported on 20.0% of returns)
92091:
$56,600
California:
$23,505
(% of AGI for various income ranges: 370.0% for AGIs below $25k, 3390.0% for AGIs $50k-75k, 2498.0% for AGIs $100k-200k, 11856.0% for AGIs over 200k)
Self-employed (Keogh) retirement plans: $24,233 (reported on 4.0% of returns)
92091:
$24,233
California:
$30,163
(% of AGI for various income ranges: 1454.0% for AGIs $100k-200k)
Total itemized deductions: $68,058 (reported on 44.0% of returns)
Here:
$68,058
State:
$39,517
(% of AGI for various income ranges: 1678.8% for AGIs below $25k, 2940.0% for AGIs $50k-75k, 3645.0% for AGIs $75k-100k, 5056.0% for AGIs $100k-200k, 33954.0% for AGIs over 200k)
Charity contributions: $23,529 (reported on 37.3% of returns)
Here:
$23,529
State:
$12,598
(% of AGI for various income ranges: 68.8% for AGIs below $25k, 403.3% for AGIs $50k-75k, 710.0% for AGIs $100k-200k, 12114.0% for AGIs over 200k)
Taxes paid: $9,561 (reported on 44.0% of returns)
92091:
$9,561
State:
$8,807
(% of AGI for various income ranges: 362.5% for AGIs below $25k, 646.7% for AGIs $50k-75k, 855.0% for AGIs $75k-100k, 1450.0% for AGIs $100k-200k, 3550.0% for AGIs over 200k)
Earned income credit: $1,050 (reported on 2.7% of returns)
Here:
$1,050
State:
$2,074
(% of AGI for various income ranges: 26.2% for AGIs below $25k)
Percentage of individuals using paid preparers for their 2020 taxes: 94.7%
Here:
95%
State:
92%
(% for various income ranges: 93.8% for AGIs below $25k, 87.5% for AGIs $25k-50k, 100.0% for AGIs $50k-75k, 100.0% for AGIs $75k-100k, 93.3% for AGIs $100k-200k, 95.7% for AGIs over 200k)
Averages for the 2012 tax year for zip code 92091, filed in 2013:
Average Adjusted Gross Income (AGI) in 2012: $274,577 (Individual Income Tax Returns)
Here:
$274,577
State:
$72,726
Salary/wage: $193,539 (reported on 58.9% of returns)
Here:
$193,539
State:
$59,079
(% of AGI for various income ranges: 65.2% for AGIs below $25k, 52.0% for AGIs $25k-50k, 23.2% for AGIs $50k-75k, 42.8% for AGIs $75k-100k, 49.6% for AGIs $100k-200k, 40.5% for AGIs over 200k)
Taxable interest for individuals: $12,429 (reported on 73.2% of returns)
This zip code:
$12,429
California:
$2,146
(% of AGI for various income ranges: 7.1% for AGIs below $25k, 7.4% for AGIs $25k-50k, 8.2% for AGIs $50k-75k, 2.8% for AGIs $75k-100k, 2.2% for AGIs $100k-200k, 3.2% for AGIs over 200k)
Ordinary dividends: $27,135 (reported on 60.7% of returns)
Here:
$27,135
State:
$9,308
(% of AGI for various income ranges: 15.4% for AGIs below $25k, 9.3% for AGIs $25k-50k, 11.4% for AGIs $50k-75k, 6.9% for AGIs $75k-100k, 8.6% for AGIs $100k-200k, 5.4% for AGIs over 200k)
Net capital gain/loss in AGI: +$68,536 (reported on 64.3% of returns)
Here:
+$68,536
State:
+$30,460
(% of AGI for various income ranges: 1.5% for AGIs $25k-50k, 1.2% for AGIs $75k-100k, 4.5% for AGIs $100k-200k, 18.8% for AGIs over 200k)
Profit/loss from business: +$44,408 (reported on 23.2% of returns)
Here:
+$44,408
State:
+$17,064
(% of AGI for various income ranges: 13.1% for AGIs below $25k, 5.4% for AGIs $25k-50k, 3.0% for AGIs $100k-200k, 3.9% for AGIs over 200k)
Taxable individual retirement arrangement distribution: $52,207 (reported on 25.0% of returns)
92091:
$52,207
California:
$19,557
(% of AGI for various income ranges: 17.4% for AGIs $25k-50k, 21.7% for AGIs $50k-75k, 8.0% for AGIs $100k-200k, 3.9% for AGIs over 200k)
Self-employment retirement plans: $39,650 (reported on 3.6% of returns)
92091:
$39,650
California:
$24,530
Total itemized deductions: $88,007 (24% of AGI, reported on 73.2% of returns)
Here:
$88,007
State:
$34,004
Here:
24.3% of AGI
State:
22.7% of AGI
(% of AGI for various income ranges: 72.5% for AGIs below $25k, 40.6% for AGIs $25k-50k, 30.1% for AGIs $50k-75k, 26.7% for AGIs $75k-100k, 29.9% for AGIs $100k-200k, 21.6% for AGIs over 200k)
Charity contributions: $8,494 (reported on 62.5% of returns)
Here:
$8,494
State:
$4,659
(% of AGI for various income ranges: 2.1% for AGIs below $25k, 3.0% for AGIs $25k-50k, 2.2% for AGIs $50k-75k, 2.5% for AGIs $75k-100k, 2.7% for AGIs $100k-200k, 1.8% for AGIs over 200k)
Taxes paid: $42,078 (reported on 73.2% of returns)
92091:
$42,078
State:
$14,448
(% of AGI for various income ranges: 20.7% for AGIs below $25k, 15.0% for AGIs $25k-50k, 9.7% for AGIs $50k-75k, 12.0% for AGIs $75k-100k, 12.6% for AGIs $100k-200k, 10.9% for AGIs over 200k)
Percentage of individuals using paid preparers for their 2012 taxes: 78.6%
Here:
79%
State:
64%
(% for various income ranges: 76.9% for AGIs below $25k, 71.4% for AGIs $25k-50k, 80.0% for AGIs $50k-75k, 80.0% for AGIs $75k-100k, 72.7% for AGIs $100k-200k, 86.7% for AGIs over 200k)
Averages for the 2004 tax year for zip code 92091, filed in 2005:
Average Adjusted Gross Income (AGI) in 2004: $257,352 (Individual Income Tax Returns)
Here:
$257,352
State:
$58,600
Salary/wage: $192,529 (reported on 54.0% of returns)
Here:
$192,529
State:
$49,455
(% of AGI for various income ranges: 35.0% for AGIs $10k-25k, 37.2% for AGIs $25k-50k, 33.4% for AGIs $50k-75k, 43.9% for AGIs $75k-100k, 37.2% for AGIs over 100k)
Taxable interest for individuals: $20,306 (reported on 80.3% of returns)
This zip code:
$20,306
California:
$2,365
(% of AGI for various income ranges: 17.1% for AGIs $10k-25k, 7.7% for AGIs $25k-50k, 6.0% for AGIs $50k-75k, 4.2% for AGIs $75k-100k, 5.4% for AGIs over 100k)
Taxable dividends: $15,339 (reported on 65.3% of returns)
Here:
$15,339
State:
$4,746
(% of AGI for various income ranges: 15.0% for AGIs $10k-25k, 10.3% for AGIs $25k-50k, 8.7% for AGIs $50k-75k, 6.0% for AGIs $75k-100k, 3.1% for AGIs over 100k)
Net capital gain/loss: +$107,597 (reported on 67.5% of returns)
Here:
+$107,597
State:
+$23,418
(% of AGI for various income ranges: -4.7% for AGIs $10k-25k, 0.8% for AGIs $25k-50k, -0.5% for AGIs $50k-75k, 2.4% for AGIs $75k-100k, 28.2% for AGIs over 100k)
Profit/loss from business: +$26,447 (reported on 20.8% of returns)
Here:
+$26,447
State:
+$16,826
(% of AGI for various income ranges: 20.0% for AGIs $10k-25k, 14.8% for AGIs $25k-50k, 6.2% for AGIs $50k-75k, 1.6% for AGIs over 100k)
IRA payment deduction: $4,400 (reported on 2.2% of returns)
92091:
$4,400
California:
$3,192
Self-employed pension: $21,368 (reported on 4.2% of returns)
Here:
$21,368
California:
$17,688
Total itemized deductions: $72,696 (19% of AGI, reported on 69.9% of returns)
Here:
$72,696
State:
$28,113
Here:
18.9% of AGI
State:
25.3% of AGI
(% of AGI for various income ranges: 83.9% for AGIs $10k-25k, 53.0% for AGIs $25k-50k, 29.3% for AGIs $50k-75k, 31.5% for AGIs $75k-100k, 16.6% for AGIs over 100k)
Charity contributions deductions: $10,255 (2% of AGI, reported on 64.2% of returns)
Here:
$10,255
State:
$3,923
Here:
2.5% of AGI
State:
3.3% of AGI
(% of AGI for various income ranges: 4.5% for AGIs $10k-25k, 2.4% for AGIs $25k-50k, 3.8% for AGIs $50k-75k, 2.8% for AGIs $75k-100k, 2.3% for AGIs over 100k)
Total tax: $71,162 (reported on 82.1% of returns)
92091:
$71,162
State:
$10,761
(% of AGI for various income ranges: 4.5% for AGIs $10k-25k, 7.2% for AGIs $25k-50k, 10.7% for AGIs $50k-75k, 11.2% for AGIs $75k-100k, 22.1% for AGIs over 100k)
Percentage of individuals using paid preparers for their 2004 taxes: 79.0%
Here:
79%
State:
66%
(% for various income ranges: 76.9% for AGIs below $10k, 66.7% for AGIs $10k-25k, 80.3% for AGIs $25k-50k, 70.0% for AGIs $50k-75k, 69.2% for AGIs $75k-100k, 87.5% for AGIs over 100k)
Likely homosexual households (counted as self-reported same-sex unmarried-partner households)
Lesbian couples: 0.0% of all households
Gay men: 2.5% of all households
Household received Food Stamps/SNAP in the past 12 months: 0 Household did not receive Food Stamps/SNAP in the past 12 months: 661
Women who did not have a birth in the past 12 months: 109 (77 now married, 30 unmarried)
Housing units in zip code 92091 with a mortgage: 314 (35 second mortgage, 36 both second mortgage and home equity loan) Median monthly owner costs for units with a mortgage: $3,876 Median monthly owner costs for units without a mortgage: $1,556
Residents with income below the poverty level in 2022:
This zip code:
11.7%
Whole state:
12.2%
Residents with income below 50% of the poverty level in 2022:
This zip code:
1.4%
Whole state:
6.2%
Median number of rooms in houses and condos:
Here:
6.5
State:
6.0
Median number of rooms in apartments:
Here:
4.8
State:
3.9
Notable locations in this zip code not listed on our city pages
Size of family households: 268 2-persons, 33 4-persons, 51 5-persons
Size of nonfamily households: 307 1-person, 26 2-persons
186 married couples with children.
15 single-parent households (15 women).
78.3% of residents of 92091 zip code speak English at home.
9.9% of residents speak Spanish at home (100% very well).
6.0% of residents speak other Indo-European language at home (100% very well).
7.1% of residents speak Asian or Pacific Island language at home (62% very well, 18% well, 20% not well).
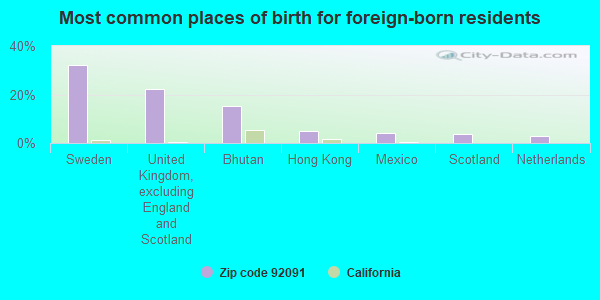
Foreign born population: 259 (20.3%) (77.9% of them are naturalized citizens)
This zip code:
20.3%
Whole state:
26.7%
32%Sweden
22%United Kingdom, excluding England and Scotland
15%Bhutan
5%Hong Kong
4%Mexico
4%Scotland
3%Netherlands
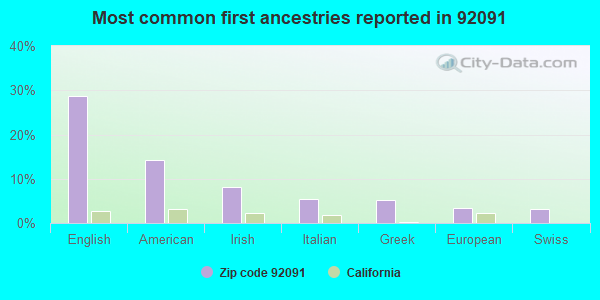
29%English
14%American
8%Irish
6%Italian
5%Greek
3%European
3%Swiss
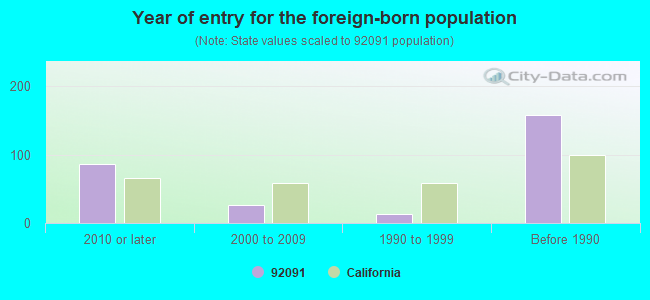
Year of entry for the foreign-born population
862010 or later
262000 to 2009
131990 to 1999
158Before 1990
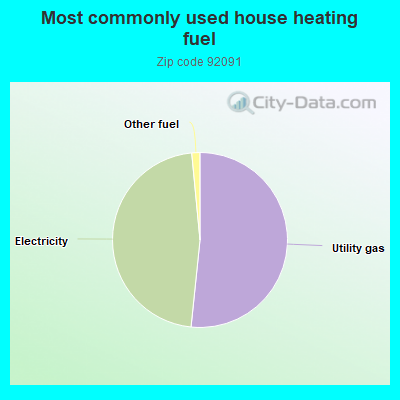
51.7%Utility gas
46.9%Electricity
1.5%Other fuel
Place of birth for U.S.-born residents:
This state: 494
Northeast: 202
Midwest: 130
South: 144
West: 14
50% of the 92091 zip code residents lived in the same house 5 years ago. Out of people who lived in different houses, 76% lived in this county. Out of people who lived in different counties, 50% lived in California.
88% of the 92091 zip code residents lived in the same house 1 year ago. Out of people who lived in different houses, 43% moved from this county. Out of people who lived in different houses, 29% moved from different county within same state. Out of people who lived in different houses, 31% moved from abroad.
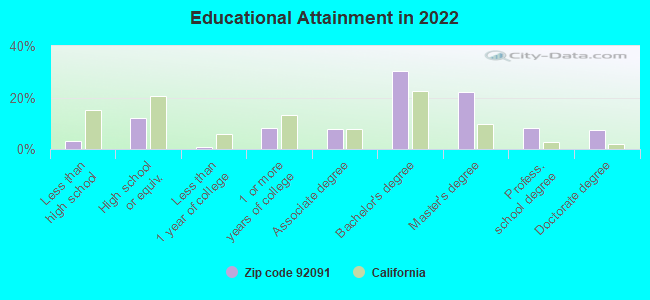
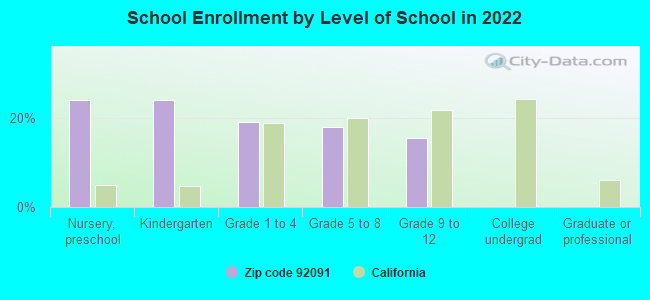
Private vs. public school enrollment:
Students in private schools in grades 1 to 8 (elementary and middle school):
Here:
0.0%
California:
10.5%
Students in private schools in grades 9 to 12 (high school): 7
Here:
24.6%
California:
8.5%
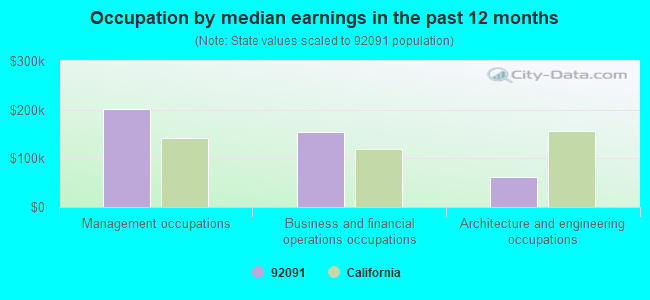
Occupation by median earnings in the past 12 months ($)
201,682Management occupations
153,160Business and financial operations occupations
61,529Architecture and engineering occupations
Top industries in this zip code by the number of employees in 2005:
Real Estate and Rental and Leasing: Offices of Real Estate Agents and Brokers (100-249 employees: 1 establishment, 1-4 employees: 4 establishments)
Accommodation and Food Services: Full-Service Restaurants (50-99: 1, 10-19: 1)
Utilities: Water Supply and Irrigation Systems (10-19: 1)
Health Care and Social Assistance: Offices of Dentists (10-19: 1)
Accommodation and Food Services: Limited-Service Restaurants (5-9: 1)
Professional, Scientific, and Technical Services: Architectural Services (5-9: 1)
Health Care and Social Assistance: Offices of Physicians (except Mental Health Specialists) (1-4: 3)
Administrative and Support and Waste Management and Remediation Services: Office Administrative Services (1-4: 2)
Professional, Scientific, and Technical Services: Administrative Management and General Management Consulting Services (1-4: 2)
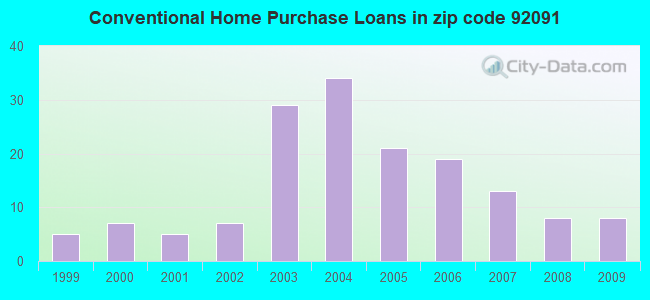
Home Mortgage Disclosure Act Aggregated Statistics For Year 2009 (Based on 4 partial tracts)
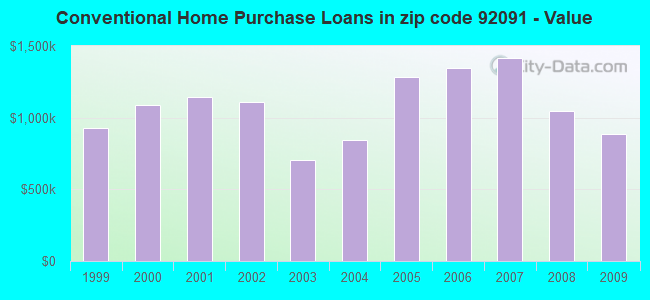
B) Conventional Home Purchase Loans
C) Refinancings
D) Home Improvement Loans
F) Non-occupant Loans on < 5 Family Dwellings (A B C & D)
Number
Average Value
Number
Average Value
Number
Average Value
Number
Average Value
LOANS ORIGINATED
8
$884,210
24
$800,415
1
$1,077,530
2
$813,330
APPLICATIONS APPROVED, NOT ACCEPTED
1
$1,071,410
3
$780,897
0
$0
0
$0
APPLICATIONS DENIED
2
$984,460
8
$1,042,414
0
$0
1
$412,780
APPLICATIONS WITHDRAWN
1
$1,926,090
7
$921,693
0
$0
0
$0
FILES CLOSED FOR INCOMPLETENESS
0
$0
1
$1,273,220
0
$0
0
$0
Aggregated Statistics For Year 2008 (Based on 4 partial tracts)
B) Conventional Home Purchase Loans
C) Refinancings
D) Home Improvement Loans
F) Non-occupant Loans on < 5 Family Dwellings (A B C & D)
Number
Average Value
Number
Average Value
Number
Average Value
Number
Average Value
LOANS ORIGINATED
8
$1,049,421
11
$1,240,340
0
$0
1
$2,434,400
APPLICATIONS APPROVED, NOT ACCEPTED
2
$1,197,335
2
$1,060,695
0
$0
0
$0
APPLICATIONS DENIED
2
$1,228,685
5
$1,315,474
1
$534,530
0
$0
APPLICATIONS WITHDRAWN
2
$975,295
3
$1,029,613
0
$0
0
$0
FILES CLOSED FOR INCOMPLETENESS
0
$0
0
$0
0
$0
0
$0
Aggregated Statistics For Year 2007 (Based on 4 partial tracts)
B) Conventional Home Purchase Loans
C) Refinancings
D) Home Improvement Loans
F) Non-occupant Loans on < 5 Family Dwellings (A B C & D)
Number
Average Value
Number
Average Value
Number
Average Value
Number
Average Value
LOANS ORIGINATED
13
$1,418,805
20
$1,450,232
1
$1,136,820
4
$1,412,542
APPLICATIONS APPROVED, NOT ACCEPTED
3
$1,677,807
4
$1,212,658
0
$0
0
$0
APPLICATIONS DENIED
4
$1,477,830
9
$1,610,558
1
$690,470
1
$2,120,250
APPLICATIONS WITHDRAWN
2
$1,579,515
4
$1,616,790
0
$0
1
$1,605,850
FILES CLOSED FOR INCOMPLETENESS
1
$691,450
1
$1,030,880
0
$0
0
$0
Aggregated Statistics For Year 2006 (Based on 4 partial tracts)
B) Conventional Home Purchase Loans
C) Refinancings
D) Home Improvement Loans
F) Non-occupant Loans on < 5 Family Dwellings (A B C & D)
Number
Average Value
Number
Average Value
Number
Average Value
Number
Average Value
LOANS ORIGINATED
19
$1,348,057
25
$1,171,059
2
$985,910
3
$1,321,890
APPLICATIONS APPROVED, NOT ACCEPTED
5
$1,106,934
5
$1,018,632
0
$0
1
$664,930
APPLICATIONS DENIED
7
$1,315,621
9
$1,283,299
1
$1,118,750
1
$1,418,040
APPLICATIONS WITHDRAWN
3
$1,441,653
5
$1,373,224
0
$0
0
$0
FILES CLOSED FOR INCOMPLETENESS
1
$633,080
1
$915,180
0
$0
0
$0
Aggregated Statistics For Year 2005 (Based on 4 partial tracts)
B) Conventional Home Purchase Loans
C) Refinancings
D) Home Improvement Loans
F) Non-occupant Loans on < 5 Family Dwellings (A B C & D)
Number
Average Value
Number
Average Value
Number
Average Value
Number
Average Value
LOANS ORIGINATED
21
$1,287,183
29
$1,127,929
2
$766,585
4
$1,114,280
APPLICATIONS APPROVED, NOT ACCEPTED
3
$1,466,013
5
$1,072,218
1
$430,630
1
$736,000
APPLICATIONS DENIED
4
$1,402,008
8
$1,008,445
1
$654,930
1
$918,950
APPLICATIONS WITHDRAWN
4
$1,526,202
7
$1,101,464
0
$0
1
$495,060
FILES CLOSED FOR INCOMPLETENESS
1
$1,200,990
2
$693,940
0
$0
0
$0
Aggregated Statistics For Year 2004 (Based on 4 partial tracts)
B) Conventional Home Purchase Loans
C) Refinancings
D) Home Improvement Loans
F) Non-occupant Loans on < 5 Family Dwellings (A B C & D)
Number
Average Value
Number
Average Value
Number
Average Value
Number
Average Value
LOANS ORIGINATED
34
$841,351
41
$907,607
1
$1,059,520
4
$817,388
APPLICATIONS APPROVED, NOT ACCEPTED
6
$892,078
6
$891,702
0
$0
1
$568,690
APPLICATIONS DENIED
7
$822,334
8
$1,204,996
1
$890,820
1
$916,910
APPLICATIONS WITHDRAWN
5
$994,986
6
$914,708
0
$0
0
$0
FILES CLOSED FOR INCOMPLETENESS
1
$505,880
2
$798,160
0
$0
0
$0
Aggregated Statistics For Year 2003 (Based on 4 partial tracts)
B) Conventional Home Purchase Loans
C) Refinancings
F) Non-occupant Loans on < 5 Family Dwellings (A B C & D)
Number
Average Value
Number
Average Value
Number
Average Value
LOANS ORIGINATED
29
$701,327
59
$807,057
4
$758,770
APPLICATIONS APPROVED, NOT ACCEPTED
4
$800,605
7
$741,101
0
$0
APPLICATIONS DENIED
5
$891,004
10
$908,699
0
$0
APPLICATIONS WITHDRAWN
3
$871,123
7
$713,539
0
$0
FILES CLOSED FOR INCOMPLETENESS
1
$594,570
2
$863,675
0
$0
Aggregated Statistics For Year 2002 (Based on 2 partial tracts)
B) Conventional Home Purchase Loans
C) Refinancings
F) Non-occupant Loans on < 5 Family Dwellings (A B C & D)
Number
Average Value
Number
Average Value
Number
Average Value
LOANS ORIGINATED
7
$1,109,646
34
$924,051
2
$815,615
APPLICATIONS APPROVED, NOT ACCEPTED
2
$1,025,980
4
$962,830
0
$0
APPLICATIONS DENIED
2
$1,300,675
4
$1,100,745
0
$0
APPLICATIONS WITHDRAWN
2
$926,570
3
$763,133
0
$0
FILES CLOSED FOR INCOMPLETENESS
0
$0
1
$1,045,070
0
$0
Aggregated Statistics For Year 2001 (Based on 2 partial tracts)
B) Conventional Home Purchase Loans
C) Refinancings
F) Non-occupant Loans on < 5 Family Dwellings (A B C & D)
Number
Average Value
Number
Average Value
Number
Average Value
LOANS ORIGINATED
5
$1,142,696
16
$951,144
1
$660,870
APPLICATIONS APPROVED, NOT ACCEPTED
1
$870,160
3
$751,253
0
$0
APPLICATIONS DENIED
1
$1,264,710
3
$912,277
0
$0
APPLICATIONS WITHDRAWN
1
$462,130
2
$852,855
0
$0
FILES CLOSED FOR INCOMPLETENESS
0
$0
1
$1,023,830
0
$0
Aggregated Statistics For Year 2000 (Based on 2 partial tracts)
B) Conventional Home Purchase Loans
C) Refinancings
D) Home Improvement Loans
F) Non-occupant Loans on < 5 Family Dwellings (A B C & D)
Number
Average Value
Number
Average Value
Number
Average Value
Number
Average Value
LOANS ORIGINATED
7
$1,089,939
4
$874,738
1
$243,510
1
$1,033,190
APPLICATIONS APPROVED, NOT ACCEPTED
2
$1,195,600
1
$677,490
0
$0
0
$0
APPLICATIONS DENIED
2
$1,138,210
2
$777,395
0
$0
0
$0
APPLICATIONS WITHDRAWN
1
$1,999,940
1
$850,760
0
$0
0
$0
FILES CLOSED FOR INCOMPLETENESS
1
$1,096,030
0
$0
0
$0
0
$0
Aggregated Statistics For Year 1999 (Based on 1 partial tract)
B) Conventional Home Purchase Loans
C) Refinancings
F) Non-occupant Loans on < 5 Family Dwellings (A B C & D)

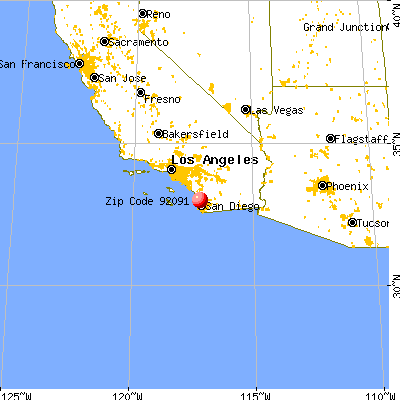


 Nearest zip codes: 92075, 92007, 92024, 92014, 92067, 92130.