Estimated zip code population in 2022: 4,791 Zip code population in 2010: 4,677 Zip code population in 2000: 3,859
Houses and condos: 5,471 Renter-occupied apartments: 578
% of renters here:
22%
State:
44%
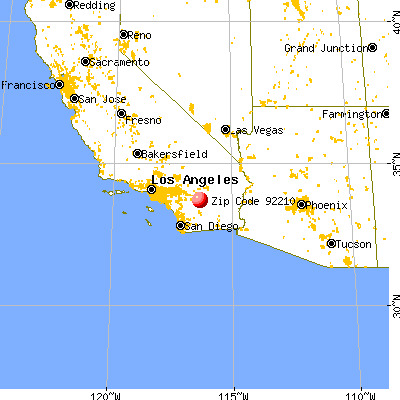
March 2022 cost of living index in zip code 92210: 82.3 (low, U.S. average is 100)
Land area: 13.1 sq. mi. Water area: 0.2 sq. mi.
Population density: 367 people per square mile
(very low).
OSM Map
General Map
Google Map
MSN Map
OSM Map
General Map
Google Map
MSN Map
OSM Map
General Map
Google Map
MSN Map
OSM Map
General Map
Google Map
MSN Map
Please wait while loading the map...
Real estate property taxes paid for housing units in 2022:
This zip code:
1.0% ($9,916)
California:
0.7% ($4,831)
Median real estate property taxes paid for housing units with mortgages in 2022: $9,821 (1.0%) Median real estate property taxes paid for housing units with no mortgage in 2022: $10,304 (0.9%)
Estimated median house/condo value in 2022: $1,022,001
92210:
$1,022,001
California:
$715,900
According to our research of California and other state lists, there were 3 registered sex offenders living in 92210 zip code as of May 28, 2024. The ratio of all residents to sex offenders in zip code 92210 is 1,686 to 1. The ratio of registered sex offenders to all residents in this zip code is much lower than the state average.
Median resident age:
This zip code:
69.4 years
California median age:
37.9 years
Average household size:
This zip code:
1.8 people
California:
2.8 people
Averages for the 2020 tax year for zip code 92210, filed in 2021:
Average Adjusted Gross Income (AGI) in 2020: $260,127 (Individual Income Tax Returns)
Here:
$260,127
State:
$95,910
Salary/wage: $119,438 (reported on 49.3% of returns)
Here:
$119,438
State:
$77,331
(% of AGI for various income ranges: 1089.5% for AGIs below $25k, 2695.4% for AGIs $25k-50k, 6881.4% for AGIs $50k-75k, 7752.0% for AGIs $75k-100k, 15376.9% for AGIs $100k-200k, 97300.0% for AGIs over 200k)
Taxable interest for individuals: $9,967 (reported on 69.6% of returns)
This zip code:
$9,967
California:
$2,294
(% of AGI for various income ranges: 96.8% for AGIs below $25k, 223.1% for AGIs $25k-50k, 560.0% for AGIs $50k-75k, 1080.0% for AGIs $75k-100k, 1645.4% for AGIs $100k-200k, 12008.9% for AGIs over 200k)
Ordinary dividends: $27,560 (reported on 56.0% of returns)
Here:
$27,560
State:
$10,949
(% of AGI for various income ranges: 325.3% for AGIs below $25k, 628.5% for AGIs $25k-50k, 1174.3% for AGIs $50k-75k, 3710.0% for AGIs $75k-100k, 3484.6% for AGIs $100k-200k, 25920.0% for AGIs over 200k)
Net capital gain/loss in AGI: +$107,772 (reported on 56.0% of returns)
Here:
+$107,772
State:
+$49,306
(% of AGI for various income ranges: 3.2% for AGIs below $25k, 362.3% for AGIs $25k-50k, 1402.9% for AGIs $50k-75k, 1992.0% for AGIs $75k-100k, 3903.8% for AGIs $100k-200k, 130540.0% for AGIs over 200k)
Profit/loss from business: +$30,106 (reported on 25.6% of returns)
Here:
+$30,106
State:
+$15,671
(% of AGI for various income ranges: 227.9% for AGIs below $25k, 655.4% for AGIs $25k-50k, 942.9% for AGIs $50k-75k, 2788.0% for AGIs $75k-100k, 3246.2% for AGIs $100k-200k, 9330.0% for AGIs over 200k)
Taxable individual retirement arrangement distribution: $50,429 (reported on 24.6% of returns)
92210:
$50,429
California:
$23,505
(% of AGI for various income ranges: 181.1% for AGIs below $25k, 562.3% for AGIs $25k-50k, 1740.0% for AGIs $50k-75k, 2614.0% for AGIs $75k-100k, 4926.9% for AGIs $100k-200k, 17460.0% for AGIs over 200k)
Self-employed (Keogh) retirement plans: $42,286 (reported on 3.4% of returns)
92210:
$42,286
California:
$30,163
(% of AGI for various income ranges: 603.8% for AGIs $100k-200k, 2416.7% for AGIs over 200k)
Total itemized deductions: $53,025 (reported on 39.1% of returns)
Here:
$53,025
State:
$39,517
(% of AGI for various income ranges: 717.9% for AGIs below $25k, 1481.5% for AGIs $25k-50k, 3754.3% for AGIs $50k-75k, 3928.0% for AGIs $75k-100k, 6072.3% for AGIs $100k-200k, 30193.3% for AGIs over 200k)
Charity contributions: $20,596 (reported on 34.3% of returns)
Here:
$20,596
State:
$12,598
(% of AGI for various income ranges: 47.4% for AGIs below $25k, 86.9% for AGIs $25k-50k, 501.4% for AGIs $50k-75k, 698.0% for AGIs $75k-100k, 1135.4% for AGIs $100k-200k, 13604.4% for AGIs over 200k)
Taxes paid: $9,054 (reported on 39.1% of returns)
92210:
$9,054
State:
$8,807
(% of AGI for various income ranges: 153.7% for AGIs below $25k, 344.6% for AGIs $25k-50k, 801.4% for AGIs $50k-75k, 1218.0% for AGIs $75k-100k, 1503.8% for AGIs $100k-200k, 3854.4% for AGIs over 200k)
Earned income credit: $1,556 (reported on 4.3% of returns)
Here:
$1,556
State:
$2,074
(% of AGI for various income ranges: 73.7% for AGIs below $25k)
Percentage of individuals using paid preparers for their 2020 taxes: 90.8%
Here:
91%
State:
92%
(% for various income ranges: 82.6% for AGIs below $25k, 92.6% for AGIs $25k-50k, 94.7% for AGIs $50k-75k, 89.5% for AGIs $75k-100k, 93.3% for AGIs $100k-200k, 94.1% for AGIs over 200k)
Averages for the 2012 tax year for zip code 92210, filed in 2013:
Average Adjusted Gross Income (AGI) in 2012: $247,870 (Individual Income Tax Returns)
Here:
$247,870
State:
$72,726
Salary/wage: $93,405 (reported on 45.6% of returns)
Here:
$93,405
State:
$59,079
(% of AGI for various income ranges: 36.7% for AGIs below $25k, 41.3% for AGIs $25k-50k, 36.3% for AGIs $50k-75k, 28.9% for AGIs $75k-100k, 27.7% for AGIs $100k-200k, 13.4% for AGIs over 200k)
Taxable interest for individuals: $16,117 (reported on 70.6% of returns)
This zip code:
$16,117
California:
$2,146
(% of AGI for various income ranges: 6.5% for AGIs below $25k, 5.4% for AGIs $25k-50k, 5.1% for AGIs $50k-75k, 4.8% for AGIs $75k-100k, 4.2% for AGIs $100k-200k, 4.6% for AGIs over 200k)
Ordinary dividends: $28,445 (reported on 56.7% of returns)
Here:
$28,445
State:
$9,308
(% of AGI for various income ranges: 13.5% for AGIs below $25k, 9.2% for AGIs $25k-50k, 7.8% for AGIs $50k-75k, 8.9% for AGIs $75k-100k, 8.4% for AGIs $100k-200k, 5.9% for AGIs over 200k)
Net capital gain/loss in AGI: +$75,895 (reported on 56.7% of returns)
Here:
+$75,895
State:
+$30,460
(% of AGI for various income ranges: 0.7% for AGIs $25k-50k, 1.3% for AGIs $50k-75k, 1.1% for AGIs $75k-100k, 5.3% for AGIs $100k-200k, 21.3% for AGIs over 200k)
Profit/loss from business: +$31,883 (reported on 22.8% of returns)
Here:
+$31,883
State:
+$17,064
(% of AGI for various income ranges: 14.0% for AGIs below $25k, 12.7% for AGIs $25k-50k, 4.5% for AGIs $50k-75k, 9.1% for AGIs $75k-100k, 6.3% for AGIs $100k-200k, 1.6% for AGIs over 200k)
Taxable individual retirement arrangement distribution: $38,367 (reported on 33.3% of returns)
92210:
$38,367
California:
$19,557
(% of AGI for various income ranges: 11.8% for AGIs below $25k, 11.4% for AGIs $25k-50k, 10.6% for AGIs $50k-75k, 14.2% for AGIs $75k-100k, 12.8% for AGIs $100k-200k, 3.1% for AGIs over 200k)
Self-employment retirement plans: $36,920 (reported on 2.8% of returns)
92210:
$36,920
California:
$24,530
Total itemized deductions: $63,641 (19% of AGI, reported on 71.1% of returns)
Here:
$63,641
State:
$34,004
Here:
19.0% of AGI
State:
22.7% of AGI
(% of AGI for various income ranges: 65.4% for AGIs below $25k, 41.5% for AGIs $25k-50k, 34.4% for AGIs $50k-75k, 33.4% for AGIs $75k-100k, 31.0% for AGIs $100k-200k, 13.7% for AGIs over 200k)
Charity contributions: $11,427 (reported on 62.8% of returns)
Here:
$11,427
State:
$4,659
(% of AGI for various income ranges: 3.9% for AGIs below $25k, 3.0% for AGIs $25k-50k, 3.6% for AGIs $50k-75k, 4.0% for AGIs $75k-100k, 3.2% for AGIs $100k-200k, 2.8% for AGIs over 200k)
Taxes paid: $34,527 (reported on 69.4% of returns)
92210:
$34,527
State:
$14,448
(% of AGI for various income ranges: 16.5% for AGIs below $25k, 13.8% for AGIs $25k-50k, 10.1% for AGIs $50k-75k, 12.2% for AGIs $75k-100k, 11.0% for AGIs $100k-200k, 9.1% for AGIs over 200k)
Earned income credit: $1,083 (reported on 3.3% of returns)
Here:
$1,083
State:
$2,286
(% of AGI for various income ranges: 1.3% for AGIs below $25k)
Percentage of individuals using paid preparers for their 2012 taxes: 78.3%
Here:
78%
State:
64%
(% for various income ranges: 65.9% for AGIs below $25k, 69.2% for AGIs $25k-50k, 75.0% for AGIs $50k-75k, 83.3% for AGIs $75k-100k, 84.2% for AGIs $100k-200k, 94.1% for AGIs over 200k)
Averages for the 2004 tax year for zip code 92210, filed in 2005:
Average Adjusted Gross Income (AGI) in 2004: $222,687 (Individual Income Tax Returns)
Here:
$222,687
State:
$58,600
Salary/wage: $110,048 (reported on 49.0% of returns)
Here:
$110,048
State:
$49,455
(% of AGI for various income ranges: 42.1% for AGIs $10k-25k, 41.1% for AGIs $25k-50k, 27.2% for AGIs $50k-75k, 25.9% for AGIs $75k-100k, 22.1% for AGIs over 100k)
Taxable interest for individuals: $11,796 (reported on 78.9% of returns)
This zip code:
$11,796
California:
$2,365
(% of AGI for various income ranges: 11.4% for AGIs $10k-25k, 7.4% for AGIs $25k-50k, 8.1% for AGIs $50k-75k, 6.5% for AGIs $75k-100k, 3.5% for AGIs over 100k)
Taxable dividends: $28,175 (reported on 61.6% of returns)
Here:
$28,175
State:
$4,746
(% of AGI for various income ranges: 10.5% for AGIs $10k-25k, 7.4% for AGIs $25k-50k, 8.1% for AGIs $50k-75k, 6.5% for AGIs $75k-100k, 7.4% for AGIs over 100k)
Net capital gain/loss: +$98,056 (reported on 64.0% of returns)
Here:
+$98,056
State:
+$23,418
(% of AGI for various income ranges: -0.0% for AGIs $10k-25k, 2.3% for AGIs $25k-50k, 5.2% for AGIs $50k-75k, 5.9% for AGIs $75k-100k, 29.3% for AGIs over 100k)
Profit/loss from business: +$41,179 (reported on 26.0% of returns)
Here:
+$41,179
State:
+$16,826
(% of AGI for various income ranges: 10.4% for AGIs $10k-25k, 14.4% for AGIs $25k-50k, 10.8% for AGIs $50k-75k, 11.4% for AGIs $75k-100k, 3.8% for AGIs over 100k)
IRA payment deduction: $4,051 (reported on 3.8% of returns)
92210:
$4,051
California:
$3,192
Self-employed pension: $33,988 (reported on 4.1% of returns)
Here:
$33,988
California:
$17,688
Total itemized deductions: $81,779 (25% of AGI, reported on 69.3% of returns)
Here:
$81,779
State:
$28,113
Here:
25.3% of AGI
State:
25.3% of AGI
(% of AGI for various income ranges: 48.2% for AGIs $10k-25k, 41.3% for AGIs $25k-50k, 34.8% for AGIs $50k-75k, 37.6% for AGIs $75k-100k, 22.8% for AGIs over 100k)
Charity contributions deductions: $17,026 (5% of AGI, reported on 64.0% of returns)
Here:
$17,026
State:
$3,923
Here:
5.4% of AGI
State:
3.3% of AGI
(% of AGI for various income ranges: 4.0% for AGIs $10k-25k, 4.4% for AGIs $25k-50k, 3.9% for AGIs $50k-75k, 4.3% for AGIs $75k-100k, 4.8% for AGIs over 100k)
Total tax: $47,003 (reported on 81.8% of returns)
92210:
$47,003
State:
$10,761
(% of AGI for various income ranges: 4.9% for AGIs $10k-25k, 7.9% for AGIs $25k-50k, 9.6% for AGIs $50k-75k, 10.8% for AGIs $75k-100k, 17.5% for AGIs over 100k)
Earned income credit: $1,000 (reported on 2.9% of returns)
Here:
$1,000
State:
$1,763
Percentage of individuals using paid preparers for their 2004 taxes: 83.5%
Here:
83%
State:
66%
(% for various income ranges: 79.6% for AGIs below $10k, 74.3% for AGIs $10k-25k, 77.6% for AGIs $25k-50k, 81.7% for AGIs $50k-75k, 83.8% for AGIs $75k-100k, 91.1% for AGIs over 100k)
Likely homosexual households (counted as self-reported same-sex unmarried-partner households)
Lesbian couples: 0.0% of all households
Gay men: 0.6% of all households
Household received Food Stamps/SNAP in the past 12 months: 203 Household did not receive Food Stamps/SNAP in the past 12 months: 2,394
Women who had a birth in the past 12 months: 14 (14 now married, 0 unmarried) Women who did not have a birth in the past 12 months: 223 (129 now married, 92 unmarried)
Housing units in zip code 92210 with a mortgage: 829 (57 second mortgage, 60 both second mortgage and home equity loan) Median monthly owner costs for units with a mortgage: $3,778 Median monthly owner costs for units without a mortgage: $1,556
Residents with income below the poverty level in 2022:
This zip code:
4.8%
Whole state:
12.2%
Residents with income below 50% of the poverty level in 2022:
This zip code:
2.3%
Whole state:
6.2%
Median number of rooms in houses and condos:
Here:
6.4
State:
6.0
Median number of rooms in apartments:
Here:
3.2
State:
3.9
Notable locations in this zip code not listed on our city pages
Notable locations in zip code 92210: Desert Horizons Country Club (A), Indian Wells Country Club (B), Indian Wells Golf Course (C), El Dorado Golf Course (D), Indian Wells City Hall (E), Riverside County Fire Department Station 55 Indian Wells (F). Display/hide their locations on the map
In group quarters: 10 (-1 institutionalized population)
Size of family households: 1,369 2-persons, 46 3-persons, 76 4-persons, 10 5-persons, 11 6-persons, 20 7-or-more-persons
Size of nonfamily households: 856 1-person, 273 2-persons
255 married couples with children.
3 single-parent households (3 women).
95.8% of residents of 92210 zip code speak English at home.
1.2% of residents speak Spanish at home (100% very well).
2.4% of residents speak other Indo-European language at home (79% very well, 21% well).
2.3% of residents speak Asian or Pacific Island language at home (58% very well, 21% well, 21% not well).
Foreign born population: 388 (8.1%) (51.1% of them are naturalized citizens)
This zip code:
8.1%
Whole state:
26.7%
20%Sweden
17%Malaysia
13%United Kingdom, excluding England and Scotland
4%India
3%North Macedonia (Macedonia)
3%Cambodia
3%Honduras
17%English
9%Irish
7%Italian
7%German
6%American
6%Scottish
3%Canadian
Year of entry for the foreign-born population
972010 or later
372000 to 2009
611990 to 1999
251Before 1990
Facilities with environmental interests located in this zip code:
HYATT GRAND CHAMPIONS (44600 INDIAN WELLS LN in INDIAN WELLS, CA)
STATE MASTER (California - Hazardous Waste Tracking) - HAZARDOU WASTE PROGRAM Small Quantity Generators, between 100 kg and 1000 kg of hazardous waste/month (Resource Conservation and Recovery Act (tracking hazardous waste)) - notification Organizations: HYATT CORP AGENT GRANDCHAMP (CONTACT/OWNER)
INDIAN WELLS GOLF RESORT (77075 FRED WARING in INDIAN WELLS, CA)
Small Quantity Generators, between 100 kg and 1000 kg of hazardous waste/month (Resource Conservation and Recovery Act (tracking hazardous waste)) - notification Organizations: AMERICAN GOLF CORP/MIKE DIAS (CONTACT/OWNER)
FUJI PHOTO FILM U S A INC (4400 INDIAN WELLS LN in INDIAN WELLS, CA)
Small Quantity Generators, between 100 kg and 1000 kg of hazardous waste/month (Resource Conservation and Recovery Act (tracking hazardous waste)) - notification
Housing units lacking complete plumbing facilities: 1.2% Housing units lacking complete kitchen facilities: 1.8%
65.6%Utility gas
22.3%Electricity
11.0%Solar energy
0.6%Bottled, tank, or LP gas
0.6%Wood
Population in 1990: 2,599. Population change in the 1990s: +1,260 (+48.5%).
Place of birth for U.S.-born residents:
This state: 1,570
Northeast: 754
Midwest: 994
South: 446
West: 490
52% of the 92210 zip code residents lived in the same house 5 years ago. Out of people who lived in different houses, 44% lived in this county. Out of people who lived in different counties, 50% lived in California.
82% of the 92210 zip code residents lived in the same house 1 year ago. Out of people who lived in different houses, 24% moved from this county. Out of people who lived in different houses, 34% moved from different county within same state. Out of people who lived in different houses, 33% moved from different state. Out of people who lived in different houses, 10% moved from abroad.
Private vs. public school enrollment:
Students in private schools in grades 1 to 8 (elementary and middle school): 33
Here:
25.6%
California:
10.5%
Students in private schools in grades 9 to 12 (high school): 7
Here:
9.0%
California:
8.5%
Students in private undergraduate colleges: 2
Here:
12.8%
California:
15.9%
Occupation by median earnings in the past 12 months ($)
237,352Legal occupations
111,523Business and financial operations occupations
88,028Sales and related occupations
87,131Management occupations
66,216Education, training, and library occupations
60,600Health diagnosing and treating practitioners and other technical occupations
Top industries in this zip code by the number of employees in 2005:
Other Services (except Public Administration): Other Similar Organizations (except Business, Professional, Labor, and Political Organizations) (50-99: 1, 10-19: 2, 1-4: 1)
Other Services (except Public Administration): Parking Lots and Garages (50-99: 1, 10-19: 1)
Real Estate and Rental and Leasing: Other Activities Related to Real Estate (50-99: 1, 5-9: 1, 1-4: 3)
People in group quarters in 2010:
6 people in group homes intended for adults
Fatal accident statistics in 2014:
Fatal accident count: 1
Vehicles involved in fatal accidents: 3
Fatal accidents caused by drunken drivers: 1
Fatalities: 1
Persons involved in fatal accidents: 4
Pedestrians involved in fatal accidents: 0
Fatal accident statistics in 2013:
Fatal accident count: 1
Vehicles involved in fatal accidents: 1
Fatal accidents caused by drunken drivers: 0
Fatalities: 1
Persons involved in fatal accidents: 2
Pedestrians involved in fatal accidents: 0
Home Mortgage Disclosure Act Aggregated Statistics For Year 2009 (Based on 2 full and 8 partial tracts)
A) FHA, FSA/RHS & VA Home Purchase Loans
B) Conventional Home Purchase Loans
C) Refinancings
D) Home Improvement Loans
F) Non-occupant Loans on < 5 Family Dwellings (A B C & D)
G) Loans On Manufactured Home Dwelling (A B C & D)
Number
Average Value
Number
Average Value
Number
Average Value
Number
Average Value
Number
Average Value
Number
Average Value
LOANS ORIGINATED
94
$167,109
214
$329,907
595
$373,176
7
$159,663
333
$421,928
29
$203,917
APPLICATIONS APPROVED, NOT ACCEPTED
8
$176,789
34
$311,623
67
$319,907
5
$68,704
38
$373,121
3
$247,803
APPLICATIONS DENIED
29
$146,784
43
$341,344
227
$483,393
23
$189,391
100
$578,137
12
$144,104
APPLICATIONS WITHDRAWN
16
$150,810
47
$369,451
178
$377,099
9
$83,508
65
$464,513
9
$135,861
FILES CLOSED FOR INCOMPLETENESS
5
$157,880
10
$240,785
49
$317,403
1
$200,000
21
$311,945
1
$220,870
Aggregated Statistics For Year 2008 (Based on 2 full and 8 partial tracts)
A) FHA, FSA/RHS & VA Home Purchase Loans
B) Conventional Home Purchase Loans
C) Refinancings
D) Home Improvement Loans
F) Non-occupant Loans on < 5 Family Dwellings (A B C & D)
G) Loans On Manufactured Home Dwelling (A B C & D)
Number
Average Value
Number
Average Value
Number
Average Value
Number
Average Value
Number
Average Value
Number
Average Value
LOANS ORIGINATED
55
$173,423
326
$426,828
349
$519,739
30
$286,562
311
$592,278
20
$195,744
APPLICATIONS APPROVED, NOT ACCEPTED
1
$261,180
51
$502,025
82
$435,467
10
$22,425
42
$582,881
12
$155,248
APPLICATIONS DENIED
11
$250,236
83
$539,552
295
$432,934
49
$165,241
88
$560,994
16
$203,799
APPLICATIONS WITHDRAWN
9
$186,356
51
$1,172,334
132
$438,647
19
$450,749
55
$505,731
9
$182,094
FILES CLOSED FOR INCOMPLETENESS
1
$208,000
11
$360,427
39
$390,624
6
$1,612,612
11
$870,244
4
$187,275
Aggregated Statistics For Year 2007 (Based on 2 full and 8 partial tracts)
A) FHA, FSA/RHS & VA Home Purchase Loans
B) Conventional Home Purchase Loans
C) Refinancings
D) Home Improvement Loans
E) Loans on Dwellings For 5+ Families
F) Non-occupant Loans on < 5 Family Dwellings (A B C & D)
G) Loans On Manufactured Home Dwelling (A B C & D)
Number
Average Value
Number
Average Value
Number
Average Value
Number
Average Value
Number
Average Value
Number
Average Value
Number
Average Value
LOANS ORIGINATED
11
$242,154
657
$519,936
871
$476,292
103
$340,752
1
$24,550,000
532
$627,007
64
$196,024
APPLICATIONS APPROVED, NOT ACCEPTED
3
$190,633
140
$470,918
228
$408,574
24
$227,098
0
$0
96
$479,969
15
$191,487
APPLICATIONS DENIED
6
$232,717
215
$354,777
577
$409,996
107
$203,137
0
$0
147
$459,340
60
$198,615
APPLICATIONS WITHDRAWN
0
$0
97
$410,724
248
$422,268
33
$204,068
0
$0
79
$623,342
10
$201,198
FILES CLOSED FOR INCOMPLETENESS
2
$227,255
26
$421,557
97
$359,493
9
$112,470
0
$0
17
$282,438
2
$164,180
Aggregated Statistics For Year 2006 (Based on 2 full and 8 partial tracts)
A) FHA, FSA/RHS & VA Home Purchase Loans
B) Conventional Home Purchase Loans
C) Refinancings
D) Home Improvement Loans
F) Non-occupant Loans on < 5 Family Dwellings (A B C & D)
G) Loans On Manufactured Home Dwelling (A B C & D)
Number
Average Value
Number
Average Value
Number
Average Value
Number
Average Value
Number
Average Value
Number
Average Value
LOANS ORIGINATED
22
$232,639
998
$447,314
1,112
$433,918
132
$302,825
602
$606,543
83
$198,566
APPLICATIONS APPROVED, NOT ACCEPTED
0
$0
188
$357,246
224
$371,343
21
$412,280
81
$401,499
15
$180,965
APPLICATIONS DENIED
1
$238,950
330
$381,026
613
$362,888
121
$197,705
127
$431,564
61
$205,651
APPLICATIONS WITHDRAWN
3
$242,233
160
$396,533
432
$386,629
30
$347,530
65
$458,784
16
$188,588
FILES CLOSED FOR INCOMPLETENESS
0
$0
38
$492,465
109
$258,152
9
$117,143
17
$348,096
8
$206,801
Aggregated Statistics For Year 2005 (Based on 2 full and 8 partial tracts)
A) FHA, FSA/RHS & VA Home Purchase Loans
B) Conventional Home Purchase Loans
C) Refinancings
D) Home Improvement Loans
F) Non-occupant Loans on < 5 Family Dwellings (A B C & D)
G) Loans On Manufactured Home Dwelling (A B C & D)
Number
Average Value
Number
Average Value
Number
Average Value
Number
Average Value
Number
Average Value
Number
Average Value
LOANS ORIGINATED
21
$188,159
1,548
$426,486
1,408
$362,898
140
$236,884
897
$469,622
80
$181,442
APPLICATIONS APPROVED, NOT ACCEPTED
2
$128,490
192
$411,716
191
$316,566
22
$209,478
75
$379,837
19
$115,461
APPLICATIONS DENIED
4
$277,272
304
$388,172
505
$304,608
107
$152,831
127
$351,948
83
$178,674
APPLICATIONS WITHDRAWN
1
$145,290
241
$476,357
397
$295,058
43
$155,384
96
$476,155
22
$184,430
FILES CLOSED FOR INCOMPLETENESS
0
$0
44
$372,682
146
$287,083
8
$170,625
20
$297,478
11
$197,449
Aggregated Statistics For Year 2004 (Based on 2 full and 8 partial tracts)
A) FHA, FSA/RHS & VA Home Purchase Loans
B) Conventional Home Purchase Loans
C) Refinancings
D) Home Improvement Loans
E) Loans on Dwellings For 5+ Families
F) Non-occupant Loans on < 5 Family Dwellings (A B C & D)
G) Loans On Manufactured Home Dwelling (A B C & D)
Number
Average Value
Number
Average Value
Number
Average Value
Number
Average Value
Number
Average Value
Number
Average Value
Number
Average Value
LOANS ORIGINATED
23
$177,980
1,461
$352,115
1,444
$297,887
138
$178,687
3
$1,074,007
858
$377,952
84
$163,179
APPLICATIONS APPROVED, NOT ACCEPTED
3
$202,113
162
$316,891
290
$230,888
25
$151,435
0
$0
91
$305,718
28
$141,668
APPLICATIONS DENIED
5
$228,816
260
$348,587
572
$244,713
81
$117,849
0
$0
115
$329,007
55
$135,396
APPLICATIONS WITHDRAWN
2
$198,525
158
$341,476
448
$246,465
32
$151,485
0
$0
87
$323,252
22
$180,288
FILES CLOSED FOR INCOMPLETENESS
0
$0
28
$620,572
152
$225,133
8
$79,332
0
$0
20
$425,252
4
$121,350
Aggregated Statistics For Year 2003 (Based on 2 full and 8 partial tracts)
A) FHA, FSA/RHS & VA Home Purchase Loans
B) Conventional Home Purchase Loans
C) Refinancings
D) Home Improvement Loans
F) Non-occupant Loans on < 5 Family Dwellings (A B C & D)
Number
Average Value
Number
Average Value
Number
Average Value
Number
Average Value
Number
Average Value
LOANS ORIGINATED
53
$130,166
921
$276,921
2,361
$279,850
30
$56,425
811
$342,668
APPLICATIONS APPROVED, NOT ACCEPTED
5
$172,800
99
$297,396
348
$258,687
11
$51,526
86
$368,050
APPLICATIONS DENIED
14
$163,902
128
$177,180
554
$217,167
37
$63,028
85
$298,480
APPLICATIONS WITHDRAWN
8
$162,146
76
$283,709
476
$201,838
8
$481,674
58
$375,033
FILES CLOSED FOR INCOMPLETENESS
1
$148,000
24
$231,091
95
$237,941
6
$63,300
24
$220,386
Aggregated Statistics For Year 2002 (Based on 2 partial tracts)
A) FHA, FSA/RHS & VA Home Purchase Loans
B) Conventional Home Purchase Loans
C) Refinancings
D) Home Improvement Loans
F) Non-occupant Loans on < 5 Family Dwellings (A B C & D)
Number
Average Value
Number
Average Value
Number
Average Value
Number
Average Value
Number
Average Value
LOANS ORIGINATED
8
$161,556
27
$97,075
71
$121,049
3
$29,393
4
$109,595
APPLICATIONS APPROVED, NOT ACCEPTED
0
$0
6
$134,368
17
$120,882
3
$80,620
3
$120,650
APPLICATIONS DENIED
0
$0
18
$88,086
55
$111,510
4
$71,592
1
$154,520
APPLICATIONS WITHDRAWN
2
$76,000
7
$141,326
23
$131,483
2
$15,115
2
$179,295
FILES CLOSED FOR INCOMPLETENESS
0
$0
3
$94,617
13
$135,789
1
$15,960
0
$0
Aggregated Statistics For Year 2001 (Based on 2 partial tracts)
A) FHA, FSA/RHS & VA Home Purchase Loans
B) Conventional Home Purchase Loans
C) Refinancings
D) Home Improvement Loans
F) Non-occupant Loans on < 5 Family Dwellings (A B C & D)
Number
Average Value
Number
Average Value
Number
Average Value
Number
Average Value
Number
Average Value
LOANS ORIGINATED
9
$106,094
22
$123,527
54
$113,078
3
$8,397
7
$85,780
APPLICATIONS APPROVED, NOT ACCEPTED
3
$96,017
8
$104,765
10
$129,329
2
$33,170
0
$0
APPLICATIONS DENIED
2
$134,790
23
$112,277
27
$114,089
6
$23,095
4
$153,682
APPLICATIONS WITHDRAWN
3
$94,337
8
$112,952
22
$103,945
0
$0
2
$110,015
FILES CLOSED FOR INCOMPLETENESS
0
$0
0
$0
8
$88,389
1
$59,630
1
$8,400
Aggregated Statistics For Year 2000 (Based on 2 partial tracts)
A) FHA, FSA/RHS & VA Home Purchase Loans
B) Conventional Home Purchase Loans
C) Refinancings
D) Home Improvement Loans
F) Non-occupant Loans on < 5 Family Dwellings (A B C & D)
Number
Average Value
Number
Average Value
Number
Average Value
Number
Average Value
Number
Average Value
LOANS ORIGINATED
13
$87,985
19
$75,847
18
$106,188
3
$31,073
3
$60,467
APPLICATIONS APPROVED, NOT ACCEPTED
1
$152,840
8
$112,114
12
$136,118
3
$30,793
1
$46,190
APPLICATIONS DENIED
3
$69,143
21
$106,455
42
$97,197
3
$12,597
4
$100,775
APPLICATIONS WITHDRAWN
3
$121,490
6
$82,300
13
$97,805
0
$0
0
$0
FILES CLOSED FOR INCOMPLETENESS
0
$0
1
$104,970
8
$83,455
0
$0
0
$0
Aggregated Statistics For Year 1999 (Based on 3 partial tracts)
A) FHA, FSA/RHS & VA Home Purchase Loans
B) Conventional Home Purchase Loans
C) Refinancings
D) Home Improvement Loans
E) Loans on Dwellings For 5+ Families
F) Non-occupant Loans on < 5 Family Dwellings (A B C & D)
2006 - 2018 National Fire Incident Reporting System (NFIRS) incidents
According to the data from the years 2006 - 2018 the average number of fires per year is 12. The highest number of fire incidents - 24 took place in 2017, and the least - 3 in 2006. The data has an increasing trend.
When looking into fire subcategories, the most incidents belonged to: Outside Fires (36.8%), and Structure Fires (26.5%).
Fire incident types reported to NFIRS in Zip Code 92210


 Nearest zip codes: 92260, 92211, 92253, 92203, 92270, 92276.


 According to the data from the years 2006 - 2018 the average number of fires per year is 12. The highest number of fire incidents - 24 took place in 2017, and the least - 3 in 2006. The data has an increasing trend.
 When looking into fire subcategories, the most incidents belonged to: Outside Fires (36.8%), and Structure Fires (26.5%).