Estimated median house/condo value in 2022: $137,034
92242:
$137,034
California:
$715,900
According to our research of California and other state lists, there were 2 registered sex offenders living in 92242 zip code as of May 28, 2024. The ratio of all residents to sex offenders in zip code 92242 is 676 to 1. The ratio of registered sex offenders to all residents in this zip code is near the state average.
Median resident age:
This zip code:
60.1 years
California median age:
37.9 years
Average household size:
This zip code:
1.9 people
California:
2.8 people
Averages for the 2020 tax year for zip code 92242, filed in 2021:
Average Adjusted Gross Income (AGI) in 2020: $36,294 (Individual Income Tax Returns)
Here:
$36,294
State:
$95,910
Salary/wage: $30,978 (reported on 52.9% of returns)
Here:
$30,978
State:
$77,331
(% of AGI for various income ranges: 914.5% for AGIs below $25k, 2615.7% for AGIs $25k-50k, 9130.0% for AGIs $50k-75k)
Taxable interest for individuals: $757 (reported on 20.6% of returns)
This zip code:
$757
California:
$2,294
(% of AGI for various income ranges: 6.4% for AGIs below $25k, 62.9% for AGIs $25k-50k, 6.7% for AGIs $50k-75k)
Ordinary dividends: $1,075 (reported on 11.8% of returns)
Here:
$1,075
State:
$10,949
(% of AGI for various income ranges: 61.4% for AGIs $25k-50k)
Net capital gain/loss in AGI: +$1,350 (reported on 11.8% of returns)
Here:
+$1,350
State:
+$49,306
(% of AGI for various income ranges: 77.1% for AGIs $25k-50k)
Profit/loss from business: +$3,625 (reported on 11.8% of returns)
Here:
+$3,625
State:
+$15,671
(% of AGI for various income ranges: 131.8% for AGIs below $25k)
Taxable individual retirement arrangement distribution: $8,533 (reported on 8.8% of returns)
92242:
$8,533
California:
$23,505
(% of AGI for various income ranges: 365.7% for AGIs $25k-50k)
Earned income credit: $2,043 (reported on 20.6% of returns)
Here:
$2,043
State:
$2,074
(% of AGI for various income ranges: 130.0% for AGIs below $25k)
Percentage of individuals using paid preparers for their 2020 taxes: 88.2%
Here:
88%
State:
92%
(% for various income ranges: 88.2% for AGIs below $25k, 90.0% for AGIs $25k-50k, 80.0% for AGIs $50k-75k, 100.0% for AGIs $100k-200k)
Averages for the 2012 tax year for zip code 92242, filed in 2013:
Average Adjusted Gross Income (AGI) in 2012: $35,212 (Individual Income Tax Returns)
Here:
$35,212
State:
$72,726
Salary/wage: $29,058 (reported on 58.5% of returns)
Here:
$29,058
State:
$59,079
(% of AGI for various income ranges: 52.9% for AGIs below $25k, 48.4% for AGIs $25k-50k, 85.1% for AGIs $50k-75k)
Taxable interest for individuals: $1,331 (reported on 31.7% of returns)
This zip code:
$1,331
California:
$2,146
(% of AGI for various income ranges: 2.6% for AGIs below $25k, 2.3% for AGIs $25k-50k, 0.3% for AGIs $50k-75k)
Ordinary dividends: $2,000 (reported on 12.2% of returns)
Here:
$2,000
State:
$9,308
Net capital gain/loss in AGI: +$260 (reported on 12.2% of returns)
Here:
+$260
State:
+$30,460
Profit/loss from business: +$6,467 (reported on 14.6% of returns)
Here:
+$6,467
State:
+$17,064
Taxable individual retirement arrangement distribution: $7,120 (reported on 12.2% of returns)
92242:
$7,120
California:
$19,557
Total itemized deductions: $21,389 (33% of AGI, reported on 22.0% of returns)
Here:
$21,389
State:
$34,004
Here:
32.9% of AGI
State:
22.7% of AGI
(% of AGI for various income ranges: 13.8% for AGIs below $25k, 9.8% for AGIs $25k-50k, 27.1% for AGIs $50k-75k)
Charity contributions: $1,929 (reported on 17.1% of returns)
Here:
$1,929
State:
$4,659
Taxes paid: $5,522 (reported on 22.0% of returns)
92242:
$5,522
State:
$14,448
(% of AGI for various income ranges: 1.3% for AGIs below $25k, 2.3% for AGIs $25k-50k, 8.8% for AGIs $50k-75k)
Earned income credit: $1,882 (reported on 26.8% of returns)
Here:
$1,882
State:
$2,286
(% of AGI for various income ranges: 5.6% for AGIs below $25k, 1.0% for AGIs $25k-50k)
Percentage of individuals using paid preparers for their 2012 taxes: 68.3%
Here:
68%
State:
64%
(% for various income ranges: 60.9% for AGIs below $25k, 70.0% for AGIs $25k-50k, 116.7% for AGIs $50k-75k)
Averages for the 2004 tax year for zip code 92242, filed in 2005:
Average Adjusted Gross Income (AGI) in 2004: $34,661 (Individual Income Tax Returns)
Here:
$34,661
State:
$58,600
Salary/wage: $24,027 (reported on 67.3% of returns)
Here:
$24,027
State:
$49,455
(% of AGI for various income ranges: 119.1% for AGIs below $10k, 57.2% for AGIs $10k-25k, 57.7% for AGIs $25k-50k, 69.4% for AGIs $50k-75k, 25.2% for AGIs over 100k)
Taxable interest for individuals: $2,772 (reported on 45.7% of returns)
This zip code:
$2,772
California:
$2,365
(% of AGI for various income ranges: 8.3% for AGIs below $10k, 4.2% for AGIs $10k-25k, 2.4% for AGIs $25k-50k, 3.4% for AGIs $50k-75k, 3.0% for AGIs $75k-100k, 4.3% for AGIs over 100k)
Taxable dividends: $2,103 (reported on 19.8% of returns)
Here:
$2,103
State:
$4,746
(% of AGI for various income ranges: 3.7% for AGIs below $10k, 2.2% for AGIs $10k-25k, 1.4% for AGIs $25k-50k, 0.2% for AGIs $50k-75k, 1.2% for AGIs over 100k)
Net capital gain/loss: +$12,108 (reported on 22.7% of returns)
Here:
+$12,108
State:
+$23,418
(% of AGI for various income ranges: -6.6% for AGIs below $10k, -0.2% for AGIs $10k-25k, 0.9% for AGIs $25k-50k, 5.3% for AGIs $50k-75k, 22.8% for AGIs over 100k)
Profit/loss from business: +$680 (reported on 10.2% of returns)
Here:
+$680
State:
+$16,826
(% of AGI for various income ranges: -38.1% for AGIs below $10k, 3.6% for AGIs $10k-25k, -1.7% for AGIs $25k-50k, 5.0% for AGIs $50k-75k)
Total itemized deductions: $18,886 (26% of AGI, reported on 21.4% of returns)
Here:
$18,886
State:
$28,113
Here:
25.6% of AGI
State:
25.3% of AGI
(% of AGI for various income ranges: 14.1% for AGIs $10k-25k, 10.7% for AGIs $25k-50k, 10.4% for AGIs $50k-75k, 15.9% for AGIs $75k-100k, 11.6% for AGIs over 100k)
Charity contributions deductions: $2,314 (3% of AGI, reported on 17.6% of returns)
Here:
$2,314
State:
$3,923
Here:
3.1% of AGI
State:
3.3% of AGI
(% of AGI for various income ranges: 0.9% for AGIs $10k-25k, 1.5% for AGIs $25k-50k, 1.5% for AGIs $50k-75k, 1.2% for AGIs over 100k)
Total tax: $5,252 (reported on 68.0% of returns)
92242:
$5,252
State:
$10,761
(% of AGI for various income ranges: 1.5% for AGIs below $10k, 3.4% for AGIs $10k-25k, 6.5% for AGIs $25k-50k, 9.9% for AGIs $50k-75k, 11.5% for AGIs $75k-100k, 17.7% for AGIs over 100k)
Earned income credit: $1,826 (reported on 18.8% of returns)
Here:
$1,826
State:
$1,763
Percentage of individuals using paid preparers for their 2004 taxes: 63.5%
Here:
63%
State:
66%
(% for various income ranges: 51.4% for AGIs below $10k, 61.6% for AGIs $10k-25k, 69.2% for AGIs $25k-50k, 68.6% for AGIs $50k-75k, 62.5% for AGIs $75k-100k, 92.0% for AGIs over 100k)
Household received Food Stamps/SNAP in the past 12 months: 50 Household did not receive Food Stamps/SNAP in the past 12 months: 582
Women who had a birth in the past 12 months: 5 (5 now married, 0 unmarried) Women who did not have a birth in the past 12 months: 91 (30 now married, 61 unmarried)
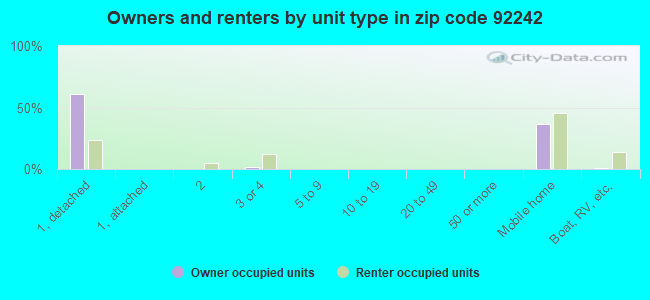
Housing units in zip code 92242 with a mortgage: 75 (5 second mortgage, 5 home equity loan) Median monthly owner costs for units with a mortgage: $1,156 Median monthly owner costs for units without a mortgage: $328
Residents with income below the poverty level in 2022:
This zip code:
15.0%
Whole state:
12.2%
Residents with income below 50% of the poverty level in 2022:
This zip code:
8.6%
Whole state:
6.2%
Median number of rooms in houses and condos:
Here:
4.6
State:
6.0
Median number of rooms in apartments:
Here:
4.3
State:
3.9
Notable locations in this zip code not listed on our city pages
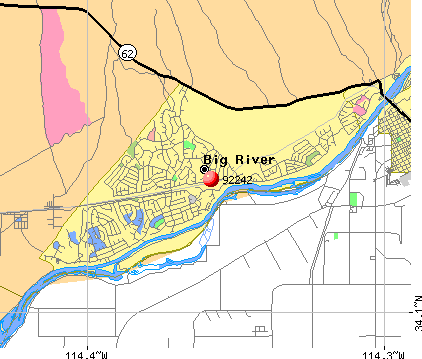
Notable locations in zip code 92242: San Bernardino County Fire Department Station 17 - Big River (A), San Bernardino County Fire Department Station 21 Parker Strip (B). Display/hide their locations on the map
Size of family households: 205 2-persons, 52 3-persons, 14 4-persons, 24 5-persons
Size of nonfamily households: 256 1-person, 87 2-persons, 6 3-persons
85 married couples with children.
75 single-parent households (45 men, 30 women).
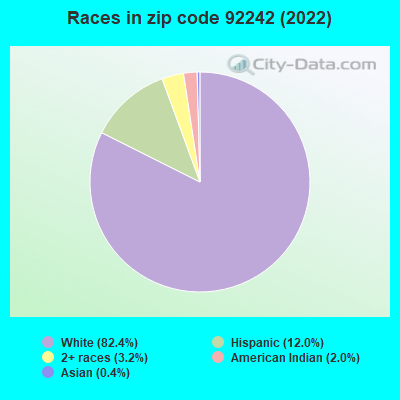
94.6% of residents of 92242 zip code speak English at home.
5.3% of residents speak Spanish at home (100% very well).
0.4% of residents speak Asian or Pacific Island language at home (100% well).
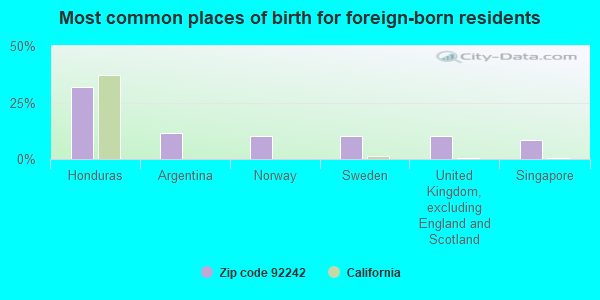
Foreign born population: 61 (5.0%) (72.5% of them are naturalized citizens)
This zip code:
5.0%
Whole state:
26.7%
32%Honduras
12%Argentina
10%Norway
10%Sweden
10%United Kingdom, excluding England and Scotland
8%Singapore
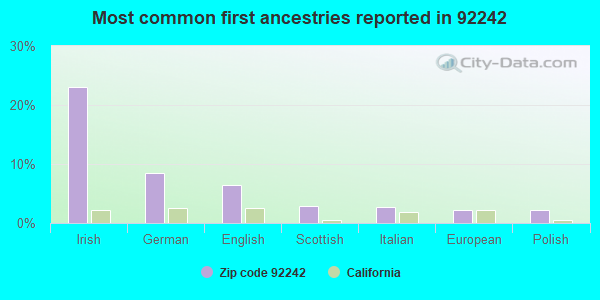
23%Irish
8%German
6%English
3%Scottish
3%Italian
2%European
2%Polish
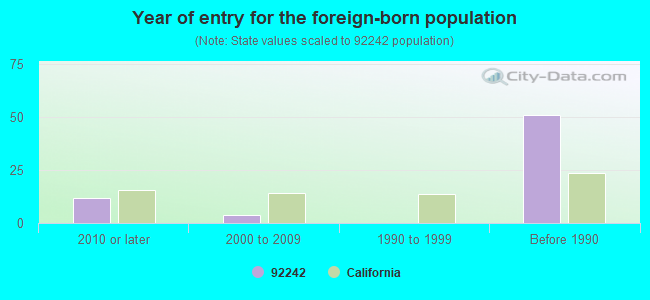
Year of entry for the foreign-born population
122010 or later
42000 to 2009
01990 to 1999
51Before 1990
Facilities with environmental interests located in this zip code:
IRON MOUNTAIN PUMPING PLANT (35 MILES EAST OF DESERT CENTER in EARP, CA)
CRITERIA AND HAZARDOUS AIR POLLUTANT INVENTORY (Inventory of air pollution sources) HAZARDOUS WASTE BIENNIAL REPORTER (Resource Conservation and Recovery Act (tracking hazardous waste)) Large Quantity Generators, more that 1000 kg of hazardous waste/month (Resource Conservation and Recovery Act (tracking hazardous waste)) Business SIC classification: WATER SUPPLY; REFUSE SYSTEMS Alternative names: MWD - IRON MT. PUMPING STATION
Housing units lacking complete plumbing facilities: 1.8% Housing units lacking complete kitchen facilities: 1.0%
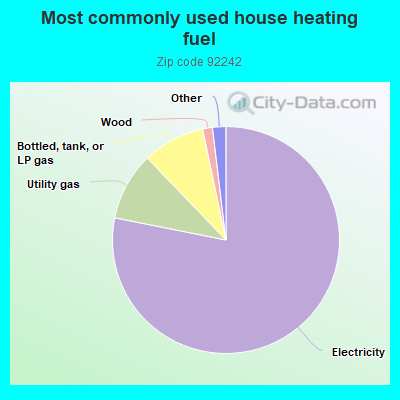
78.3%Electricity
9.7%Utility gas
8.9%Bottled, tank, or LP gas
1.4%Wood
1.0%Fuel oil, kerosene, etc.
1.0%Solar energy
Population in 1990: 976. Population change in the 1990s: +569 (+58.3%).
Place of birth for U.S.-born residents:
This state: 534
Northeast: 88
Midwest: 182
South: 147
West: 175
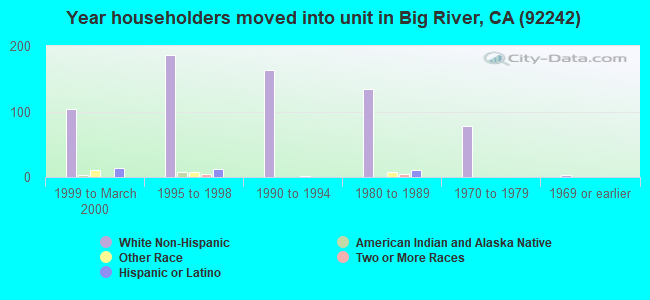
57% of the 92242 zip code residents lived in the same house 5 years ago. Out of people who lived in different houses, 26% lived in this county. Out of people who lived in different counties, 50% lived in California.
94% of the 92242 zip code residents lived in the same house 1 year ago. Out of people who lived in different houses, 46% moved from this county. Out of people who lived in different houses, 17% moved from different county within same state. Out of people who lived in different houses, 32% moved from different state. Out of people who lived in different houses, 6% moved from abroad.
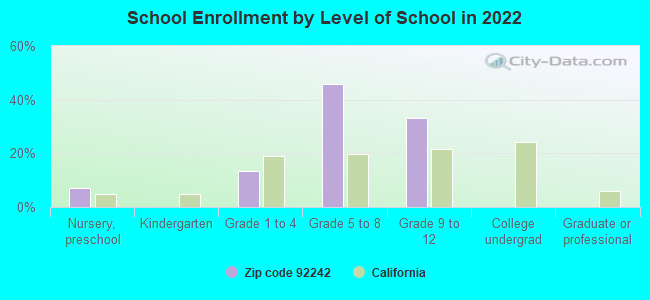
Private vs. public school enrollment:
Students in private schools in grades 1 to 8 (elementary and middle school):
Here:
0.0%
California:
10.5%
Students in private schools in grades 9 to 12 (high school): 7
Here:
20.8%
California:
8.5%
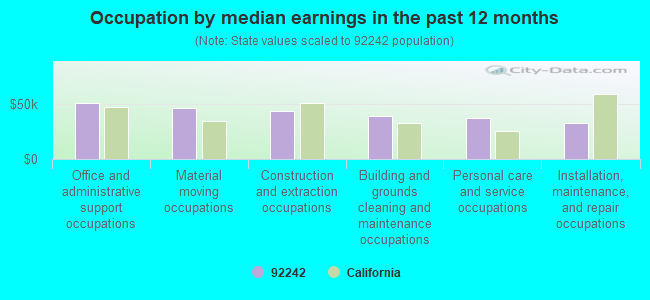
Occupation by median earnings in the past 12 months ($)
50,821Office and administrative support occupations
46,464Material moving occupations
43,933Construction and extraction occupations
39,046Building and grounds cleaning and maintenance occupations
36,959Personal care and service occupations
33,059Installation, maintenance, and repair occupations
Top industries in this zip code by the number of employees in 2005:
Accommodation and Food Services: RV (Recreational Vehicle) Parks and Campgrounds (100-249 employees: 1 establishment, 20-49 employees: 1 establishment, 10-19 employees: 1 establishment, 5-9 employees: 2 establishments)
Professional, Scientific, and Technical Services: Media Buying Agencies (10-19: 1)
Accommodation and Food Services: Full-Service Restaurants (10-19: 1)
Real Estate and Rental and Leasing: Lessors of Other Real Estate Property (5-9: 1, 1-4: 3)
Real Estate and Rental and Leasing: Residential Property Managers (5-9: 1)
Real Estate and Rental and Leasing: Lessors of Residential Buildings and Dwellings (1-4: 1)
Other Services (except Public Administration): Civic and Social Organizations (1-4: 1)
Professional, Scientific, and Technical Services: Display Advertising (1-4: 1)
Health Care and Social Assistance: Services for the Elderly and Persons with Disabilities (1-4: 1)
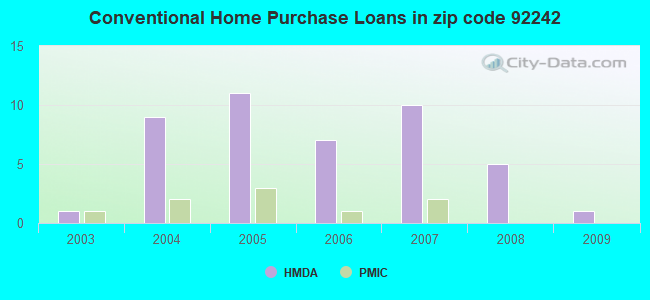
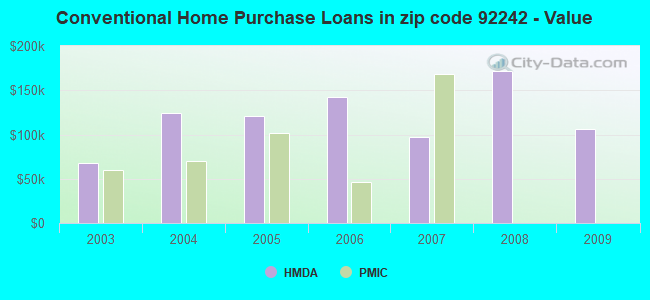
Home Mortgage Disclosure Act Aggregated Statistics For Year 2009 (Based on 4 partial tracts)
B) Conventional Home Purchase Loans
C) Refinancings
D) Home Improvement Loans
F) Non-occupant Loans on < 5 Family Dwellings (A B C & D)
G) Loans On Manufactured Home Dwelling (A B C & D)
Number
Average Value
Number
Average Value
Number
Average Value
Number
Average Value
Number
Average Value
LOANS ORIGINATED
1
$106,240
1
$129,910
0
$0
1
$236,160
0
$0
APPLICATIONS APPROVED, NOT ACCEPTED
0
$0
1
$39,260
1
$43,310
0
$0
0
$0
APPLICATIONS DENIED
3
$85,647
6
$209,115
1
$37,530
3
$177,453
3
$80,837
APPLICATIONS WITHDRAWN
1
$14,430
3
$127,990
1
$20,210
1
$144,350
0
$0
FILES CLOSED FOR INCOMPLETENESS
0
$0
1
$81,990
1
$52,540
0
$0
0
$0
Aggregated Statistics For Year 2008 (Based on 4 partial tracts)
A) FHA, FSA/RHS & VA Home Purchase Loans
B) Conventional Home Purchase Loans
C) Refinancings
D) Home Improvement Loans
F) Non-occupant Loans on < 5 Family Dwellings (A B C & D)
G) Loans On Manufactured Home Dwelling (A B C & D)
Number
Average Value
Number
Average Value
Number
Average Value
Number
Average Value
Number
Average Value
Number
Average Value
LOANS ORIGINATED
0
$0
5
$171,950
3
$175,337
0
$0
5
$209,250
1
$62,360
APPLICATIONS APPROVED, NOT ACCEPTED
0
$0
2
$36,375
2
$75,350
0
$0
2
$92,675
2
$36,375
APPLICATIONS DENIED
1
$41,000
1
$176,110
5
$116,634
2
$11,550
3
$120,100
3
$61,013
APPLICATIONS WITHDRAWN
0
$0
1
$204,400
1
$50,810
0
$0
1
$226,920
1
$28,290
FILES CLOSED FOR INCOMPLETENESS
0
$0
0
$0
0
$0
1
$51,390
1
$51,390
0
$0
Aggregated Statistics For Year 2007 (Based on 4 partial tracts)
B) Conventional Home Purchase Loans
C) Refinancings
D) Home Improvement Loans
F) Non-occupant Loans on < 5 Family Dwellings (A B C & D)
G) Loans On Manufactured Home Dwelling (A B C & D)
Number
Average Value
Number
Average Value
Number
Average Value
Number
Average Value
Number
Average Value
LOANS ORIGINATED
10
$96,945
5
$114,326
1
$2,310
5
$156,360
2
$69,000
APPLICATIONS APPROVED, NOT ACCEPTED
1
$140,890
1
$46,190
1
$57,740
1
$140,890
1
$103,930
APPLICATIONS DENIED
2
$74,485
7
$125,956
1
$60,050
3
$68,133
1
$57,740
APPLICATIONS WITHDRAWN
1
$203,820
2
$83,145
1
$23,100
3
$111,823
0
$0
FILES CLOSED FOR INCOMPLETENESS
0
$0
1
$50,810
0
$0
1
$50,810
0
$0
Aggregated Statistics For Year 2006 (Based on 4 partial tracts)
B) Conventional Home Purchase Loans
C) Refinancings
D) Home Improvement Loans
F) Non-occupant Loans on < 5 Family Dwellings (A B C & D)
G) Loans On Manufactured Home Dwelling (A B C & D)
Number
Average Value
Number
Average Value
Number
Average Value
Number
Average Value
Number
Average Value
LOANS ORIGINATED
7
$142,700
3
$195,547
1
$71,020
3
$320,843
1
$38,110
APPLICATIONS APPROVED, NOT ACCEPTED
2
$149,260
1
$52,540
0
$0
1
$115,480
2
$62,360
APPLICATIONS DENIED
3
$165,520
16
$103,282
2
$145,505
7
$172,643
2
$91,520
APPLICATIONS WITHDRAWN
1
$66,400
2
$124,720
1
$28,870
1
$202,090
0
$0
FILES CLOSED FOR INCOMPLETENESS
0
$0
1
$98,160
0
$0
0
$0
0
$0
Aggregated Statistics For Year 2005 (Based on 4 partial tracts)
A) FHA, FSA/RHS & VA Home Purchase Loans
B) Conventional Home Purchase Loans
C) Refinancings
D) Home Improvement Loans
F) Non-occupant Loans on < 5 Family Dwellings (A B C & D)
G) Loans On Manufactured Home Dwelling (A B C & D)
Number
Average Value
Number
Average Value
Number
Average Value
Number
Average Value
Number
Average Value
Number
Average Value
LOANS ORIGINATED
0
$0
11
$121,306
9
$146,531
1
$84,300
7
$134,369
2
$79,105
APPLICATIONS APPROVED, NOT ACCEPTED
0
$0
4
$71,742
1
$213,060
0
$0
2
$146,080
4
$71,742
APPLICATIONS DENIED
0
$0
5
$63,744
12
$88,775
7
$55,183
5
$82,452
7
$64,916
APPLICATIONS WITHDRAWN
1
$27,720
3
$68,903
7
$93,291
0
$0
3
$87,957
3
$44,267
FILES CLOSED FOR INCOMPLETENESS
0
$0
1
$88,920
1
$58,320
0
$0
0
$0
0
$0
Aggregated Statistics For Year 2004 (Based on 4 partial tracts)
A) FHA, FSA/RHS & VA Home Purchase Loans
B) Conventional Home Purchase Loans
C) Refinancings
D) Home Improvement Loans
F) Non-occupant Loans on < 5 Family Dwellings (A B C & D)
G) Loans On Manufactured Home Dwelling (A B C & D)
Number
Average Value
Number
Average Value
Number
Average Value
Number
Average Value
Number
Average Value
Number
Average Value
LOANS ORIGINATED
0
$0
9
$124,590
6
$151,183
2
$39,550
6
$208,538
2
$68,135
APPLICATIONS APPROVED, NOT ACCEPTED
0
$0
3
$136,073
2
$62,935
2
$29,445
2
$151,280
2
$122,985
APPLICATIONS DENIED
1
$65,250
5
$123,564
10
$105,664
2
$38,975
4
$99,890
4
$60,195
APPLICATIONS WITHDRAWN
0
$0
1
$31,760
1
$34,640
0
$0
0
$0
0
$0
FILES CLOSED FOR INCOMPLETENESS
0
$0
0
$0
1
$45,610
0
$0
1
$45,610
0
$0
Aggregated Statistics For Year 2003 (Based on 4 partial tracts)
A) FHA, FSA/RHS & VA Home Purchase Loans
B) Conventional Home Purchase Loans
C) Refinancings
D) Home Improvement Loans
F) Non-occupant Loans on < 5 Family Dwellings (A B C & D)

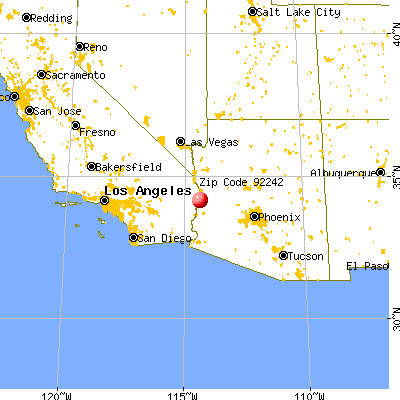


 Nearest zip codes: 85344, 92267, 92280, 86403, 86406, 85371.