Estimated zip code population in 2022: 9,284 Zip code population in 2010: 12,768 Zip code population in 2000: 8,761
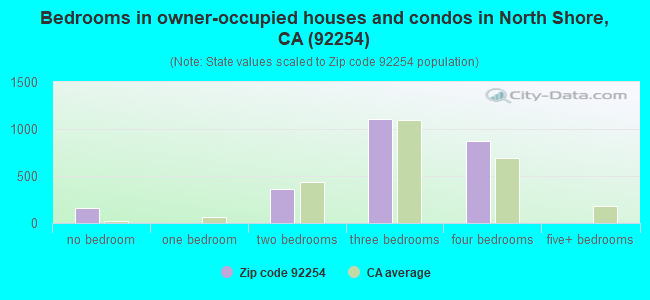
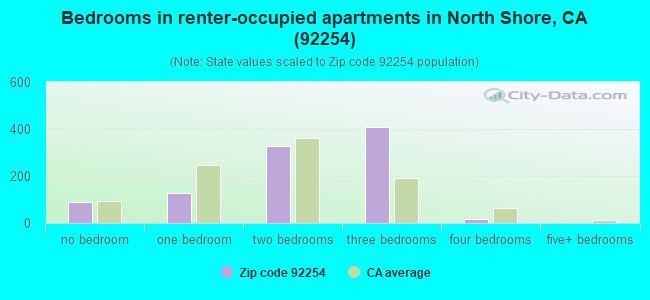
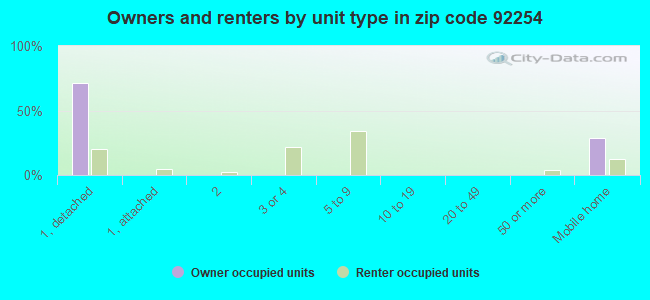
Houses and condos: 3,912 Renter-occupied apartments: 969
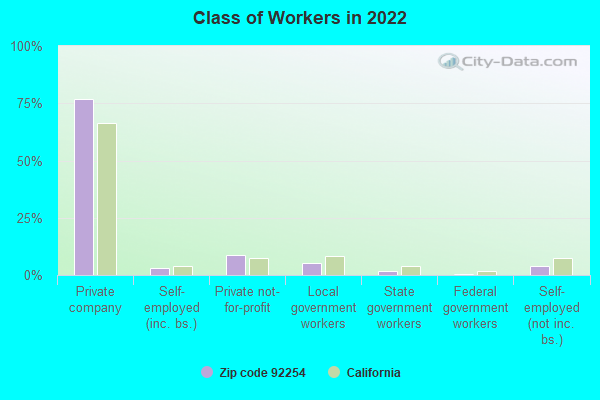
% of renters here:
28%
State:
44%
March 2022 cost of living index in zip code 92254: 80.8 (low, U.S. average is 100)
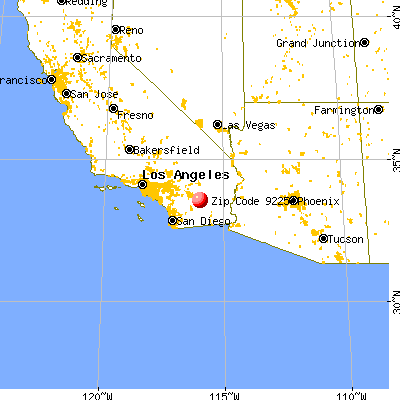
Land area: 46.7 sq. mi. Water area: 2.3 sq. mi.
Population density: 199 people per square mile
(very low).
OSM Map
General Map
Google Map
MSN Map
OSM Map
General Map
Google Map
MSN Map
OSM Map
General Map
Google Map
MSN Map
OSM Map
General Map
Google Map
MSN Map
Please wait while loading the map...
Real estate property taxes paid for housing units in 2022:
This zip code:
0.9% ($1,809)
California:
0.7% ($4,831)
Median real estate property taxes paid for housing units with mortgages in 2022: $2,017 (0.8%) Median real estate property taxes paid for housing units with no mortgage in 2022: $1,803 (1.1%)
Business Search- 14 Million verified businesses
Males: 4,621
(49.8%)
Females: 4,663
(50.2%)
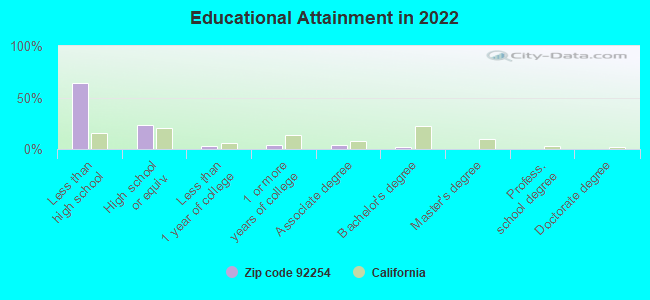
For population 25 years and over in 92254:
High school or higher: 34.3%
Bachelor's degree or higher: 1.5%
Graduate or professional degree: 0.0%
Unemployed: 8.8%
Mean travel time to work (commute): 26.1 minutes
For population 15 years and over in 92254:
Never married: 39.6%
Now married: 50.2%
Separated: 3.0%
Widowed: 4.0%
Divorced: 3.2%
Zip code 92254 compared to state average:
Median household income significantly below state average.
Median house value significantly below state average.
Black race population percentage significantly below state average.
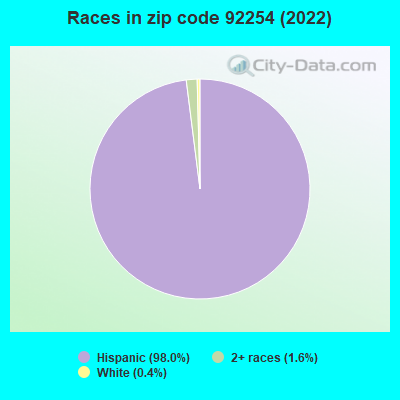
Hispanic race population percentage above state average.
Foreign-born population percentage above state average.
Renting percentage below state average.
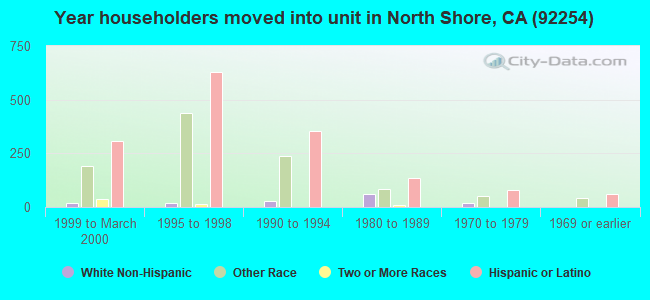
Length of stay since moving in significantly above state average.
House age below state average.
Percentage of population with a bachelor's degree or higher significantly below state average.
Estimated median house/condo value in 2022: $192,738
92254:
$192,738
California:
$715,900
According to our research of California and other state lists, there were 2 registered sex offenders living in 92254 zip code as of May 28, 2024. The ratio of all residents to sex offenders in zip code 92254 is 6,335 to 1. The ratio of registered sex offenders to all residents in this zip code is much lower than the state average.
Median resident age:
This zip code:
39.7 years
California median age:
37.9 years
Average household size:
This zip code:
2.7 people
California:
2.8 people
Averages for the 2020 tax year for zip code 92254, filed in 2021:
Average Adjusted Gross Income (AGI) in 2020: $29,217 (Individual Income Tax Returns)
Here:
$29,217
State:
$95,910
Salary/wage: $23,798 (reported on 94.1% of returns)
Here:
$23,798
State:
$77,331
(% of AGI for various income ranges: 2038.0% for AGIs below $25k, 4683.5% for AGIs $25k-50k, 8768.8% for AGIs $50k-75k, 10364.0% for AGIs $75k-100k)
Taxable interest for individuals: $100 (reported on 10.6% of returns)
This zip code:
$100
California:
$2,294
(% of AGI for various income ranges: 0.8% for AGIs below $25k, 2.4% for AGIs $25k-50k, 2.4% for AGIs $50k-75k, 10.0% for AGIs $75k-100k)
Ordinary dividends: $283 (reported on 0.9% of returns)
Here:
$283
State:
$10,949
(% of AGI for various income ranges: 0.1% for AGIs below $25k, 1.0% for AGIs $25k-50k)
Net capital gain/loss in AGI: +$1,886 (reported on 1.1% of returns)
Here:
+$1,886
State:
+$49,306
(% of AGI for various income ranges: 0.4% for AGIs below $25k, 8.8% for AGIs $25k-50k)
Profit/loss from business: +$7,825 (reported on 8.6% of returns)
Here:
+$7,825
State:
+$15,671
(% of AGI for various income ranges: 111.9% for AGIs below $25k, 103.4% for AGIs $25k-50k, 317.3% for AGIs $50k-75k)
Taxable individual retirement arrangement distribution: $2,300 (reported on 0.3% of returns)
92254:
$2,300
California:
$23,505
(% of AGI for various income ranges: 2.9% for AGIs below $25k)
Total itemized deductions: $24,067 (reported on 1.4% of returns)
Here:
$24,067
State:
$39,517
(% of AGI for various income ranges: 79.0% for AGIs $25k-50k, 311.8% for AGIs $50k-75k)
Charity contributions: $4,775 (reported on 1.2% of returns)
Here:
$4,775
State:
$12,598
(% of AGI for various income ranges: 11.6% for AGIs $25k-50k, 65.2% for AGIs $50k-75k)
Taxes paid: $6,644 (reported on 1.4% of returns)
92254:
$6,644
State:
$8,807
(% of AGI for various income ranges: 21.0% for AGIs $25k-50k, 89.4% for AGIs $50k-75k)
Earned income credit: $2,644 (reported on 41.5% of returns)
Here:
$2,644
State:
$2,074
(% of AGI for various income ranges: 256.6% for AGIs below $25k, 205.0% for AGIs $25k-50k, 8.2% for AGIs $50k-75k)
Percentage of individuals using paid preparers for their 2020 taxes: 82.8%
Here:
83%
State:
92%
(% for various income ranges: 78.8% for AGIs below $25k, 86.7% for AGIs $25k-50k, 87.3% for AGIs $50k-75k, 85.7% for AGIs $75k-100k, 80.0% for AGIs $100k-200k)
Averages for the 2012 tax year for zip code 92254, filed in 2013:
Average Adjusted Gross Income (AGI) in 2012: $22,312 (Individual Income Tax Returns)
Here:
$22,312
State:
$72,726
Salary/wage: $20,017 (reported on 96.6% of returns)
Here:
$20,017
State:
$59,079
(% of AGI for various income ranges: 83.8% for AGIs below $25k, 91.2% for AGIs $25k-50k, 89.5% for AGIs $50k-75k, 65.9% for AGIs $75k-100k)
Taxable interest for individuals: $288 (reported on 6.7% of returns)
This zip code:
$288
California:
$2,146
(% of AGI for various income ranges: 0.1% for AGIs below $25k, 0.1% for AGIs $50k-75k, 0.2% for AGIs $75k-100k)
Ordinary dividends: $1,067 (reported on 0.4% of returns)
Here:
$1,067
State:
$9,308
Profit/loss from business: +$7,403 (reported on 8.8% of returns)
Here:
+$7,403
State:
+$17,064
Total itemized deductions: $17,124 (33% of AGI, reported on 3.5% of returns)
Here:
$17,124
State:
$34,004
Here:
32.9% of AGI
State:
22.7% of AGI
(% of AGI for various income ranges: 0.8% for AGIs below $25k, 2.5% for AGIs $25k-50k, 11.9% for AGIs $50k-75k, 13.3% for AGIs $75k-100k)
Charity contributions: $2,262 (reported on 2.2% of returns)
Here:
$2,262
State:
$4,659
(% of AGI for various income ranges: 0.2% for AGIs $25k-50k, 1.3% for AGIs $50k-75k, 1.2% for AGIs $75k-100k)
Taxes paid: $3,788 (reported on 3.5% of returns)
92254:
$3,788
State:
$14,448
(% of AGI for various income ranges: 0.1% for AGIs below $25k, 0.5% for AGIs $25k-50k, 2.5% for AGIs $50k-75k, 4.7% for AGIs $75k-100k)
Earned income credit: $3,068 (reported on 44.3% of returns)
Here:
$3,068
State:
$2,286
(% of AGI for various income ranges: 10.3% for AGIs below $25k, 2.9% for AGIs $25k-50k)
Percentage of individuals using paid preparers for their 2012 taxes: 65.4%
Here:
65%
State:
64%
(% for various income ranges: 67.3% for AGIs below $25k, 59.8% for AGIs $25k-50k, 81.2% for AGIs $50k-75k, 80.0% for AGIs $75k-100k)
Averages for the 2004 tax year for zip code 92254, filed in 2005:
Average Adjusted Gross Income (AGI) in 2004: $19,273 (Individual Income Tax Returns)
Here:
$19,273
State:
$58,600
Salary/wage: $17,249 (reported on 97.3% of returns)
Here:
$17,249
State:
$49,455
(% of AGI for various income ranges: 100.9% for AGIs below $10k, 85.1% for AGIs $10k-25k, 91.0% for AGIs $25k-50k, 89.3% for AGIs $50k-75k, 109.1% for AGIs $75k-100k)
Taxable interest for individuals: $639 (reported on 8.6% of returns)
This zip code:
$639
California:
$2,365
(% of AGI for various income ranges: 0.1% for AGIs below $10k, 0.4% for AGIs $10k-25k, 0.1% for AGIs $25k-50k, 0.2% for AGIs $50k-75k, 2.1% for AGIs $75k-100k)
Taxable dividends: $1,324 (reported on 0.8% of returns)
Here:
$1,324
State:
$4,746
Net capital gain/loss: +$9,893 (reported on 1.4% of returns)
Here:
+$9,893
State:
+$23,418
Profit/loss from business: +$6,701 (reported on 6.0% of returns)
Here:
+$6,701
State:
+$16,826
Total itemized deductions: $14,117 (33% of AGI, reported on 5.5% of returns)
Here:
$14,117
State:
$28,113
Here:
33.3% of AGI
State:
25.3% of AGI
(% of AGI for various income ranges: 1.8% for AGIs $10k-25k, 5.4% for AGIs $25k-50k, 10.8% for AGIs $50k-75k, 21.4% for AGIs $75k-100k)
Charity contributions deductions: $2,084 (5% of AGI, reported on 4.7% of returns)
Here:
$2,084
State:
$3,923
Here:
5.0% of AGI
State:
3.3% of AGI
(% of AGI for various income ranges: 0.2% for AGIs $10k-25k, 0.7% for AGIs $25k-50k, 1.7% for AGIs $50k-75k, 2.1% for AGIs $75k-100k)
Total tax: $1,547 (reported on 30.8% of returns)
92254:
$1,547
State:
$10,761
(% of AGI for various income ranges: 1.1% for AGIs below $10k, 1.2% for AGIs $10k-25k, 2.3% for AGIs $25k-50k, 6.5% for AGIs $50k-75k, 8.2% for AGIs $75k-100k, 15.4% for AGIs over 100k)
Earned income credit: $2,267 (reported on 61.6% of returns)
Here:
$2,267
State:
$1,763
Percentage of individuals using paid preparers for their 2004 taxes: 72.0%
Here:
72%
State:
66%
(% for various income ranges: 61.4% for AGIs below $10k, 72.3% for AGIs $10k-25k, 81.2% for AGIs $25k-50k, 83.2% for AGIs $50k-75k, 114.3% for AGIs $75k-100k)
Household received Food Stamps/SNAP in the past 12 months: 671 Household did not receive Food Stamps/SNAP in the past 12 months: 2,827
Women who had a birth in the past 12 months: 59 (42 now married, 17 unmarried) Women who did not have a birth in the past 12 months: 2,389 (1,013 now married, 1,372 unmarried)
Housing units in zip code 92254 with a mortgage: 803 (16 second mortgage, 16 both second mortgage and home equity loan) Median monthly owner costs for units with a mortgage: $1,308 Median monthly owner costs for units without a mortgage: $560
Residents with income below the poverty level in 2022:
This zip code:
17.2%
Whole state:
12.2%
Residents with income below 50% of the poverty level in 2022:
This zip code:
13.0%
Whole state:
6.2%
Median number of rooms in houses and condos:
Here:
5.2
State:
6.0
Median number of rooms in apartments:
Here:
4.3
State:
3.9
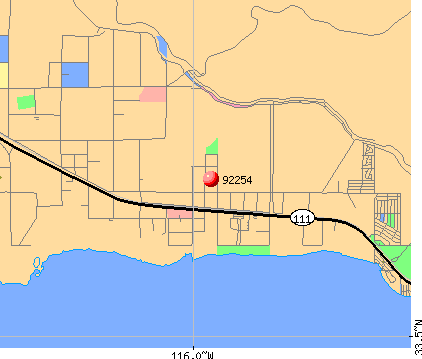
Notable locations in this zip code not listed on our city pages
Notable locations in zip code 92254: North Shore Marina (A), Los Frijoles Campground (B), Salton Sea State Recreation Area Headquarters Visitor Center (C), Mecca-North Shore Branch Riverside Public Library (D), Riverside County Fire Department Station 41 North Shore (E), Riverside County Fire Department Station 40 Mecca (F). Display/hide their locations on the map
989 married couples with children.
280 single-parent households (62 men, 218 women).
14.3% of residents of 92254 zip code speak English at home.
87.3% of residents speak Spanish at home (40% very well, 9% well, 11% not well, 40% not at all).
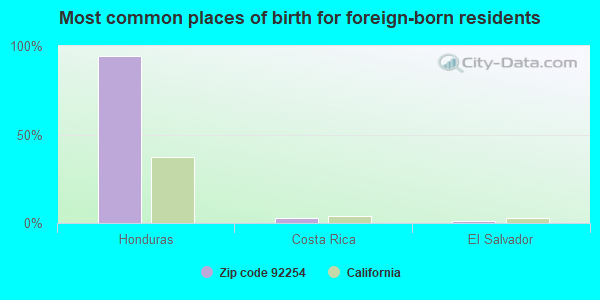
Foreign born population: 5,258 (56.6%) (33.7% of them are naturalized citizens)
This zip code:
56.6%
Whole state:
26.7%
94%Honduras
3%Costa Rica
1%El Salvador
0%Chile
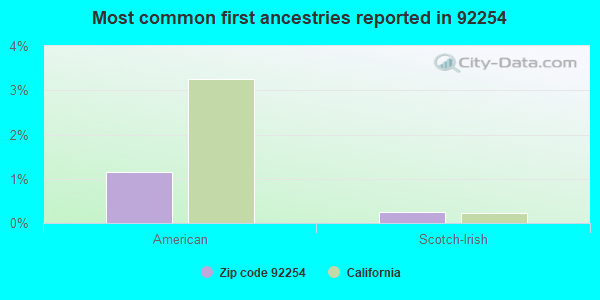
1%American
0%Scotch-Irish
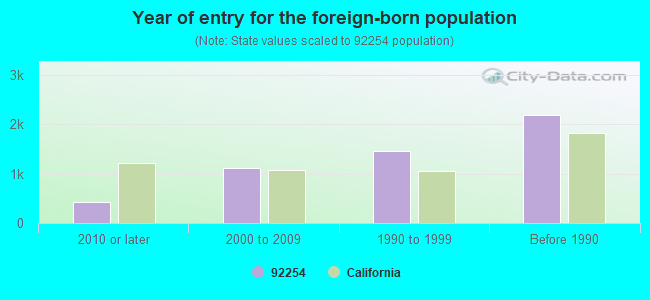
Year of entry for the foreign-born population
4162010 or later
1,1082000 to 2009
1,4481990 to 1999
2,187Before 1990
Facilities with environmental interests located in this zip code:
MECCA LANDFILL II (BOX CANYON RD & GARFIELD ST in MECCA, CA)
STATE MASTER (California Solid Waste disposal sites tracking) - REFUSE DISPOSAL REFUSE DISPOSAL (Solid waste facilities tracking) Organizations: COUNTY OF RIVERSIDE WASTE MGMT DEPT (CONTACT/OPERATOR)
MARTINEZ (SAUL) ELEMENTARY (65-705 JOHNSON ST. in MECCA, CA)
(National Center for Education Statistics) - STATE ID-6114789 Organizations: COACHELLA VALLEY UNIFIED (SCHOOL DISTRICT)
MECCA ELEMENTARY (65250 COAHUILLA ST in MECCA, CA)
(National Center for Education Statistics) - STATE ID-6032254 Organizations: COACHELLA VALLEY UNIFIED (SCHOOL DISTRICT)
KENT SEATECH CORP FISH FARM (70775 BUCHANAN STREET in MECCA, CA)
National Pollutant Discharge Elimination System NON-MAJOR (Tracking pollutant discharge elimination systems) - permit Business SIC classification: FISH HATCHERIES AND PRESERVES Organizations: KENT SEATECH CORPORATION (CONTACT/OWNER)
Alternative names: KENT SEATECH CORPORATION, KENT SEATECH CORPORATION
LEONS OTHER PLACE (65 770 HAMMOND RD in MECCA, CA)
Small Quantity Generators, between 100 kg and 1000 kg of hazardous waste/month (Resource Conservation and Recovery Act (tracking hazardous waste)) - notification Organizations: LEONS FAMILY ENTERPRISES INC (CONTACT/OWNER)
MECCA LANDFILL (60TH AVE & LINCOLN ST in MECCA, CA)
CRITERIA AND HAZARDOUS AIR POLLUTANT INVENTORY (Inventory of air pollution sources) Business SIC classification: REFUSE SYSTEMS Business NAICS classification: SOLID WASTE LANDFILL.
MECCA LANDFILL II (95250 66TH AVENUE in MECCA, CA)
CRITERIA AND HAZARDOUS AIR POLLUTANT INVENTORY (Inventory of air pollution sources) Business SIC classification: REFUSE SYSTEMS Business NAICS classification: SOLID WASTE LANDFILL.
Housing units lacking complete plumbing facilities: 4.1% Housing units lacking complete kitchen facilities: 3.8%
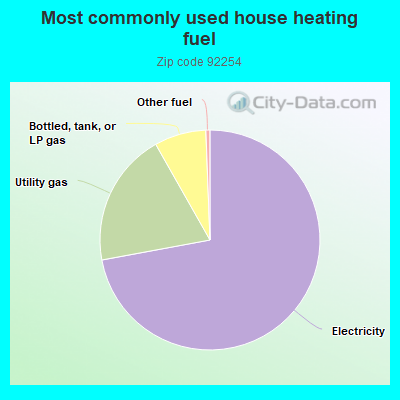
72.1%Electricity
19.7%Utility gas
7.6%Bottled, tank, or LP gas
0.6%Other fuel
Place of birth for U.S.-born residents:
This state: 3,910
West: 116
66% of the 92254 zip code residents lived in the same house 5 years ago. Out of people who lived in different houses, 84% lived in this county. Out of people who lived in different counties, 50% lived in California.
95% of the 92254 zip code residents lived in the same house 1 year ago. Out of people who lived in different houses, 83% moved from this county. Out of people who lived in different houses, 22% moved from abroad.
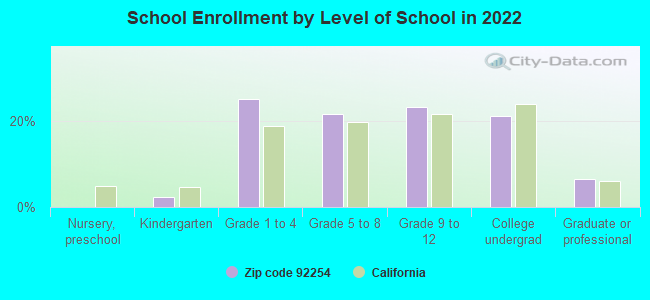
Private vs. public school enrollment:
Students in private schools in grades 1 to 8 (elementary and middle school):
Here:
0.0%
California:
10.5%
Students in private schools in grades 9 to 12 (high school):
Here:
0.0%
California:
8.5%
Students in private undergraduate colleges: 16
Here:
4.0%
California:
15.9%
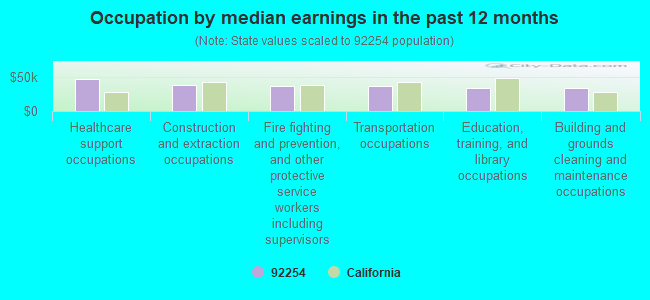
Occupation by median earnings in the past 12 months ($)
46,228Healthcare support occupations
37,964Construction and extraction occupations
37,003Fire fighting and prevention, and other protective service workers including supervisors
36,643Transportation occupations
34,293Education, training, and library occupations
33,694Building and grounds cleaning and maintenance occupations
Top industries in this zip code by the number of employees in 2005:
Utilities: Other Electric Power Generation (50-99 employees: 1 establishment)
Wholesale Trade: Recyclable Material Merchant Wholesalers (20-49: 1)
Health Care and Social Assistance: All Other Outpatient Care Centers (10-19: 1)
Wholesale Trade: Other Miscellaneous Nondurable Goods Merchant Wholesalers (10-19: 1)
Construction: New Single-Family Housing Construction (except Operative Builders) (5-9: 1)
Accommodation and Food Services: Limited-Service Restaurants (5-9: 1)
Other Services (except Public Administration): Religious Organizations (5-9: 1)
People in group quarters in 2000:
215 people in agriculture workers' dormitories on farms
25 people in unknown juvenile institutions
Fatal accident statistics in 2013:
Fatal accident count: 1
Vehicles involved in fatal accidents: 1
Fatal accidents caused by drunken drivers: 1
Fatalities: 1
Persons involved in fatal accidents: 1
Pedestrians involved in fatal accidents: 0
Fatal accident statistics in 2012:
Fatal accident count: 1
Vehicles involved in fatal accidents: 2
Fatal accidents caused by drunken drivers: 0
Fatalities: 1
Persons involved in fatal accidents: 4
Pedestrians involved in fatal accidents: 0
Home Mortgage Disclosure Act Aggregated Statistics For Year 2009 (Based on 2 partial tracts)
A) FHA, FSA/RHS & VA Home Purchase Loans
B) Conventional Home Purchase Loans
C) Refinancings
D) Home Improvement Loans
F) Non-occupant Loans on < 5 Family Dwellings (A B C & D)
G) Loans On Manufactured Home Dwelling (A B C & D)
Number
Average Value
Number
Average Value
Number
Average Value
Number
Average Value
Number
Average Value
Number
Average Value
LOANS ORIGINATED
8
$87,051
1
$61,090
3
$121,983
2
$39,855
0
$0
1
$51,200
APPLICATIONS APPROVED, NOT ACCEPTED
1
$128,000
0
$0
1
$48,870
0
$0
0
$0
1
$37,240
APPLICATIONS DENIED
1
$35,490
5
$85,640
12
$124,069
1
$18,620
1
$52,360
3
$85,913
APPLICATIONS WITHDRAWN
1
$81,450
0
$0
2
$128,580
0
$0
1
$50,620
0
$0
FILES CLOSED FOR INCOMPLETENESS
1
$139,050
0
$0
0
$0
0
$0
0
$0
1
$53,530
Aggregated Statistics For Year 2008 (Based on 2 partial tracts)
A) FHA, FSA/RHS & VA Home Purchase Loans
B) Conventional Home Purchase Loans
C) Refinancings
D) Home Improvement Loans
E) Loans on Dwellings For 5+ Families
F) Non-occupant Loans on < 5 Family Dwellings (A B C & D)
G) Loans On Manufactured Home Dwelling (A B C & D)
Number
Average Value
Number
Average Value
Number
Average Value
Number
Average Value
Number
Average Value
Number
Average Value
Number
Average Value
LOANS ORIGINATED
8
$139,050
2
$130,615
15
$125,281
5
$81,918
1
$1,396,320
2
$136,430
5
$101,814
APPLICATIONS APPROVED, NOT ACCEPTED
0
$0
1
$74,470
8
$111,415
2
$85,235
0
$0
1
$270,540
1
$67,490
APPLICATIONS DENIED
3
$160,770
4
$86,688
40
$131,094
15
$74,625
0
$0
6
$143,802
12
$82,761
APPLICATIONS WITHDRAWN
1
$129,160
1
$44,800
8
$131,850
5
$100,070
0
$0
2
$98,035
3
$77,960
FILES CLOSED FOR INCOMPLETENESS
0
$0
1
$118,690
3
$145,643
1
$107,630
0
$0
0
$0
1
$173,380
Aggregated Statistics For Year 2007 (Based on 2 partial tracts)
A) FHA, FSA/RHS & VA Home Purchase Loans
B) Conventional Home Purchase Loans
C) Refinancings
D) Home Improvement Loans
E) Loans on Dwellings For 5+ Families
F) Non-occupant Loans on < 5 Family Dwellings (A B C & D)
G) Loans On Manufactured Home Dwelling (A B C & D)
Number
Average Value
Number
Average Value
Number
Average Value
Number
Average Value
Number
Average Value
Number
Average Value
Number
Average Value
LOANS ORIGINATED
1
$137,300
7
$158,831
42
$149,384
9
$97,290
0
$0
1
$207,120
8
$121,669
APPLICATIONS APPROVED, NOT ACCEPTED
1
$212,940
6
$107,730
20
$152,315
3
$61,090
0
$0
2
$148,940
4
$128,288
APPLICATIONS DENIED
1
$205,960
15
$155,883
62
$166,123
16
$80,252
1
$218,170
7
$138,634
15
$94,329
APPLICATIONS WITHDRAWN
0
$0
3
$164,457
20
$149,552
5
$100,652
0
$0
3
$164,260
4
$94,832
FILES CLOSED FOR INCOMPLETENESS
0
$0
0
$0
2
$133,815
0
$0
0
$0
0
$0
0
$0
Aggregated Statistics For Year 2006 (Based on 2 partial tracts)
A) FHA, FSA/RHS & VA Home Purchase Loans
B) Conventional Home Purchase Loans
C) Refinancings
D) Home Improvement Loans
E) Loans on Dwellings For 5+ Families
F) Non-occupant Loans on < 5 Family Dwellings (A B C & D)
G) Loans On Manufactured Home Dwelling (A B C & D)
Number
Average Value
Number
Average Value
Number
Average Value
Number
Average Value
Number
Average Value
Number
Average Value
Number
Average Value
LOANS ORIGINATED
6
$175,413
33
$129,371
65
$142,711
10
$104,084
0
$0
6
$122,857
15
$122,449
APPLICATIONS APPROVED, NOT ACCEPTED
1
$94,830
4
$153,012
27
$158,637
4
$99,488
1
$174,540
4
$132,942
3
$102,590
APPLICATIONS DENIED
0
$0
30
$139,419
78
$157,407
17
$107,496
0
$0
15
$156,155
19
$117,922
APPLICATIONS WITHDRAWN
2
$176,865
11
$124,875
35
$170,351
2
$162,030
0
$0
2
$190,540
5
$107,982
FILES CLOSED FOR INCOMPLETENESS
0
$0
2
$85,235
4
$191,848
1
$142,540
0
$0
0
$0
1
$23,270
Aggregated Statistics For Year 2005 (Based on 2 partial tracts)
A) FHA, FSA/RHS & VA Home Purchase Loans
B) Conventional Home Purchase Loans
C) Refinancings
D) Home Improvement Loans
E) Loans on Dwellings For 5+ Families
F) Non-occupant Loans on < 5 Family Dwellings (A B C & D)
G) Loans On Manufactured Home Dwelling (A B C & D)
Number
Average Value
Number
Average Value
Number
Average Value
Number
Average Value
Number
Average Value
Number
Average Value
Number
Average Value
LOANS ORIGINATED
8
$125,814
30
$101,757
61
$111,391
8
$84,652
1
$1,061,790
6
$149,328
19
$77,808
APPLICATIONS APPROVED, NOT ACCEPTED
1
$73,310
6
$135,075
20
$79,706
1
$34,910
0
$0
3
$131,293
2
$134,685
APPLICATIONS DENIED
2
$137,885
25
$133,791
57
$130,150
13
$61,313
0
$0
5
$145,334
9
$93,282
APPLICATIONS WITHDRAWN
1
$94,830
9
$86,494
25
$130,207
3
$101,233
0
$0
4
$211,920
3
$91,343
FILES CLOSED FOR INCOMPLETENESS
1
$92,510
1
$107,050
8
$124,941
0
$0
0
$0
1
$134,980
1
$43,630
Aggregated Statistics For Year 2004 (Based on 2 partial tracts)
A) FHA, FSA/RHS & VA Home Purchase Loans
B) Conventional Home Purchase Loans
C) Refinancings
D) Home Improvement Loans
F) Non-occupant Loans on < 5 Family Dwellings (A B C & D)
G) Loans On Manufactured Home Dwelling (A B C & D)
Number
Average Value
Number
Average Value
Number
Average Value
Number
Average Value
Number
Average Value
Number
Average Value
LOANS ORIGINATED
3
$138,273
10
$87,386
40
$95,619
9
$76,539
5
$89,714
3
$93,283
APPLICATIONS APPROVED, NOT ACCEPTED
0
$0
5
$76,332
17
$96,168
6
$99,003
2
$124,215
2
$54,400
APPLICATIONS DENIED
0
$0
17
$97,879
40
$96,753
13
$45,067
3
$212,743
8
$53,235
APPLICATIONS WITHDRAWN
0
$0
2
$84,650
19
$106,929
4
$91,632
3
$115,973
1
$29,090
FILES CLOSED FOR INCOMPLETENESS
1
$51,200
1
$147,780
7
$128,494
1
$61,670
1
$60,510
1
$51,200
Aggregated Statistics For Year 2003 (Based on 2 partial tracts)
A) FHA, FSA/RHS & VA Home Purchase Loans
B) Conventional Home Purchase Loans
C) Refinancings
D) Home Improvement Loans
F) Non-occupant Loans on < 5 Family Dwellings (A B C & D)
Number
Average Value
Number
Average Value
Number
Average Value
Number
Average Value
Number
Average Value
LOANS ORIGINATED
6
$101,427
8
$85,015
54
$76,571
1
$48,870
3
$76,410
APPLICATIONS APPROVED, NOT ACCEPTED
0
$0
1
$66,330
10
$82,732
1
$34,910
3
$131,100
APPLICATIONS DENIED
1
$44,220
5
$80,638
33
$101,551
6
$24,435
6
$179,873
APPLICATIONS WITHDRAWN
1
$69,230
2
$52,360
21
$83,973
1
$6,400
1
$87,270
FILES CLOSED FOR INCOMPLETENESS
1
$74,470
1
$121,600
2
$155,920
0
$0
0
$0
Aggregated Statistics For Year 1999 (Based on 1 partial tract)
A) FHA, FSA/RHS & VA Home Purchase Loans
B) Conventional Home Purchase Loans
C) Refinancings
D) Home Improvement Loans
F) Non-occupant Loans on < 5 Family Dwellings (A B C & D)
Detailed PMIC statistics for the following Tracts:0456.04
2006 - 2018 National Fire Incident Reporting System (NFIRS) incidents
Based on the data from the years 2006 - 2018 the average number of fires per year is 82. The highest number of fire incidents - 132 took place in 2018, and the least - 21 in 2006. The data has a growing trend.
When looking into fire subcategories, the most reports belonged to: Outside Fires (65.8%), and Mobile Property/Vehicle Fires (20.6%).
Fire incident types reported to NFIRS in Zip Code 92254


 Nearest zip codes: 92274, 92236, 92201, 92275, 92253, 92203.
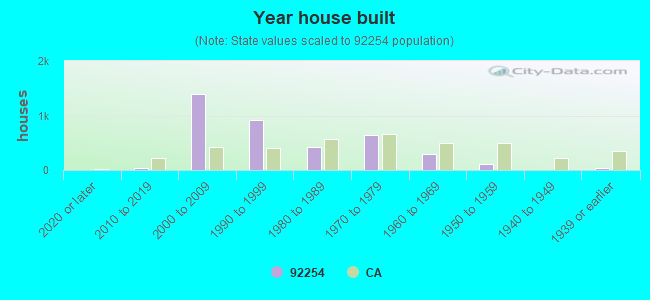


 Based on the data from the years 2006 - 2018 the average number of fires per year is 82. The highest number of fire incidents - 132 took place in 2018, and the least - 21 in 2006. The data has a growing trend.
 When looking into fire subcategories, the most reports belonged to: Outside Fires (65.8%), and Mobile Property/Vehicle Fires (20.6%).