Estimated zip code population in 2022: 1,055 Zip code population in 2010: 885 Zip code population in 2000: 943
Houses and condos: 735 Renter-occupied apartments: 166
% of renters here:
38%
State:
44%
March 2022 cost of living index in zip code 92339: 74.9 (low, U.S. average is 100)
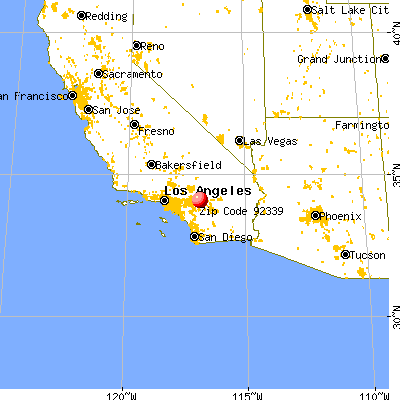
Land area: 10.6 sq. mi. Water area: 0.0 sq. mi.
Population density: 100 people per square mile
(very low).
OSM Map
General Map
Google Map
MSN Map
OSM Map
General Map
Google Map
MSN Map
OSM Map
General Map
Google Map
MSN Map
OSM Map
General Map
Google Map
MSN Map
Please wait while loading the map...
Real estate property taxes paid for housing units in 2022:
This zip code:
0.7% ($2,890)
California:
0.7% ($4,831)
Median real estate property taxes paid for housing units with mortgages in 2022: $3,160 (0.7%) Median real estate property taxes paid for housing units with no mortgage in 2022: $1,990 (0.5%)
Business Search- 14 Million verified businesses
Males: 625
(59.3%)
Females: 429
(40.7%)
For population 25 years and over in 92339:
High school or higher: 83.4%
Bachelor's degree or higher: 29.0%
Graduate or professional degree: 9.1%
Unemployed: 4.2%
Mean travel time to work (commute): 36.5 minutes
For population 15 years and over in 92339:
Never married: 37.7%
Now married: 41.7%
Separated: 1.3%
Widowed: 0.6%
Divorced: 18.7%
Zip code 92339 compared to state average:
Median house value below state average.
Black race population percentage significantly below state average.
Hispanic race population percentage significantly below state average.
Foreign-born population percentage significantly below state average.
Length of stay since moving in above state average.
Estimated median house/condo value in 2022: $421,635
92339:
$421,635
California:
$715,900
According to our research of California and other state lists, there was 1 registered sex offender living in 92339 zip code as of June 07, 2024. The ratio of all residents to sex offenders in zip code 92339 is 1,187 to 1. The ratio of registered sex offenders to all residents in this zip code is lower than the state average.
Median resident age:
This zip code:
37.2 years
California median age:
37.9 years
Average household size:
This zip code:
2.4 people
California:
2.8 people
Averages for the 2020 tax year for zip code 92339, filed in 2021:
Average Adjusted Gross Income (AGI) in 2020: $66,945 (Individual Income Tax Returns)
Here:
$66,945
State:
$95,910
Salary/wage: $59,256 (reported on 78.2% of returns)
Here:
$59,256
State:
$77,331
(% of AGI for various income ranges: 960.0% for AGIs below $25k, 3148.8% for AGIs $25k-50k, 8255.0% for AGIs $50k-75k, 11830.0% for AGIs $75k-100k, 19226.0% for AGIs $100k-200k)
Taxable interest for individuals: $400 (reported on 40.0% of returns)
This zip code:
$400
California:
$2,294
(% of AGI for various income ranges: 2.5% for AGIs below $25k, 38.8% for AGIs $25k-50k, 62.5% for AGIs $50k-75k, 20.0% for AGIs $75k-100k, 42.0% for AGIs $100k-200k)
Ordinary dividends: $2,257 (reported on 12.7% of returns)
Here:
$2,257
State:
$10,949
(% of AGI for various income ranges: 111.2% for AGIs $25k-50k, 138.0% for AGIs $100k-200k)
Net capital gain/loss in AGI: +$2,488 (reported on 14.5% of returns)
Here:
+$2,488
State:
+$49,306
(% of AGI for various income ranges: 162.5% for AGIs $25k-50k, 138.0% for AGIs $100k-200k)
Profit/loss from business: +$8,564 (reported on 20.0% of returns)
Here:
+$8,564
State:
+$15,671
(% of AGI for various income ranges: 105.0% for AGIs below $25k, 117.5% for AGIs $25k-50k, 1470.0% for AGIs $75k-100k, 268.0% for AGIs $100k-200k)
Taxable individual retirement arrangement distribution: $9,633 (reported on 5.5% of returns)
92339:
$9,633
California:
$23,505
(% of AGI for various income ranges: 722.5% for AGIs $50k-75k)
Total itemized deductions: $30,338 (reported on 14.5% of returns)
Here:
$30,338
State:
$39,517
(% of AGI for various income ranges: 613.8% for AGIs $25k-50k, 1260.0% for AGIs $75k-100k, 2864.0% for AGIs $100k-200k)
Charity contributions: $7,643 (reported on 12.7% of returns)
Here:
$7,643
State:
$12,598
(% of AGI for various income ranges: 317.5% for AGIs $50k-75k, 816.0% for AGIs $100k-200k)
Taxes paid: $8,462 (reported on 14.5% of returns)
92339:
$8,462
State:
$8,807
(% of AGI for various income ranges: 145.0% for AGIs $25k-50k, 412.5% for AGIs $75k-100k, 792.0% for AGIs $100k-200k)
Earned income credit: $1,357 (reported on 12.7% of returns)
Here:
$1,357
State:
$2,074
(% of AGI for various income ranges: 79.2% for AGIs below $25k)
Percentage of individuals using paid preparers for their 2020 taxes: 92.7%
Here:
93%
State:
92%
(% for various income ranges: 88.9% for AGIs below $25k, 90.0% for AGIs $25k-50k, 87.5% for AGIs $50k-75k, 100.0% for AGIs $75k-100k, 100.0% for AGIs $100k-200k, 100.0% for AGIs over 200k)
Averages for the 2012 tax year for zip code 92339, filed in 2013:
Average Adjusted Gross Income (AGI) in 2012: $58,496 (Individual Income Tax Returns)
Here:
$58,496
State:
$72,726
Salary/wage: $52,786 (reported on 82.2% of returns)
Here:
$52,786
State:
$59,079
(% of AGI for various income ranges: 61.0% for AGIs below $25k, 74.1% for AGIs $25k-50k, 77.2% for AGIs $50k-75k, 75.3% for AGIs $75k-100k, 74.4% for AGIs $100k-200k)
Taxable interest for individuals: $312 (reported on 37.8% of returns)
This zip code:
$312
California:
$2,146
(% of AGI for various income ranges: 0.4% for AGIs below $25k, 0.3% for AGIs $25k-50k, 0.2% for AGIs $75k-100k, 0.2% for AGIs $100k-200k)
Ordinary dividends: $1,014 (reported on 15.6% of returns)
Here:
$1,014
State:
$9,308
Profit/loss from business: +$9,060 (reported on 22.2% of returns)
Here:
+$9,060
State:
+$17,064
(% of AGI for various income ranges: 22.3% for AGIs below $25k, 13.2% for AGIs $25k-50k, 1.1% for AGIs $75k-100k)
Taxable individual retirement arrangement distribution: $6,733 (reported on 6.7% of returns)
92339:
$6,733
California:
$19,557
Total itemized deductions: $22,657 (25% of AGI, reported on 46.7% of returns)
Here:
$22,657
State:
$34,004
Here:
24.8% of AGI
State:
22.7% of AGI
(% of AGI for various income ranges: 19.2% for AGIs below $25k, 18.2% for AGIs $25k-50k, 15.8% for AGIs $50k-75k, 20.1% for AGIs $75k-100k, 18.0% for AGIs $100k-200k)
Charity contributions: $3,129 (reported on 37.8% of returns)
Here:
$3,129
State:
$4,659
(% of AGI for various income ranges: 1.3% for AGIs $25k-50k, 1.9% for AGIs $50k-75k, 2.2% for AGIs $75k-100k, 2.5% for AGIs $100k-200k)
Taxes paid: $7,086 (reported on 46.7% of returns)
92339:
$7,086
State:
$14,448
(% of AGI for various income ranges: 5.1% for AGIs $25k-50k, 4.1% for AGIs $50k-75k, 6.0% for AGIs $75k-100k, 7.1% for AGIs $100k-200k)
Earned income credit: $2,083 (reported on 13.3% of returns)
Here:
$2,083
State:
$2,286
(% of AGI for various income ranges: 7.9% for AGIs below $25k)
Percentage of individuals using paid preparers for their 2012 taxes: 57.8%
Here:
58%
State:
64%
(% for various income ranges: 50.0% for AGIs below $25k, 60.0% for AGIs $25k-50k, 62.5% for AGIs $50k-75k, 60.0% for AGIs $75k-100k, 62.5% for AGIs $100k-200k)
Averages for the 2004 tax year for zip code 92339, filed in 2005:
Average Adjusted Gross Income (AGI) in 2004: $46,724 (Individual Income Tax Returns)
Here:
$46,724
State:
$58,600
Salary/wage: $42,942 (reported on 84.5% of returns)
Here:
$42,942
State:
$49,455
(% of AGI for various income ranges: 185.7% for AGIs below $10k, 77.9% for AGIs $10k-25k, 80.1% for AGIs $25k-50k, 84.5% for AGIs $50k-75k, 84.7% for AGIs $75k-100k, 60.9% for AGIs over 100k)
Taxable interest for individuals: $628 (reported on 47.3% of returns)
This zip code:
$628
California:
$2,365
(% of AGI for various income ranges: 1.8% for AGIs below $10k, 1.2% for AGIs $10k-25k, 1.3% for AGIs $25k-50k, 0.2% for AGIs $50k-75k, 0.3% for AGIs $75k-100k, 0.6% for AGIs over 100k)
Taxable dividends: $962 (reported on 16.8% of returns)
Here:
$962
State:
$4,746
(% of AGI for various income ranges: 0.2% for AGIs $10k-25k, 1.1% for AGIs $25k-50k, 0.1% for AGIs $50k-75k, 0.1% for AGIs $75k-100k, 0.3% for AGIs over 100k)
Net capital gain/loss: +$1,756 (reported on 16.6% of returns)
Here:
+$1,756
State:
+$23,418
(% of AGI for various income ranges: -0.9% for AGIs $10k-25k, -0.5% for AGIs $25k-50k, 1.0% for AGIs $50k-75k, -0.4% for AGIs $75k-100k, 2.0% for AGIs over 100k)
Profit/loss from business: +$7,130 (reported on 22.9% of returns)
Here:
+$7,130
State:
+$16,826
(% of AGI for various income ranges: 27.1% for AGIs below $10k, 6.1% for AGIs $10k-25k, 0.2% for AGIs $25k-50k, 5.0% for AGIs $50k-75k, 4.9% for AGIs over 100k)
Total itemized deductions: $20,150 (27% of AGI, reported on 49.5% of returns)
Here:
$20,150
State:
$28,113
Here:
27.5% of AGI
State:
25.3% of AGI
(% of AGI for various income ranges: 20.6% for AGIs $10k-25k, 19.5% for AGIs $25k-50k, 23.7% for AGIs $50k-75k, 25.4% for AGIs $75k-100k, 18.7% for AGIs over 100k)
Charity contributions deductions: $2,901 (4% of AGI, reported on 43.1% of returns)
Here:
$2,901
State:
$3,923
Here:
3.8% of AGI
State:
3.3% of AGI
(% of AGI for various income ranges: 2.1% for AGIs $10k-25k, 1.7% for AGIs $25k-50k, 2.8% for AGIs $50k-75k, 3.6% for AGIs $75k-100k, 2.8% for AGIs over 100k)
Total tax: $6,301 (reported on 81.7% of returns)
92339:
$6,301
State:
$10,761
(% of AGI for various income ranges: 9.2% for AGIs below $10k, 5.1% for AGIs $10k-25k, 8.0% for AGIs $25k-50k, 9.2% for AGIs $50k-75k, 10.0% for AGIs $75k-100k, 16.5% for AGIs over 100k)
Earned income credit: $1,531 (reported on 10.4% of returns)
Here:
$1,531
State:
$1,763
Percentage of individuals using paid preparers for their 2004 taxes: 65.8%
Here:
66%
State:
66%
(% for various income ranges: 53.3% for AGIs below $10k, 68.2% for AGIs $10k-25k, 68.3% for AGIs $25k-50k, 65.6% for AGIs $50k-75k, 70.0% for AGIs $75k-100k, 76.1% for AGIs over 100k)
Household received Food Stamps/SNAP in the past 12 months: 90 Household did not receive Food Stamps/SNAP in the past 12 months: 357
Women who did not have a birth in the past 12 months: 270 (92 now married, 178 unmarried)
Housing units in zip code 92339 with a mortgage: 217 (15 second mortgage, 3 both second mortgage and home equity loan) Median monthly owner costs for units with a mortgage: $1,974 Median monthly owner costs for units without a mortgage: $711
Residents with income below the poverty level in 2022:
This zip code:
13.5%
Whole state:
12.2%
Residents with income below 50% of the poverty level in 2022:
This zip code:
6.8%
Whole state:
6.2%
Median number of rooms in houses and condos:
Here:
4.8
State:
6.0
Median number of rooms in apartments:
Here:
3.3
State:
3.9
Notable locations in this zip code not listed on our city pages
Notable locations in zip code 92339: Falls Recreation Area (A), Big Falls Trailhead (B), Big Falls Campground (C), San Bernardino County Fire Department Station 99 - Forest Falls (D). Display/hide their locations on the map
Creeks: Oak Creek (A), Oak Cove Creek (B), Monkeyface Creek (C), Momyer Creek (D), Hatchery Creek (E), Vivian Creek (F), Falls Creek (G), Camp Creek (H), Bridal Veil Creek (I). Display/hide their locations on the map
Size of family households: 137 2-persons, 21 3-persons, 58 4-persons, 18 5-persons
Size of nonfamily households: 105 1-person, 101 2-persons
206 married couples with children.
95 single-parent households (95 women).
89.2% of residents of 92339 zip code speak English at home.
6.9% of residents speak Spanish at home (32% very well, 68% not well).
2.4% of residents speak other Indo-European language at home (50% very well, 50% well).
Foreign born population: 69 (6.6%) (21.7% of them are naturalized citizens)
This zip code:
6.6%
Whole state:
26.7%
62%Honduras
9%Romania
9%Serbia
15%German
13%Greek
11%Swedish
8%American
5%Irish
4%Russian
1%English
Year of entry for the foreign-born population
162010 or later
52000 to 2009
231990 to 1999
23Before 1990
Facilities with environmental interests located in this zip code:
FALLSVALE ELEMENTARY (40600 VALLEY OF THE FALLS DR. in FOREST FALLS, CA)
(National Center for Education Statistics) - STATE ID-6036495 Organizations: REDLANDS UNIFIED (SCHOOL DISTRICT)
Housing units lacking complete plumbing facilities: 4.3% Housing units lacking complete kitchen facilities: 4.3%
33.9%Wood
29.3%Bottled, tank, or LP gas
16.5%Other fuel
13.0%Utility gas
4.6%Electricity
3.3%No fuel used
Population in 1990: 842. Population change in the 1990s: +101 (+12.0%).
Place of birth for U.S.-born residents:
This state: 769
Northeast: 20
Midwest: 111
South: 32
West: 45
46% of the 92339 zip code residents lived in the same house 5 years ago. Out of people who lived in different houses, 72% lived in this county. Out of people who lived in different counties, 50% lived in California.
88% of the 92339 zip code residents lived in the same house 1 year ago. Out of people who lived in different houses, 65% moved from this county. Out of people who lived in different houses, 24% moved from different county within same state. Out of people who lived in different houses, 7% moved from different state.
Private vs. public school enrollment:
Students in private schools in grades 1 to 8 (elementary and middle school): 5
Here:
3.0%
California:
10.5%
Students in private schools in grades 9 to 12 (high school):
Here:
0.0%
California:
8.5%
Students in private undergraduate colleges: 6
Here:
36.2%
California:
15.9%
Occupation by median earnings in the past 12 months ($)
136,328Computer and mathematical occupations
78,257Management occupations
61,390Construction and extraction occupations
44,143Education, training, and library occupations
11,263Food preparation and serving related occupations
Companies with federal contracts located in this zip code:
FOREST HOME INC (40000 VALLEY OF THE FALLS in FOREST FALLS, CA) : $6,640 in 3 contractsin 2003
$6,000 with Army for Other Professional Services. Signed on 2003-11-13. Completion date: 2003-10-26.
$640, same as above.Signed on 2003-11-17. Completion date: 2003-10-26.
$0, same as above.Signed on 2003-11-13. Completion date: 2003-10-26.
Top industries in this zip code by the number of employees in 2005:
Other Services (except Public Administration): Religious Organizations (250-499 employees: 1 establishment)
Construction: New Single-Family Housing Construction (except Operative Builders) (5-9: 1, 1-4: 1)
Accommodation and Food Services: Full-Service Restaurants (5-9: 1)
Real Estate and Rental and Leasing: Offices of Real Estate Agents and Brokers (5-9: 1)
Utilities: Water Supply and Irrigation Systems (1-4: 2)
Wholesale Trade: Wholesale Trade Agents and Brokers (1-4: 1)
Health Care and Social Assistance: Offices of Physicians (except Mental Health Specialists) (1-4: 1)
Fatal accident statistics in 2014:
Fatal accident count: 1
Vehicles involved in fatal accidents: 2
Fatal accidents caused by drunken drivers: 0
Fatalities: 1
Persons involved in fatal accidents: 6
Pedestrians involved in fatal accidents: 4
Fatal accident statistics in 2013:
Fatal accident count: 1
Vehicles involved in fatal accidents: 1
Fatal accidents caused by drunken drivers: 0
Fatalities: 1
Persons involved in fatal accidents: 1
Pedestrians involved in fatal accidents: 0
Home Mortgage Disclosure Act Aggregated Statistics For Year 2009 (Based on 2 partial tracts)
A) FHA, FSA/RHS & VA Home Purchase Loans
B) Conventional Home Purchase Loans
C) Refinancings
D) Home Improvement Loans
F) Non-occupant Loans on < 5 Family Dwellings (A B C & D)
Number
Average Value
Number
Average Value
Number
Average Value
Number
Average Value
Number
Average Value
LOANS ORIGINATED
1
$238,600
3
$128,093
7
$210,697
0
$0
4
$145,378
APPLICATIONS APPROVED, NOT ACCEPTED
0
$0
0
$0
1
$135,850
0
$0
1
$149,640
APPLICATIONS DENIED
0
$0
1
$232,400
4
$217,095
0
$0
1
$306,180
APPLICATIONS WITHDRAWN
0
$0
0
$0
2
$193,000
1
$87,230
0
$0
FILES CLOSED FOR INCOMPLETENESS
0
$0
0
$0
1
$74,820
0
$0
0
$0
Aggregated Statistics For Year 2008 (Based on 2 partial tracts)
A) FHA, FSA/RHS & VA Home Purchase Loans
B) Conventional Home Purchase Loans
C) Refinancings
D) Home Improvement Loans
F) Non-occupant Loans on < 5 Family Dwellings (A B C & D)
G) Loans On Manufactured Home Dwelling (A B C & D)
Number
Average Value
Number
Average Value
Number
Average Value
Number
Average Value
Number
Average Value
Number
Average Value
LOANS ORIGINATED
1
$194,290
4
$186,450
6
$203,748
2
$75,940
4
$197,398
0
$0
APPLICATIONS APPROVED, NOT ACCEPTED
0
$0
1
$213,430
1
$338,590
0
$0
1
$99,650
0
$0
APPLICATIONS DENIED
0
$0
1
$269,980
6
$235,700
1
$147,060
2
$203,000
1
$101,720
APPLICATIONS WITHDRAWN
0
$0
0
$0
3
$211,993
1
$107,060
1
$139,300
1
$95,680
FILES CLOSED FOR INCOMPLETENESS
0
$0
0
$0
2
$197,915
0
$0
0
$0
0
$0
Aggregated Statistics For Year 2007 (Based on 2 partial tracts)
B) Conventional Home Purchase Loans
C) Refinancings
D) Home Improvement Loans
F) Non-occupant Loans on < 5 Family Dwellings (A B C & D)
Number
Average Value
Number
Average Value
Number
Average Value
Number
Average Value
LOANS ORIGINATED
7
$328,717
18
$228,938
2
$120,940
6
$267,220
APPLICATIONS APPROVED, NOT ACCEPTED
4
$189,165
6
$293,195
1
$93,440
2
$171,365
APPLICATIONS DENIED
4
$199,552
9
$268,350
2
$78,185
4
$150,635
APPLICATIONS WITHDRAWN
1
$564,440
3
$224,983
1
$71,720
0
$0
FILES CLOSED FOR INCOMPLETENESS
0
$0
2
$264,720
0
$0
0
$0
Aggregated Statistics For Year 2006 (Based on 2 partial tracts)
B) Conventional Home Purchase Loans
C) Refinancings
D) Home Improvement Loans
F) Non-occupant Loans on < 5 Family Dwellings (A B C & D)
G) Loans On Manufactured Home Dwelling (A B C & D)
Number
Average Value
Number
Average Value
Number
Average Value
Number
Average Value
Number
Average Value
LOANS ORIGINATED
16
$192,301
20
$219,008
4
$124,128
8
$235,476
0
$0
APPLICATIONS APPROVED, NOT ACCEPTED
4
$210,802
3
$272,563
1
$52,930
2
$254,550
1
$33,620
APPLICATIONS DENIED
4
$226,705
9
$232,147
1
$128,960
1
$269,980
0
$0
APPLICATIONS WITHDRAWN
2
$164,900
5
$195,536
1
$71,720
1
$151,540
0
$0
FILES CLOSED FOR INCOMPLETENESS
1
$150,850
1
$341,520
0
$0
0
$0
0
$0
Aggregated Statistics For Year 2005 (Based on 2 partial tracts)
B) Conventional Home Purchase Loans
C) Refinancings
D) Home Improvement Loans
F) Non-occupant Loans on < 5 Family Dwellings (A B C & D)
G) Loans On Manufactured Home Dwelling (A B C & D)
Number
Average Value
Number
Average Value
Number
Average Value
Number
Average Value
Number
Average Value
LOANS ORIGINATED
22
$196,622
25
$187,309
3
$124,990
14
$221,325
0
$0
APPLICATIONS APPROVED, NOT ACCEPTED
6
$194,152
4
$224,982
1
$108,610
3
$233,947
1
$84,300
APPLICATIONS DENIED
6
$239,003
8
$190,718
2
$55,945
3
$222,683
0
$0
APPLICATIONS WITHDRAWN
3
$250,957
8
$205,889
1
$66,370
2
$249,030
0
$0
FILES CLOSED FOR INCOMPLETENESS
0
$0
3
$245,727
0
$0
0
$0
0
$0
Aggregated Statistics For Year 2004 (Based on 2 partial tracts)
A) FHA, FSA/RHS & VA Home Purchase Loans
B) Conventional Home Purchase Loans
C) Refinancings
D) Home Improvement Loans
F) Non-occupant Loans on < 5 Family Dwellings (A B C & D)
G) Loans On Manufactured Home Dwelling (A B C & D)
Number
Average Value
Number
Average Value
Number
Average Value
Number
Average Value
Number
Average Value
Number
Average Value
LOANS ORIGINATED
2
$168,435
24
$182,184
23
$159,597
4
$140,808
15
$182,055
0
$0
APPLICATIONS APPROVED, NOT ACCEPTED
0
$0
4
$138,308
3
$169,640
1
$37,240
1
$239,460
0
$0
APPLICATIONS DENIED
0
$0
4
$108,225
8
$160,482
1
$148,610
2
$167,230
1
$33,100
APPLICATIONS WITHDRAWN
1
$115,850
3
$114,473
8
$155,871
1
$79,990
1
$146,540
0
$0
FILES CLOSED FOR INCOMPLETENESS
0
$0
1
$198,600
2
$168,520
0
$0
1
$139,130
0
$0
Aggregated Statistics For Year 2003 (Based on 2 partial tracts)
A) FHA, FSA/RHS & VA Home Purchase Loans
B) Conventional Home Purchase Loans
C) Refinancings
D) Home Improvement Loans
F) Non-occupant Loans on < 5 Family Dwellings (A B C & D)
Number
Average Value
Number
Average Value
Number
Average Value
Number
Average Value
Number
Average Value
LOANS ORIGINATED
2
$135,160
38
$187,594
92
$171,414
2
$43,875
66
$186,249
APPLICATIONS APPROVED, NOT ACCEPTED
0
$0
4
$180,072
13
$132,297
1
$56,890
6
$131,312
APPLICATIONS DENIED
0
$0
7
$206,929
13
$182,041
2
$61,030
7
$190,231
APPLICATIONS WITHDRAWN
0
$0
4
$158,695
12
$167,961
1
$39,650
5
$125,370
FILES CLOSED FOR INCOMPLETENESS
0
$0
1
$161,190
3
$188,490
0
$0
1
$132,750
Aggregated Statistics For Year 2002 (Based on 2 partial tracts)
A) FHA, FSA/RHS & VA Home Purchase Loans
B) Conventional Home Purchase Loans
C) Refinancings
D) Home Improvement Loans
F) Non-occupant Loans on < 5 Family Dwellings (A B C & D)
Number
Average Value
Number
Average Value
Number
Average Value
Number
Average Value
Number
Average Value
LOANS ORIGINATED
5
$121,818
38
$158,454
50
$150,578
1
$25,000
41
$159,201
APPLICATIONS APPROVED, NOT ACCEPTED
0
$0
3
$162,687
7
$135,433
0
$0
3
$113,383
APPLICATIONS DENIED
1
$63,790
6
$119,732
11
$149,439
1
$35,000
3
$153,723
APPLICATIONS WITHDRAWN
0
$0
3
$134,243
6
$132,892
1
$37,240
3
$125,047
FILES CLOSED FOR INCOMPLETENESS
0
$0
1
$123,270
4
$105,510
0
$0
1
$99,990
Aggregated Statistics For Year 2001 (Based on 2 partial tracts)
A) FHA, FSA/RHS & VA Home Purchase Loans
B) Conventional Home Purchase Loans
C) Refinancings
D) Home Improvement Loans
F) Non-occupant Loans on < 5 Family Dwellings (A B C & D)
Number
Average Value
Number
Average Value
Number
Average Value
Number
Average Value
Number
Average Value
LOANS ORIGINATED
3
$107,117
42
$132,350
41
$159,037
2
$42,670
39
$135,458
APPLICATIONS APPROVED, NOT ACCEPTED
0
$0
4
$123,568
6
$124,128
1
$10,000
3
$119,760
APPLICATIONS DENIED
0
$0
4
$128,697
12
$130,248
2
$101,455
6
$130,018
APPLICATIONS WITHDRAWN
1
$45,000
5
$139,850
11
$130,382
1
$53,440
4
$177,400
FILES CLOSED FOR INCOMPLETENESS
0
$0
0
$0
3
$169,010
0
$0
1
$61,890
Aggregated Statistics For Year 2000 (Based on 2 partial tracts)
A) FHA, FSA/RHS & VA Home Purchase Loans
B) Conventional Home Purchase Loans
C) Refinancings
D) Home Improvement Loans
F) Non-occupant Loans on < 5 Family Dwellings (A B C & D)
Number
Average Value
Number
Average Value
Number
Average Value
Number
Average Value
Number
Average Value
LOANS ORIGINATED
6
$99,130
62
$115,655
16
$158,371
1
$27,410
32
$106,398
APPLICATIONS APPROVED, NOT ACCEPTED
1
$86,540
3
$112,633
3
$138,610
1
$49,130
3
$104,703
APPLICATIONS DENIED
0
$0
6
$93,757
6
$62,323
1
$17,070
3
$69,880
APPLICATIONS WITHDRAWN
1
$73,790
6
$147,862
6
$129,272
1
$40,860
3
$170,503
FILES CLOSED FOR INCOMPLETENESS
0
$0
2
$132,490
2
$92,665
0
$0
0
$0
Aggregated Statistics For Year 1999 (Based on 1 partial tract)
A) FHA, FSA/RHS & VA Home Purchase Loans
B) Conventional Home Purchase Loans
C) Refinancings
D) Home Improvement Loans
F) Non-occupant Loans on < 5 Family Dwellings (A B C & D)


 Nearest zip codes: 92399, 92305, 92359, 92315, 92223, 92320.


