Estimated zip code population in 2022: 6,989 Zip code population in 2010: 6,455 Zip code population in 2000: 5,251
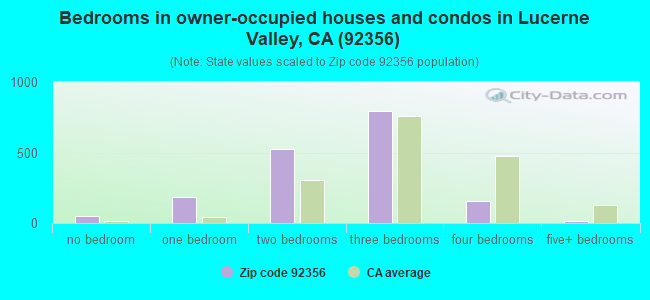
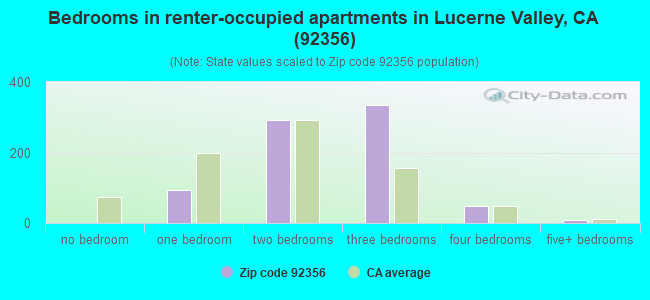
Houses and condos: 3,189 Renter-occupied apartments: 782
% of renters here:
31%
State:
44%
March 2022 cost of living index in zip code 92356: 73.7 (low, U.S. average is 100)
Land area: 393.8 sq. mi. Water area: 0.0 sq. mi.
Population density: 18 people per square mile
(very low).
OSM Map
General Map
Google Map
MSN Map
OSM Map
General Map
Google Map
MSN Map
OSM Map
General Map
Google Map
MSN Map
OSM Map
General Map
Google Map
MSN Map
Please wait while loading the map...
Real estate property taxes paid for housing units in 2022:
This zip code:
0.6% ($1,374)
California:
0.7% ($4,831)
Median real estate property taxes paid for housing units with mortgages in 2022: $1,678 (0.6%) Median real estate property taxes paid for housing units with no mortgage in 2022: $1,049 (0.6%)
Business Search- 14 Million verified businesses
Males: 3,794
(54.3%)
Females: 3,194
(45.7%)
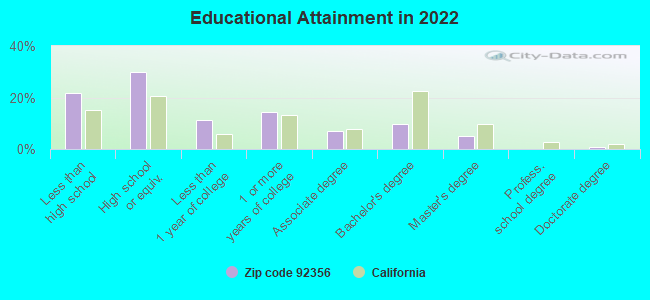
For population 25 years and over in 92356:
High school or higher: 77.3%
Bachelor's degree or higher: 15.6%
Graduate or professional degree: 5.9%
Unemployed: 16.5%
Mean travel time to work (commute): 43.5 minutes
For population 15 years and over in 92356:
Never married: 37.9%
Now married: 44.0%
Separated: 1.5%
Widowed: 4.5%
Divorced: 12.1%
Zip code 92356 compared to state average:
Median household income below state average.
Median house value significantly below state average.
Unemployed percentage significantly above state average.
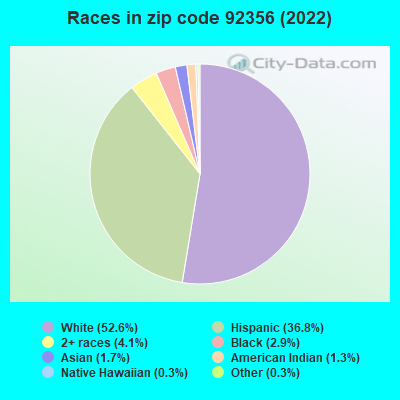
Black race population percentage below state average.
Foreign-born population percentage below state average.
Length of stay since moving in above state average.
Number of college students below state average.
Percentage of population with a bachelor's degree or higher significantly below state average.
Averages for the 2020 tax year for zip code 92356, filed in 2021:
Average Adjusted Gross Income (AGI) in 2020: $37,745 (Individual Income Tax Returns)
Here:
$37,745
State:
$95,910
Salary/wage: $37,247 (reported on 70.4% of returns)
Here:
$37,247
State:
$77,331
(% of AGI for various income ranges: 934.9% for AGIs below $25k, 3424.7% for AGIs $25k-50k, 6506.7% for AGIs $50k-75k, 10282.0% for AGIs $75k-100k, 19607.1% for AGIs $100k-200k)
Taxable interest for individuals: $529 (reported on 23.0% of returns)
This zip code:
$529
California:
$2,294
(% of AGI for various income ranges: 7.3% for AGIs below $25k, 22.1% for AGIs $25k-50k, 11.9% for AGIs $50k-75k, 48.0% for AGIs $75k-100k, 77.1% for AGIs $100k-200k)
Ordinary dividends: $3,186 (reported on 6.2% of returns)
Here:
$3,186
State:
$10,949
(% of AGI for various income ranges: 7.3% for AGIs below $25k, 38.4% for AGIs $25k-50k, 78.6% for AGIs $50k-75k, 90.0% for AGIs $100k-200k)
Net capital gain/loss in AGI: +$5,400 (reported on 6.6% of returns)
Here:
+$5,400
State:
+$49,306
(% of AGI for various income ranges: 10.4% for AGIs below $25k, 21.9% for AGIs $25k-50k, 178.6% for AGIs $50k-75k, 378.6% for AGIs $100k-200k)
Profit/loss from business: +$9,795 (reported on 19.5% of returns)
Here:
+$9,795
State:
+$15,671
(% of AGI for various income ranges: 243.2% for AGIs below $25k, 260.9% for AGIs $25k-50k, 122.9% for AGIs $50k-75k, 351.0% for AGIs $75k-100k, 1148.6% for AGIs $100k-200k)
Taxable individual retirement arrangement distribution: $9,489 (reported on 4.0% of returns)
92356:
$9,489
California:
$23,505
(% of AGI for various income ranges: 27.3% for AGIs below $25k, 62.1% for AGIs $25k-50k, 184.8% for AGIs $50k-75k)
Total itemized deductions: $27,489 (reported on 4.0% of returns)
Here:
$27,489
State:
$39,517
(% of AGI for various income ranges: 161.4% for AGIs $25k-50k, 375.2% for AGIs $50k-75k, 1417.1% for AGIs $100k-200k)
Charity contributions: $7,214 (reported on 3.1% of returns)
Here:
$7,214
State:
$12,598
(% of AGI for various income ranges: 33.0% for AGIs $25k-50k, 518.6% for AGIs $100k-200k)
Taxes paid: $7,622 (reported on 4.0% of returns)
92356:
$7,622
State:
$8,807
(% of AGI for various income ranges: 34.0% for AGIs $25k-50k, 110.5% for AGIs $50k-75k, 440.0% for AGIs $100k-200k)
Earned income credit: $2,344 (reported on 29.2% of returns)
Here:
$2,344
State:
$2,074
(% of AGI for various income ranges: 150.4% for AGIs below $25k, 104.4% for AGIs $25k-50k)
Percentage of individuals using paid preparers for their 2020 taxes: 92.5%
Here:
92%
State:
92%
(% for various income ranges: 90.7% for AGIs below $25k, 93.1% for AGIs $25k-50k, 96.7% for AGIs $50k-75k, 93.8% for AGIs $75k-100k, 93.3% for AGIs $100k-200k)
Averages for the 2012 tax year for zip code 92356, filed in 2013:
Average Adjusted Gross Income (AGI) in 2012: $33,263 (Individual Income Tax Returns)
Here:
$33,263
State:
$72,726
Salary/wage: $31,321 (reported on 72.4% of returns)
Here:
$31,321
State:
$59,079
(% of AGI for various income ranges: 58.6% for AGIs below $25k, 73.0% for AGIs $25k-50k, 80.9% for AGIs $50k-75k, 75.9% for AGIs $75k-100k, 50.7% for AGIs $100k-200k)
Taxable interest for individuals: $993 (reported on 24.3% of returns)
This zip code:
$993
California:
$2,146
(% of AGI for various income ranges: 1.4% for AGIs below $25k, 0.6% for AGIs $25k-50k, 0.6% for AGIs $50k-75k, 0.2% for AGIs $75k-100k, 0.7% for AGIs $100k-200k)
Ordinary dividends: $2,223 (reported on 7.2% of returns)
Here:
$2,223
State:
$9,308
(% of AGI for various income ranges: 0.3% for AGIs below $25k, 0.6% for AGIs $25k-50k, 0.2% for AGIs $50k-75k, 1.2% for AGIs $100k-200k)
Net capital gain/loss in AGI: +$6,646 (reported on 7.2% of returns)
Here:
+$6,646
State:
+$30,460
(% of AGI for various income ranges: 8.5% for AGIs $100k-200k)
Profit/loss from business: +$8,659 (reported on 20.4% of returns)
Here:
+$8,659
State:
+$17,064
(% of AGI for various income ranges: 18.1% for AGIs below $25k, 4.0% for AGIs $25k-50k, 2.2% for AGIs $50k-75k, 1.0% for AGIs $75k-100k)
Taxable individual retirement arrangement distribution: $13,280 (reported on 5.5% of returns)
92356:
$13,280
California:
$19,557
(% of AGI for various income ranges: 2.1% for AGIs below $25k, 1.9% for AGIs $25k-50k, 9.9% for AGIs $75k-100k)
Total itemized deductions: $19,566 (32% of AGI, reported on 22.7% of returns)
Here:
$19,566
State:
$34,004
Here:
31.7% of AGI
State:
22.7% of AGI
(% of AGI for various income ranges: 8.2% for AGIs below $25k, 15.0% for AGIs $25k-50k, 13.0% for AGIs $50k-75k, 14.7% for AGIs $75k-100k, 16.1% for AGIs $100k-200k)
Charity contributions: $2,647 (reported on 16.6% of returns)
Here:
$2,647
State:
$4,659
(% of AGI for various income ranges: 0.7% for AGIs below $25k, 1.4% for AGIs $25k-50k, 1.1% for AGIs $50k-75k, 1.7% for AGIs $75k-100k, 1.9% for AGIs $100k-200k)
Taxes paid: $4,783 (reported on 22.7% of returns)
92356:
$4,783
State:
$14,448
(% of AGI for various income ranges: 1.4% for AGIs below $25k, 2.6% for AGIs $25k-50k, 2.9% for AGIs $50k-75k, 4.4% for AGIs $75k-100k, 5.8% for AGIs $100k-200k)
Earned income credit: $2,540 (reported on 33.1% of returns)
Here:
$2,540
State:
$2,286
(% of AGI for various income ranges: 10.4% for AGIs below $25k, 1.6% for AGIs $25k-50k)
Percentage of individuals using paid preparers for their 2012 taxes: 61.9%
Here:
62%
State:
64%
(% for various income ranges: 55.0% for AGIs below $25k, 69.0% for AGIs $25k-50k, 72.7% for AGIs $50k-75k, 66.7% for AGIs $75k-100k, 75.0% for AGIs $100k-200k)
Averages for the 2004 tax year for zip code 92356, filed in 2005:
Average Adjusted Gross Income (AGI) in 2004: $30,721 (Individual Income Tax Returns)
Here:
$30,721
State:
$58,600
Salary/wage: $29,561 (reported on 76.7% of returns)
Here:
$29,561
State:
$49,455
(% of AGI for various income ranges: 116.0% for AGIs below $10k, 66.2% for AGIs $10k-25k, 77.6% for AGIs $25k-50k, 81.7% for AGIs $50k-75k, 83.4% for AGIs $75k-100k, 44.5% for AGIs over 100k)
Taxable interest for individuals: $1,070 (reported on 32.6% of returns)
This zip code:
$1,070
California:
$2,365
(% of AGI for various income ranges: 4.7% for AGIs below $10k, 2.3% for AGIs $10k-25k, 1.1% for AGIs $25k-50k, 0.3% for AGIs $50k-75k, 0.6% for AGIs $75k-100k, 1.3% for AGIs over 100k)
Taxable dividends: $1,473 (reported on 10.8% of returns)
Here:
$1,473
State:
$4,746
(% of AGI for various income ranges: 1.6% for AGIs below $10k, 0.9% for AGIs $10k-25k, 0.5% for AGIs $25k-50k, 0.5% for AGIs $50k-75k, 0.0% for AGIs $75k-100k, 0.4% for AGIs over 100k)
Net capital gain/loss: +$14,471 (reported on 11.8% of returns)
Here:
+$14,471
State:
+$23,418
(% of AGI for various income ranges: -0.6% for AGIs below $10k, 2.4% for AGIs $10k-25k, 1.0% for AGIs $25k-50k, 3.0% for AGIs $50k-75k, 0.3% for AGIs $75k-100k, 29.2% for AGIs over 100k)
Profit/loss from business: +$6,210 (reported on 16.7% of returns)
Here:
+$6,210
State:
+$16,826
(% of AGI for various income ranges: 16.0% for AGIs below $10k, 8.8% for AGIs $10k-25k, 3.2% for AGIs $25k-50k, 2.4% for AGIs $50k-75k, 0.0% for AGIs $75k-100k)
IRA payment deduction: $2,593 (reported on 1.4% of returns)
92356:
$2,593
California:
$3,192
Total itemized deductions: $16,259 (29% of AGI, reported on 26.5% of returns)
Here:
$16,259
State:
$28,113
Here:
29.1% of AGI
State:
25.3% of AGI
(% of AGI for various income ranges: 14.8% for AGIs below $10k, 10.6% for AGIs $10k-25k, 12.6% for AGIs $25k-50k, 15.8% for AGIs $50k-75k, 19.2% for AGIs $75k-100k, 12.8% for AGIs over 100k)
Charity contributions deductions: $2,655 (5% of AGI, reported on 21.7% of returns)
Here:
$2,655
State:
$3,923
Here:
4.5% of AGI
State:
3.3% of AGI
(% of AGI for various income ranges: 1.5% for AGIs $10k-25k, 1.7% for AGIs $25k-50k, 1.9% for AGIs $50k-75k, 2.5% for AGIs $75k-100k, 2.4% for AGIs over 100k)
Total tax: $3,677 (reported on 66.2% of returns)
92356:
$3,677
State:
$10,761
(% of AGI for various income ranges: 5.3% for AGIs below $10k, 3.9% for AGIs $10k-25k, 6.1% for AGIs $25k-50k, 8.3% for AGIs $50k-75k, 10.2% for AGIs $75k-100k, 14.0% for AGIs over 100k)
Earned income credit: $1,686 (reported on 25.1% of returns)
Here:
$1,686
State:
$1,763
Percentage of individuals using paid preparers for their 2004 taxes: 65.8%
Here:
66%
State:
66%
(% for various income ranges: 56.8% for AGIs below $10k, 64.1% for AGIs $10k-25k, 69.5% for AGIs $25k-50k, 75.9% for AGIs $50k-75k, 65.5% for AGIs $75k-100k, 83.9% for AGIs over 100k)
Household received Food Stamps/SNAP in the past 12 months: 820 Household did not receive Food Stamps/SNAP in the past 12 months: 1,791
Women who had a birth in the past 12 months: 47 (0 now married, 48 unmarried) Women who did not have a birth in the past 12 months: 1,399 (513 now married, 888 unmarried)
Housing units in zip code 92356 with a mortgage: 898 (5 second mortgage, 5 both second mortgage and home equity loan) Median monthly owner costs for units with a mortgage: $1,543 Median monthly owner costs for units without a mortgage: $412
Residents with income below the poverty level in 2022:
This zip code:
35.0%
Whole state:
12.2%
Residents with income below 50% of the poverty level in 2022:
This zip code:
16.1%
Whole state:
6.2%
Median number of rooms in houses and condos:
Here:
5.2
State:
6.0
Median number of rooms in apartments:
Here:
4.5
State:
3.9
Notable locations in this zip code not listed on our city pages
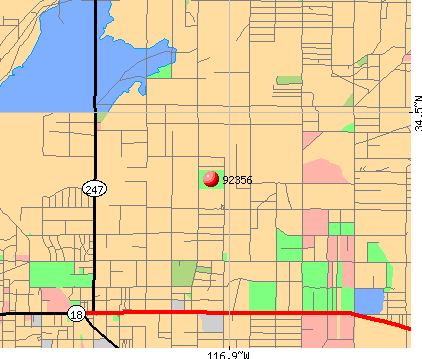
Notable locations in zip code 92356: Old Woman Spring Ranch (A), Box S Ranch (B), Thorn (C), California Department of Forestry and Fire Protection Station 8 - Lucerne Valley (D), San Bernardino County Fire Department Station 7 - Lucerne Valley (E), San Bernardino County Fire Department Station 8 - Lucerne Valley (F), Lucerne Valley Branch San Bernardino County Library (G). Display/hide their locations on the map
In group quarters: 111 (-1 institutionalized population)
Size of family households: 633 2-persons, 325 3-persons, 324 4-persons, 128 5-persons, 98 6-persons, 68 7-or-more-persons
Size of nonfamily households: 724 1-person, 139 2-persons, 66 3-persons
856 married couples with children.
663 single-parent households (136 men, 527 women).
70.5% of residents of 92356 zip code speak English at home.
25.7% of residents speak Spanish at home (62% very well, 1% well, 34% not well, 4% not at all).
0.5% of residents speak other Indo-European language at home (100% well).
2.4% of residents speak Asian or Pacific Island language at home (55% very well, 45% well).
Foreign born population: 930 (13.3%) (58.0% of them are naturalized citizens)
This zip code:
13.3%
Whole state:
26.7%
71%Honduras
9%Japan
7%Costa Rica
4%Barbados
3%Greece
1%Taiwan
0%El Salvador
13%English
6%American
5%German
4%European
3%Irish
3%Italian
2%Austrian
Year of entry for the foreign-born population
1632010 or later
752000 to 2009
2861990 to 1999
458Before 1990
Facilities with environmental interests located in this zip code:
MITSUBISHI CEMENT CORPORATION (5808 STATE HIGHWAY 18 in LUCERNE VALLEY, CA)
AIR MAJOR (AIRS/AFS) STATE MASTER (California Solid Waste disposal sites tracking) - REFUSE DISPOSAL (Integrated Compliance Information System) - ICIS-09-1998-0087, FORMAL ENFORCEMENT ACTION CRITERIA AND HAZARDOUS AIR POLLUTANT INVENTORY (Inventory of air pollution sources) Small Quantity Generators, between 100 kg and 1000 kg of hazardous waste/month (Resource Conservation and Recovery Act (tracking hazardous waste)) - notification REFUSE DISPOSAL (Solid waste facilities tracking) TRI REPORTER (Tracking of toxic chemicals releasing facilities) Business SIC classification: CEMENT, HYDRAULIC; REFUSE SYSTEMS Business NAICS classification: SOLID WASTE LANDFILL.; SOLID WASTE LANDFILL. Organizations: KAISER CEMENT CORP (CONTACT/OWNER)
Alternative names: KAISER CEMENT CORP CUSHENBURY, KAISER CEMENT & CUSHENBURY KILN DUST DS, MITSUBISHI CEMENT PLANT CUSHENBURY L.F.
MOUNTAIN VIEW HIGH (CONT.) (33233 RABBIT SPRINGS ROAD in LUCERNE VALLEY, CA)
(National Center for Education Statistics) - STATE ID-3630696 (National Center for Education Statistics) - STATE ID-3630563 Organizations: LUCERNE VALLEY UNIFIED (SCHOOL DISTRICT)
LUCERNE VALLEY COMMUNITY DAY (32770 OLD WOMAN SPRINGS ROAD, in LUCERNE VALLEY, CA)
(National Center for Education Statistics) - STATE ID-3630795 Organizations: LUCERNE VALLEY UNIFIED (SCHOOL DISTRICT)
LUCERNE VALLEY ELEMENTARY (10788 BARSTOW ROAD in LUCERNE VALLEY, CA)
(National Center for Education Statistics) - STATE ID-6035976 Organizations: LUCERNE VALLEY UNIFIED (SCHOOL DISTRICT)
LUCERNE VALLEY MIDDLE (8560 ALIENTO ROADSTOW ROAD in LUCERNE VALLEY, CA)
(National Center for Education Statistics) - STATE ID-6106330 Organizations: LUCERNE VALLEY UNIFIED (SCHOOL DISTRICT)
AMER TELE & TELE CO LUCERNE VALLEY (7.5 MI SW OF in LUCERNE VALLEY, CA)
(Resource Conservation and Recovery Act (tracking hazardous waste)) Organizations: AMERICAN TELEPHONE AND TELEGRAPH COMPANY (CONTACT/OWNER)
LUCERNE LANDFILL (6 MI N OF OLD WOMAN SPGS RD in LUCERNE VALLEY, CA)
Small Quantity Generators, between 100 kg and 1000 kg of hazardous waste/month (Resource Conservation and Recovery Act (tracking hazardous waste)) - notification Organizations: SAN BERNARDINO CNTY (CONTACT/OWNER)
LUCERNE VALLEY GARAGE (31685 HWY 18 in LUCERNE VALLEY, CA)
Small Quantity Generators, between 100 kg and 1000 kg of hazardous waste/month (Resource Conservation and Recovery Act (tracking hazardous waste)) Organizations: JAMES A DAVIS (CONTACT/OPERATOR)
KINNE LIMESTONE PRODUCTS (5 MLES NORTH OF NORTH STREET in LUCERNE VALLEY, CA)
CRITERIA AND HAZARDOUS AIR POLLUTANT INVENTORY (Inventory of air pollution sources) Business SIC classification: CRUSHED AND BROKEN LIMESTONE
LUCERNE VALLEY CHRISTIAN SCHOOL (P O BOX 1110 in LUCERNE VALLEY, CA)
COMPLIANCE ACTIVITY (Tracking inspections of insecticide, fungicide, and rodenticide, and toxic substances)
Housing units lacking complete plumbing facilities: 9.7% Housing units lacking complete kitchen facilities: 10.1%
34.9%Bottled, tank, or LP gas
22.3%Electricity
20.1%Wood
20.1%Utility gas
1.6%No fuel used
1.1%Other fuel
Population in 1990: 4,353. Population change in the 1990s: +898 (+20.6%).
Place of birth for U.S.-born residents:
This state: 4,725
Northeast: 214
Midwest: 333
South: 301
West: 397
63% of the 92356 zip code residents lived in the same house 5 years ago. Out of people who lived in different houses, 66% lived in this county. Out of people who lived in different counties, 50% lived in California.
89% of the 92356 zip code residents lived in the same house 1 year ago. Out of people who lived in different houses, 51% moved from this county. Out of people who lived in different houses, 41% moved from different county within same state. Out of people who lived in different houses, 7% moved from different state.
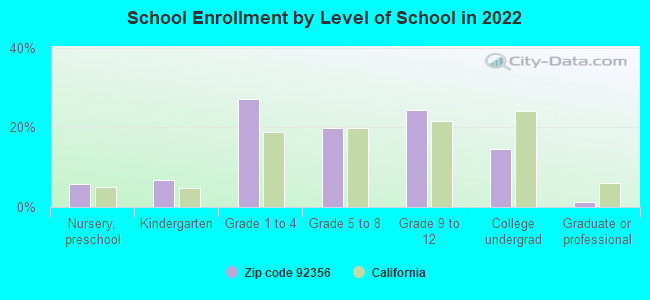
Private vs. public school enrollment:
Students in private schools in grades 1 to 8 (elementary and middle school):
Here:
0.0%
California:
10.5%
Students in private schools in grades 9 to 12 (high school): 25
Here:
7.3%
California:
8.5%
Students in private undergraduate colleges: 37
Here:
18.5%
California:
15.9%
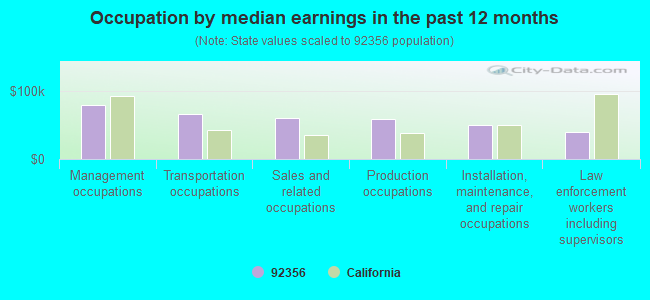
Occupation by median earnings in the past 12 months ($)
80,176Management occupations
66,159Transportation occupations
60,392Sales and related occupations
58,746Production occupations
49,830Installation, maintenance, and repair occupations
40,143Law enforcement workers including supervisors
Companies with federal contracts located in this zip code:
OMEGA PORTABLE SERVICES (34178 OLD WOMAN SPRINGS RO in LUCERNE VALLEY, CA; small business) : $50,500 in 2 contractsfrom 2002 to 2003
$44,000 with Navy for Toiletry Paper Products. Signed on 2003-12-24. Completion date: 2004-03-01.
$6,500 with Army for Waste Treatment and Storage. Signed on 2002-10-24. Completion date: 2002-11-15.
GEN-SUN ELECTRIC SOLAR SYSTEMS (10760 KINDALL RD in LUCERNE VALLEY, CA; small business)
$16,377 with Army for Electrical Control Equipment. Signed on 2005-05-16. Completion date: 2005-06-17.
Top industries in this zip code by the number of employees in 2005:
Mining: Crushed and Broken Limestone Mining and Quarrying (100-249 employees: 2 establishments)
Accommodation and Food Services: Limited-Service Restaurants (20-49: 1, 1-4: 1)
Health Care and Social Assistance: Nursing Care Facilities (20-49: 1)
Administrative and Support and Waste Management and Remediation Services: Septic Tank and Related Services (10-19: 2, 1-4: 1)
Construction: Plumbing, Heating, and Air-Conditioning Contractors (10-19: 1, 5-9: 1)
People in group quarters in 2010:
40 people in group homes intended for adults
3 people in residential treatment centers for adults
People in group quarters in 2000:
10 people in homes or halfway houses for drug/alcohol abuse
7 people in other noninstitutional group quarters
Fatal accident statistics in 2014:
Fatal accident count: 1
Vehicles involved in fatal accidents: 2
Fatal accidents caused by drunken drivers: 0
Fatalities: 1
Persons involved in fatal accidents: 4
Pedestrians involved in fatal accidents: 0
Fatal accident statistics in 2013:
Fatal accident count: 2
Vehicles involved in fatal accidents: 2
Fatal accidents caused by drunken drivers: 0
Fatalities: 2
Persons involved in fatal accidents: 2
Pedestrians involved in fatal accidents: 2
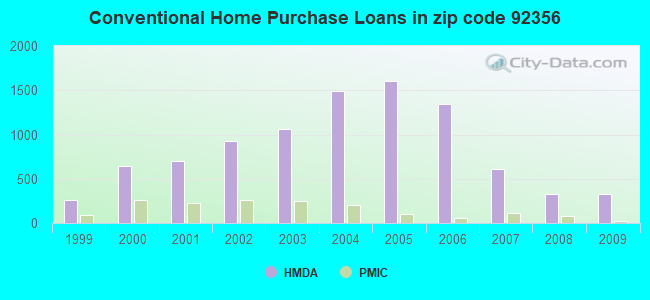
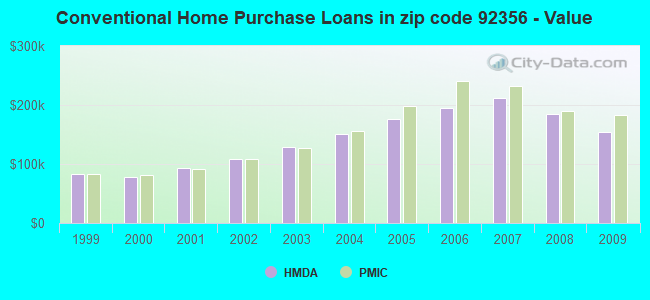
Home Mortgage Disclosure Act Aggregated Statistics For Year 2009 (Based on 10 partial tracts)
A) FHA, FSA/RHS & VA Home Purchase Loans
B) Conventional Home Purchase Loans
C) Refinancings
D) Home Improvement Loans
E) Loans on Dwellings For 5+ Families
F) Non-occupant Loans on < 5 Family Dwellings (A B C & D)
G) Loans On Manufactured Home Dwelling (A B C & D)
Number
Average Value
Number
Average Value
Number
Average Value
Number
Average Value
Number
Average Value
Number
Average Value
Number
Average Value
LOANS ORIGINATED
182
$166,330
324
$154,255
431
$191,912
13
$67,412
0
$0
367
$158,880
25
$130,684
APPLICATIONS APPROVED, NOT ACCEPTED
19
$155,765
27
$135,621
66
$199,505
3
$134,787
0
$0
34
$151,961
8
$114,226
APPLICATIONS DENIED
37
$132,155
58
$130,157
279
$196,794
22
$77,009
0
$0
103
$177,267
31
$134,856
APPLICATIONS WITHDRAWN
32
$179,698
39
$137,599
146
$192,377
15
$78,954
1
$145,020
61
$153,164
4
$158,522
FILES CLOSED FOR INCOMPLETENESS
8
$159,920
9
$118,672
27
$188,174
3
$49,253
0
$0
12
$145,870
1
$14,030
Aggregated Statistics For Year 2008 (Based on 10 partial tracts)
A) FHA, FSA/RHS & VA Home Purchase Loans
B) Conventional Home Purchase Loans
C) Refinancings
D) Home Improvement Loans
E) Loans on Dwellings For 5+ Families
F) Non-occupant Loans on < 5 Family Dwellings (A B C & D)
G) Loans On Manufactured Home Dwelling (A B C & D)
Number
Average Value
Number
Average Value
Number
Average Value
Number
Average Value
Number
Average Value
Number
Average Value
Number
Average Value
LOANS ORIGINATED
143
$206,004
333
$184,802
429
$192,359
31
$124,885
0
$0
302
$167,461
49
$156,953
APPLICATIONS APPROVED, NOT ACCEPTED
15
$206,040
45
$215,185
104
$203,939
12
$107,720
0
$0
56
$172,092
10
$124,117
APPLICATIONS DENIED
39
$189,384
100
$231,246
519
$223,538
71
$127,925
1
$396,160
140
$177,516
49
$140,163
APPLICATIONS WITHDRAWN
24
$210,618
55
$187,756
171
$207,090
23
$142,623
0
$0
54
$172,392
11
$150,261
FILES CLOSED FOR INCOMPLETENESS
3
$222,677
20
$248,040
53
$236,084
10
$129,383
0
$0
19
$237,909
3
$109,603
Aggregated Statistics For Year 2007 (Based on 10 partial tracts)
A) FHA, FSA/RHS & VA Home Purchase Loans
B) Conventional Home Purchase Loans
C) Refinancings
D) Home Improvement Loans
E) Loans on Dwellings For 5+ Families
F) Non-occupant Loans on < 5 Family Dwellings (A B C & D)
G) Loans On Manufactured Home Dwelling (A B C & D)
Number
Average Value
Number
Average Value
Number
Average Value
Number
Average Value
Number
Average Value
Number
Average Value
Number
Average Value
LOANS ORIGINATED
31
$210,434
612
$212,111
1,126
$215,897
172
$132,385
4
$656,140
524
$202,387
96
$164,443
APPLICATIONS APPROVED, NOT ACCEPTED
2
$133,120
124
$224,857
257
$230,616
33
$104,656
0
$0
87
$209,454
23
$132,007
APPLICATIONS DENIED
10
$173,954
270
$220,429
983
$242,250
193
$132,644
0
$0
235
$232,528
72
$141,788
APPLICATIONS WITHDRAWN
11
$180,561
115
$240,168
411
$225,528
56
$171,249
0
$0
86
$227,805
29
$169,264
FILES CLOSED FOR INCOMPLETENESS
1
$268,650
34
$220,776
136
$244,781
17
$143,632
0
$0
34
$197,792
5
$196,320
Aggregated Statistics For Year 2006 (Based on 10 partial tracts)
A) FHA, FSA/RHS & VA Home Purchase Loans
B) Conventional Home Purchase Loans
C) Refinancings
D) Home Improvement Loans
E) Loans on Dwellings For 5+ Families
F) Non-occupant Loans on < 5 Family Dwellings (A B C & D)
G) Loans On Manufactured Home Dwelling (A B C & D)
Number
Average Value
Number
Average Value
Number
Average Value
Number
Average Value
Number
Average Value
Number
Average Value
Number
Average Value
LOANS ORIGINATED
35
$189,371
1,346
$194,884
1,608
$207,324
268
$123,795
1
$445,680
810
$191,200
119
$157,069
APPLICATIONS APPROVED, NOT ACCEPTED
3
$265,337
219
$192,021
312
$210,312
59
$118,686
0
$0
110
$201,538
23
$135,440
APPLICATIONS DENIED
5
$132,132
564
$205,449
876
$208,372
206
$113,085
0
$0
252
$194,183
99
$161,731
APPLICATIONS WITHDRAWN
8
$194,330
244
$181,999
714
$208,428
79
$148,170
0
$0
123
$202,703
34
$124,324
FILES CLOSED FOR INCOMPLETENESS
2
$227,670
59
$224,769
146
$208,335
13
$139,918
0
$0
34
$188,705
8
$162,939
Aggregated Statistics For Year 2005 (Based on 10 partial tracts)
A) FHA, FSA/RHS & VA Home Purchase Loans
B) Conventional Home Purchase Loans
C) Refinancings
D) Home Improvement Loans
E) Loans on Dwellings For 5+ Families
F) Non-occupant Loans on < 5 Family Dwellings (A B C & D)
G) Loans On Manufactured Home Dwelling (A B C & D)
Number
Average Value
Number
Average Value
Number
Average Value
Number
Average Value
Number
Average Value
Number
Average Value
Number
Average Value
LOANS ORIGINATED
39
$164,273
1,610
$175,783
1,809
$175,113
207
$117,095
3
$421,250
1,003
$167,757
113
$141,397
APPLICATIONS APPROVED, NOT ACCEPTED
4
$192,818
272
$158,914
305
$189,164
40
$90,546
0
$0
131
$177,000
42
$106,833
APPLICATIONS DENIED
15
$148,852
537
$166,505
890
$177,883
161
$94,507
0
$0
214
$184,693
91
$117,080
APPLICATIONS WITHDRAWN
10
$159,695
295
$168,940
725
$170,748
98
$130,722
0
$0
164
$154,429
42
$122,927
FILES CLOSED FOR INCOMPLETENESS
5
$150,334
52
$177,013
221
$165,963
12
$106,729
0
$0
33
$181,410
5
$197,418
Aggregated Statistics For Year 2004 (Based on 10 partial tracts)
A) FHA, FSA/RHS & VA Home Purchase Loans
B) Conventional Home Purchase Loans
C) Refinancings
D) Home Improvement Loans
E) Loans on Dwellings For 5+ Families
F) Non-occupant Loans on < 5 Family Dwellings (A B C & D)
G) Loans On Manufactured Home Dwelling (A B C & D)
Number
Average Value
Number
Average Value
Number
Average Value
Number
Average Value
Number
Average Value
Number
Average Value
Number
Average Value
LOANS ORIGINATED
66
$125,454
1,494
$150,663
1,679
$141,971
202
$102,965
4
$441,718
959
$142,282
101
$111,991
APPLICATIONS APPROVED, NOT ACCEPTED
8
$141,379
246
$151,371
341
$133,137
36
$79,798
1
$458,560
121
$134,652
36
$88,148
APPLICATIONS DENIED
10
$145,341
340
$125,735
753
$139,289
151
$70,979
2
$597,210
170
$130,418
71
$95,726
APPLICATIONS WITHDRAWN
17
$127,303
228
$135,662
607
$136,951
71
$86,753
0
$0
93
$139,779
22
$100,421
FILES CLOSED FOR INCOMPLETENESS
0
$0
46
$160,782
145
$138,056
18
$104,630
0
$0
22
$107,644
4
$105,830
Aggregated Statistics For Year 2003 (Based on 10 partial tracts)
A) FHA, FSA/RHS & VA Home Purchase Loans
B) Conventional Home Purchase Loans
C) Refinancings
D) Home Improvement Loans
E) Loans on Dwellings For 5+ Families
F) Non-occupant Loans on < 5 Family Dwellings (A B C & D)
Number
Average Value
Number
Average Value
Number
Average Value
Number
Average Value
Number
Average Value
Number
Average Value
LOANS ORIGINATED
94
$108,352
1,060
$128,223
2,150
$124,130
76
$53,295
1
$730,550
993
$115,420
APPLICATIONS APPROVED, NOT ACCEPTED
5
$98,274
139
$126,865
355
$126,968
23
$49,453
0
$0
115
$125,074
APPLICATIONS DENIED
13
$121,935
211
$123,358
688
$112,290
60
$48,705
0
$0
156
$111,944
APPLICATIONS WITHDRAWN
14
$98,683
145
$134,654
551
$119,855
12
$40,762
0
$0
98
$108,539
FILES CLOSED FOR INCOMPLETENESS
5
$100,198
40
$134,650
111
$116,925
11
$46,384
0
$0
24
$111,900
Aggregated Statistics For Year 2002 (Based on 8 partial tracts)
A) FHA, FSA/RHS & VA Home Purchase Loans
B) Conventional Home Purchase Loans
C) Refinancings
D) Home Improvement Loans
E) Loans on Dwellings For 5+ Families
F) Non-occupant Loans on < 5 Family Dwellings (A B C & D)
Number
Average Value
Number
Average Value
Number
Average Value
Number
Average Value
Number
Average Value
Number
Average Value
LOANS ORIGINATED
114
$96,959
922
$109,320
1,203
$109,367
42
$35,730
1
$229,770
726
$97,364
APPLICATIONS APPROVED, NOT ACCEPTED
6
$91,067
70
$119,751
209
$103,126
25
$31,716
0
$0
48
$87,493
APPLICATIONS DENIED
15
$88,959
129
$88,713
460
$98,801
43
$35,846
1
$242,650
94
$82,327
APPLICATIONS WITHDRAWN
22
$80,419
92
$99,220
332
$103,469
14
$55,775
0
$0
53
$91,378
FILES CLOSED FOR INCOMPLETENESS
4
$96,795
29
$99,616
119
$111,149
2
$81,340
0
$0
17
$79,369
Aggregated Statistics For Year 2001 (Based on 8 partial tracts)
A) FHA, FSA/RHS & VA Home Purchase Loans
B) Conventional Home Purchase Loans
C) Refinancings
D) Home Improvement Loans
E) Loans on Dwellings For 5+ Families
F) Non-occupant Loans on < 5 Family Dwellings (A B C & D)
Number
Average Value
Number
Average Value
Number
Average Value
Number
Average Value
Number
Average Value
Number
Average Value
LOANS ORIGINATED
147
$99,149
698
$93,128
766
$106,020
31
$28,545
5
$327,624
451
$87,023
APPLICATIONS APPROVED, NOT ACCEPTED
6
$111,530
62
$79,241
132
$92,719
7
$40,327
0
$0
39
$69,316
APPLICATIONS DENIED
10
$90,026
95
$85,074
374
$88,663
38
$28,212
0
$0
65
$73,982
APPLICATIONS WITHDRAWN
17
$110,439
75
$105,267
254
$96,686
11
$44,549
0
$0
42
$87,914
FILES CLOSED FOR INCOMPLETENESS
2
$59,355
14
$83,431
50
$89,517
1
$36,590
1
$544,720
9
$66,016
Aggregated Statistics For Year 2000 (Based on 8 partial tracts)
A) FHA, FSA/RHS & VA Home Purchase Loans
B) Conventional Home Purchase Loans
C) Refinancings
D) Home Improvement Loans
E) Loans on Dwellings For 5+ Families
F) Non-occupant Loans on < 5 Family Dwellings (A B C & D)
Number
Average Value
Number
Average Value
Number
Average Value
Number
Average Value
Number
Average Value
Number
Average Value
LOANS ORIGINATED
134
$88,220
642
$77,772
248
$89,028
47
$30,842
1
$241,660
261
$75,386
APPLICATIONS APPROVED, NOT ACCEPTED
11
$83,019
58
$85,090
64
$94,282
26
$37,000
0
$0
29
$58,519
APPLICATIONS DENIED
13
$81,724
106
$78,512
215
$66,711
54
$26,412
1
$406,060
49
$67,886
APPLICATIONS WITHDRAWN
11
$88,002
58
$85,856
126
$60,819
5
$22,888
0
$0
30
$66,245
FILES CLOSED FOR INCOMPLETENESS
3
$87,127
13
$114,072
46
$84,000
0
$0
0
$0
10
$52,930
Aggregated Statistics For Year 1999 (Based on 5 partial tracts)
A) FHA, FSA/RHS & VA Home Purchase Loans
B) Conventional Home Purchase Loans
C) Refinancings
D) Home Improvement Loans
F) Non-occupant Loans on < 5 Family Dwellings (A B C & D)
2005 - 2018 National Fire Incident Reporting System (NFIRS) incidents
According to the data from the years 2005 - 2018 the average number of fires per year is 28. The highest number of fire incidents - 64 took place in 2008, and the least - 4 in 2006. The data has a growing trend.
When looking into fire subcategories, the most incidents belonged to: Outside Fires (54.4%), and Structure Fires (25.8%).
Fire incident types reported to NFIRS in Zip Code 92356


 Nearest zip codes: 92307, 92333, 92314, 92315, 92308, 92386.


 According to the data from the years 2005 - 2018 the average number of fires per year is 28. The highest number of fire incidents - 64 took place in 2008, and the least - 4 in 2006. The data has a growing trend.
 When looking into fire subcategories, the most incidents belonged to: Outside Fires (54.4%), and Structure Fires (25.8%).