Estimated zip code population in 2022: 755 Zip code population in 2010: 707 Zip code population in 2000: 1,077
Houses and condos: 426 Renter-occupied apartments: 50
% of renters here:
15%
State:
44%
March 2022 cost of living index in zip code 92358: 75.8 (low, U.S. average is 100)
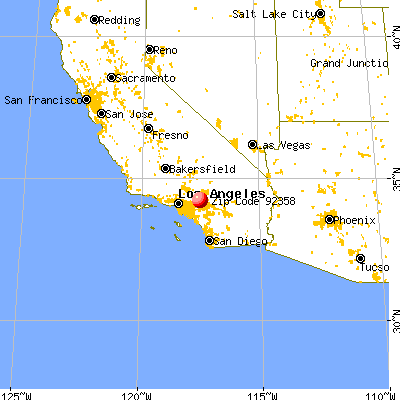
Land area: 19.8 sq. mi. Water area: 0.0 sq. mi.
Population density: 38 people per square mile
(very low).
OSM Map
General Map
Google Map
MSN Map
OSM Map
General Map
Google Map
MSN Map
OSM Map
General Map
Google Map
MSN Map
OSM Map
General Map
Google Map
MSN Map
Please wait while loading the map...
Real estate property taxes paid for housing units in 2022:
This zip code:
0.5% ($2,677)
California:
0.7% ($4,831)
Median real estate property taxes paid for housing units with mortgages in 2022: $2,635 (0.5%) Median real estate property taxes paid for housing units with no mortgage in 2022: $2,816 (0.6%)
Business Search- 14 Million verified businesses
Males: 404
(53.5%)
Females: 351
(46.5%)
For population 25 years and over in 92358:
High school or higher: 80.9%
Bachelor's degree or higher: 14.6%
Graduate or professional degree: 6.8%
Unemployed: 5.6%
Mean travel time to work (commute): 47.2 minutes
For population 15 years and over in 92358:
Never married: 32.3%
Now married: 48.2%
Separated: 0.9%
Widowed: 3.4%
Divorced: 15.1%
Zip code 92358 compared to state average:
Black race population percentage significantly below state average.
Median age above state average.
Foreign-born population percentage significantly below state average.
Renting percentage significantly below state average.
Length of stay since moving in significantly below state average.
Percentage of population with a bachelor's degree or higher below state average.
Averages for the 2020 tax year for zip code 92358, filed in 2021:
Average Adjusted Gross Income (AGI) in 2020: $57,562 (Individual Income Tax Returns)
Here:
$57,562
State:
$95,910
Salary/wage: $50,686 (reported on 71.8% of returns)
Here:
$50,686
State:
$77,331
(% of AGI for various income ranges: 1066.7% for AGIs below $25k, 3853.3% for AGIs $25k-50k, 6985.0% for AGIs $50k-75k, 12770.0% for AGIs $75k-100k, 18573.3% for AGIs $100k-200k)
Taxable interest for individuals: $308 (reported on 30.8% of returns)
This zip code:
$308
California:
$2,294
(% of AGI for various income ranges: 6.7% for AGIs below $25k, 55.0% for AGIs $50k-75k, 30.0% for AGIs $75k-100k, 10.0% for AGIs $100k-200k)
Ordinary dividends: $1,225 (reported on 10.3% of returns)
Here:
$1,225
State:
$10,949
(% of AGI for various income ranges: 122.5% for AGIs $50k-75k)
Net capital gain/loss in AGI: +$4,440 (reported on 12.8% of returns)
Here:
+$4,440
State:
+$49,306
(% of AGI for various income ranges: 43.3% for AGIs below $25k, 457.5% for AGIs $50k-75k)
Profit/loss from business: +$2,500 (reported on 15.4% of returns)
Here:
+$2,500
State:
+$15,671
(% of AGI for various income ranges: 167.8% for AGIs below $25k)
Total itemized deductions: $29,450 (reported on 10.3% of returns)
Here:
$29,450
State:
$39,517
(% of AGI for various income ranges: 5890.0% for AGIs $75k-100k)
Charity contributions: $7,367 (reported on 7.7% of returns)
Here:
$7,367
State:
$12,598
(% of AGI for various income ranges: 1105.0% for AGIs $75k-100k)
Taxes paid: $8,625 (reported on 10.3% of returns)
92358:
$8,625
State:
$8,807
(% of AGI for various income ranges: 430.0% for AGIs $50k-75k, 576.7% for AGIs $100k-200k)
Earned income credit: $1,825 (reported on 10.3% of returns)
Here:
$1,825
State:
$2,074
(% of AGI for various income ranges: 81.1% for AGIs below $25k)
Percentage of individuals using paid preparers for their 2020 taxes: 89.7%
Here:
90%
State:
92%
(% for various income ranges: 92.9% for AGIs below $25k, 87.5% for AGIs $25k-50k, 85.7% for AGIs $50k-75k, 100.0% for AGIs $75k-100k, 83.3% for AGIs $100k-200k)
Averages for the 2012 tax year for zip code 92358, filed in 2013:
Average Adjusted Gross Income (AGI) in 2012: $48,626 (Individual Income Tax Returns)
Here:
$48,626
State:
$72,726
Salary/wage: $45,115 (reported on 77.1% of returns)
Here:
$45,115
State:
$59,079
(% of AGI for various income ranges: 58.1% for AGIs below $25k, 65.3% for AGIs $25k-50k, 74.5% for AGIs $50k-75k, 76.0% for AGIs $75k-100k, 74.9% for AGIs $100k-200k)
Taxable interest for individuals: $492 (reported on 37.1% of returns)
This zip code:
$492
California:
$2,146
(% of AGI for various income ranges: 0.4% for AGIs below $25k, 0.6% for AGIs $25k-50k, 0.5% for AGIs $50k-75k, 0.3% for AGIs $100k-200k)
Ordinary dividends: $1,140 (reported on 14.3% of returns)
Here:
$1,140
State:
$9,308
Profit/loss from business: +$6,540 (reported on 14.3% of returns)
Here:
+$6,540
State:
+$17,064
Taxable individual retirement arrangement distribution: $8,250 (reported on 5.7% of returns)
92358:
$8,250
California:
$19,557
Total itemized deductions: $19,693 (26% of AGI, reported on 40.0% of returns)
Here:
$19,693
State:
$34,004
Here:
25.5% of AGI
State:
22.7% of AGI
(% of AGI for various income ranges: 18.2% for AGIs $25k-50k, 19.2% for AGIs $50k-75k, 18.2% for AGIs $75k-100k, 16.7% for AGIs $100k-200k)
Charity contributions: $2,827 (reported on 31.4% of returns)
Here:
$2,827
State:
$4,659
(% of AGI for various income ranges: 1.9% for AGIs $25k-50k, 3.1% for AGIs $50k-75k, 2.0% for AGIs $100k-200k)
Taxes paid: $6,157 (reported on 40.0% of returns)
92358:
$6,157
State:
$14,448
(% of AGI for various income ranges: 3.5% for AGIs $25k-50k, 5.1% for AGIs $50k-75k, 6.9% for AGIs $75k-100k, 6.6% for AGIs $100k-200k)
Earned income credit: $2,217 (reported on 17.1% of returns)
Here:
$2,217
State:
$2,286
(% of AGI for various income ranges: 8.3% for AGIs below $25k)
Percentage of individuals using paid preparers for their 2012 taxes: 60.0%
Here:
60%
State:
64%
(% for various income ranges: 53.8% for AGIs below $25k, 55.6% for AGIs $25k-50k, 85.7% for AGIs $50k-75k, 75.0% for AGIs $100k-200k)
Averages for the 2004 tax year for zip code 92358, filed in 2005:
Average Adjusted Gross Income (AGI) in 2004: $47,751 (Individual Income Tax Returns)
Here:
$47,751
State:
$58,600
Salary/wage: $40,754 (reported on 77.1% of returns)
Here:
$40,754
State:
$49,455
(% of AGI for various income ranges: 79.8% for AGIs below $10k, 62.8% for AGIs $10k-25k, 76.1% for AGIs $25k-50k, 83.0% for AGIs $50k-75k, 68.4% for AGIs $75k-100k, 51.5% for AGIs over 100k)
Taxable interest for individuals: $1,202 (reported on 48.3% of returns)
This zip code:
$1,202
California:
$2,365
(% of AGI for various income ranges: 1.7% for AGIs below $10k, 4.2% for AGIs $10k-25k, 0.7% for AGIs $25k-50k, 0.4% for AGIs $50k-75k, 1.0% for AGIs $75k-100k, 1.2% for AGIs over 100k)
Taxable dividends: $1,205 (reported on 20.4% of returns)
Here:
$1,205
State:
$4,746
(% of AGI for various income ranges: 2.1% for AGIs $10k-25k, 0.7% for AGIs $25k-50k, 0.2% for AGIs $50k-75k, 0.3% for AGIs over 100k)
Net capital gain/loss: +$18,653 (reported on 13.7% of returns)
Here:
+$18,653
State:
+$23,418
Profit/loss from business: +$6,019 (reported on 14.8% of returns)
Here:
+$6,019
State:
+$16,826
Total itemized deductions: $21,255 (30% of AGI, reported on 46.1% of returns)
Here:
$21,255
State:
$28,113
Here:
29.7% of AGI
State:
25.3% of AGI
(% of AGI for various income ranges: 22.9% for AGIs $10k-25k, 18.7% for AGIs $25k-50k, 21.3% for AGIs $50k-75k, 27.3% for AGIs $75k-100k, 18.7% for AGIs over 100k)
Charity contributions deductions: $2,182 (3% of AGI, reported on 39.9% of returns)
Here:
$2,182
State:
$3,923
Here:
3.1% of AGI
State:
3.3% of AGI
(% of AGI for various income ranges: 1.5% for AGIs $10k-25k, 2.4% for AGIs $25k-50k, 2.3% for AGIs $50k-75k, 2.8% for AGIs $75k-100k, 1.0% for AGIs over 100k)
Total tax: $7,021 (reported on 78.2% of returns)
92358:
$7,021
State:
$10,761
(% of AGI for various income ranges: 3.4% for AGIs below $10k, 4.4% for AGIs $10k-25k, 6.7% for AGIs $25k-50k, 9.9% for AGIs $50k-75k, 11.3% for AGIs $75k-100k, 17.3% for AGIs over 100k)
Earned income credit: $1,579 (reported on 10.6% of returns)
Here:
$1,579
State:
$1,763
Percentage of individuals using paid preparers for their 2004 taxes: 64.5%
Here:
65%
State:
66%
(% for various income ranges: 53.7% for AGIs below $10k, 64.6% for AGIs $10k-25k, 59.8% for AGIs $25k-50k, 68.3% for AGIs $50k-75k, 75.9% for AGIs $75k-100k, 83.9% for AGIs over 100k)
Household received Food Stamps/SNAP in the past 12 months: 26 Household did not receive Food Stamps/SNAP in the past 12 months: 304
Women who did not have a birth in the past 12 months: 187 (82 now married, 104 unmarried)
Housing units in zip code 92358 with a mortgage: 162 (28 second mortgage, 11 both second mortgage and home equity loan) Median monthly owner costs for units with a mortgage: $3,398 Median monthly owner costs for units without a mortgage: $673
Residents with income below the poverty level in 2022:
This zip code:
12.8%
Whole state:
12.2%
Residents with income below 50% of the poverty level in 2022:
This zip code:
4.6%
Whole state:
6.2%
Median number of rooms in houses and condos:
Here:
6.6
State:
6.0
Median number of rooms in apartments:
Here:
3.6
State:
3.9
Notable locations in this zip code not listed on our city pages
Notable locations in zip code 92358: Stone House Crossing Campground (A), Glenn Ranch (B), Nielson Ranch (C), Applewhite Campground (D), Sharpless Ranch (E), Clyde Ranch (F), Lytle Creek Ranger Station (G), San Bernardino National Forest Cajon Ranger Station (H), San Bernardino County Fire Department Station 20 - Lytle Creek (I). Display/hide their locations on the map
In group quarters: 32 (-1 institutionalized population)
Size of family households: 101 2-persons, 23 3-persons, 65 4-persons
Size of nonfamily households: 94 1-person, 51 2-persons
26 married couples with children.
20 single-parent households (20 women).
92.5% of residents of 92358 zip code speak English at home.
2.7% of residents speak Spanish at home (100% very well).
2.5% of residents speak other Indo-European language at home (100% very well).
1.2% of residents speak Asian or Pacific Island language at home (100% very well).
Foreign born population: 25 (3.3%) (100.0% of them are naturalized citizens)
This zip code:
3.3%
Whole state:
26.7%
79%Honduras
21%Japan
14%Italian
10%English
4%German
3%Dutch
3%Norwegian
2%European
Year of entry for the foreign-born population
02010 or later
192000 to 2009
01990 to 1999
4Before 1990
Facilities with environmental interests located in this zip code:
LYTLE CREEK POWERHOUSE (LYTLE CREEK CANYON RD in LYTLE CREEK, CA)
(Resource Conservation and Recovery Act (tracking hazardous waste)) Organizations: SOUTHERN CALIFORNIA EDISON CO (CONTACT/OWNER)
AMER TELE & TELE CO LYTLE CREEK (3 MI S OF in LYTLE CREEK, CA)
Small Quantity Generators, between 100 kg and 1000 kg of hazardous waste/month (Resource Conservation and Recovery Act (tracking hazardous waste))
Housing units lacking complete kitchen facilities: 4.7%
42.6%Bottled, tank, or LP gas
25.7%Wood
14.4%Electricity
7.0%Fuel oil, kerosene, etc.
6.7%Other fuel
4.3%Utility gas
Population in 1990: 625. Population change in the 1990s: +452 (+72.3%).
Place of birth for U.S.-born residents:
This state: 590
Northeast: 18
Midwest: 31
South: 51
West: 36
63% of the 92358 zip code residents lived in the same house 5 years ago. Out of people who lived in different houses, 73% lived in this county. Out of people who lived in different counties, 50% lived in California.
98% of the 92358 zip code residents lived in the same house 1 year ago. Out of people who lived in different houses, 125% moved from different county within same state.
Private vs. public school enrollment:
Students in private schools in grades 1 to 8 (elementary and middle school):
Here:
0.0%
California:
10.5%
Students in private schools in grades 9 to 12 (high school):
Here:
0.0%
California:
8.5%
Students in private undergraduate colleges:
Here:
0.0%
California:
15.9%
Occupation by median earnings in the past 12 months ($)
68,290Management occupations
47,739Sales and related occupations
29,287Education, training, and library occupations
Top industries in this zip code by the number of employees in 2005:
Accommodation and Food Services: RV (Recreational Vehicle) Parks and Campgrounds (50-99 employees: 1 establishment)
Construction: Painting and Wall Covering Contractors (10-19: 1)
Accommodation and Food Services: Full-Service Restaurants (5-9: 1)
Accommodation and Food Services: Recreational and Vacation Camps (except Campgrounds) (5-9: 1)
Construction: Drywall and Insulation Contractors (1-4: 1)
Professional, Scientific, and Technical Services: Research and Development in the Social Sciences and Humanities (1-4: 1)
Professional, Scientific, and Technical Services: Advertising Agencies (1-4: 1)
Construction: Poured Concrete Foundation and Structure Contractors (1-4: 1)
Fatal accident statistics in 2012:
Fatal accident count: 1
Vehicles involved in fatal accidents: 1
Fatal accidents caused by drunken drivers: 1
Fatalities: 1
Persons involved in fatal accidents: 3
Pedestrians involved in fatal accidents: 1
Fatal accident statistics in 2011:
Fatal accident count: 1
Vehicles involved in fatal accidents: 1
Fatal accidents caused by drunken drivers: 0
Fatalities: 1
Persons involved in fatal accidents: 1
Pedestrians involved in fatal accidents: 0
Home Mortgage Disclosure Act Aggregated Statistics For Year 2009 (Based on 2 partial tracts)
A) FHA, FSA/RHS & VA Home Purchase Loans
B) Conventional Home Purchase Loans
C) Refinancings
D) Home Improvement Loans
F) Non-occupant Loans on < 5 Family Dwellings (A B C & D)
G) Loans On Manufactured Home Dwelling (A B C & D)
Number
Average Value
Number
Average Value
Number
Average Value
Number
Average Value
Number
Average Value
Number
Average Value
LOANS ORIGINATED
13
$187,848
56
$227,532
104
$230,614
4
$69,792
36
$148,478
0
$0
APPLICATIONS APPROVED, NOT ACCEPTED
0
$0
10
$174,934
16
$179,722
0
$0
6
$111,002
0
$0
APPLICATIONS DENIED
4
$181,508
11
$231,444
76
$251,276
3
$83,210
12
$155,068
1
$119,100
APPLICATIONS WITHDRAWN
1
$69,550
12
$196,753
34
$275,751
3
$120,370
7
$122,911
0
$0
FILES CLOSED FOR INCOMPLETENESS
1
$124,820
0
$0
10
$274,502
0
$0
0
$0
0
$0
Aggregated Statistics For Year 2008 (Based on 2 partial tracts)
A) FHA, FSA/RHS & VA Home Purchase Loans
B) Conventional Home Purchase Loans
C) Refinancings
D) Home Improvement Loans
F) Non-occupant Loans on < 5 Family Dwellings (A B C & D)
G) Loans On Manufactured Home Dwelling (A B C & D)
Number
Average Value
Number
Average Value
Number
Average Value
Number
Average Value
Number
Average Value
Number
Average Value
LOANS ORIGINATED
5
$239,344
52
$239,061
84
$236,294
10
$110,906
22
$167,390
2
$149,590
APPLICATIONS APPROVED, NOT ACCEPTED
1
$98,140
8
$241,535
27
$247,657
0
$0
7
$166,876
1
$98,140
APPLICATIONS DENIED
2
$312,995
9
$455,332
72
$258,950
14
$129,104
15
$177,983
1
$243,920
APPLICATIONS WITHDRAWN
2
$175,315
9
$329,033
33
$263,955
2
$22,865
3
$254,080
1
$151,500
FILES CLOSED FOR INCOMPLETENESS
0
$0
4
$288,460
5
$317,472
1
$23,820
3
$214,063
0
$0
Aggregated Statistics For Year 2007 (Based on 2 partial tracts)
A) FHA, FSA/RHS & VA Home Purchase Loans
B) Conventional Home Purchase Loans
C) Refinancings
D) Home Improvement Loans
F) Non-occupant Loans on < 5 Family Dwellings (A B C & D)
G) Loans On Manufactured Home Dwelling (A B C & D)
Number
Average Value
Number
Average Value
Number
Average Value
Number
Average Value
Number
Average Value
Number
Average Value
LOANS ORIGINATED
0
$0
103
$232,326
195
$250,142
38
$203,398
57
$208,396
6
$126,405
APPLICATIONS APPROVED, NOT ACCEPTED
0
$0
13
$262,533
53
$285,103
5
$269,452
17
$239,825
1
$235,340
APPLICATIONS DENIED
1
$302,990
37
$291,582
140
$286,956
22
$143,916
15
$241,122
6
$153,400
APPLICATIONS WITHDRAWN
1
$291,560
10
$248,490
60
$318,076
6
$261,227
12
$241,693
0
$0
FILES CLOSED FOR INCOMPLETENESS
0
$0
9
$276,947
26
$260,627
4
$67,888
6
$150,225
2
$109,570
Aggregated Statistics For Year 2006 (Based on 2 partial tracts)
A) FHA, FSA/RHS & VA Home Purchase Loans
B) Conventional Home Purchase Loans
C) Refinancings
D) Home Improvement Loans
F) Non-occupant Loans on < 5 Family Dwellings (A B C & D)
G) Loans On Manufactured Home Dwelling (A B C & D)
Number
Average Value
Number
Average Value
Number
Average Value
Number
Average Value
Number
Average Value
Number
Average Value
LOANS ORIGINATED
2
$157,210
159
$263,278
308
$243,023
50
$149,914
69
$200,848
6
$139,903
APPLICATIONS APPROVED, NOT ACCEPTED
0
$0
32
$403,511
56
$269,285
9
$114,124
21
$174,907
1
$239,150
APPLICATIONS DENIED
0
$0
57
$374,902
148
$260,597
29
$206,429
33
$228,325
2
$108,620
APPLICATIONS WITHDRAWN
0
$0
30
$227,878
124
$266,185
8
$173,290
16
$209,259
0
$0
FILES CLOSED FOR INCOMPLETENESS
0
$0
10
$275,740
30
$235,977
5
$149,208
3
$257,573
1
$85,750
Aggregated Statistics For Year 2005 (Based on 2 partial tracts)
A) FHA, FSA/RHS & VA Home Purchase Loans
B) Conventional Home Purchase Loans
C) Refinancings
D) Home Improvement Loans
F) Non-occupant Loans on < 5 Family Dwellings (A B C & D)
G) Loans On Manufactured Home Dwelling (A B C & D)
Number
Average Value
Number
Average Value
Number
Average Value
Number
Average Value
Number
Average Value
Number
Average Value
LOANS ORIGINATED
1
$223,910
215
$219,374
313
$222,642
47
$121,391
85
$195,705
3
$92,420
APPLICATIONS APPROVED, NOT ACCEPTED
0
$0
39
$235,219
52
$245,511
6
$116,877
11
$192,465
3
$179,760
APPLICATIONS DENIED
0
$0
70
$196,141
154
$239,400
41
$113,592
16
$226,886
4
$133,868
APPLICATIONS WITHDRAWN
0
$0
41
$284,492
143
$258,602
12
$231,292
11
$176,008
2
$80,990
FILES CLOSED FOR INCOMPLETENESS
1
$187,700
9
$237,777
40
$242,702
5
$121,006
3
$226,767
0
$0
Aggregated Statistics For Year 2004 (Based on 2 partial tracts)
A) FHA, FSA/RHS & VA Home Purchase Loans
B) Conventional Home Purchase Loans
C) Refinancings
D) Home Improvement Loans
E) Loans on Dwellings For 5+ Families
F) Non-occupant Loans on < 5 Family Dwellings (A B C & D)
G) Loans On Manufactured Home Dwelling (A B C & D)
Number
Average Value
Number
Average Value
Number
Average Value
Number
Average Value
Number
Average Value
Number
Average Value
Number
Average Value
LOANS ORIGINATED
4
$180,555
289
$202,630
392
$187,556
54
$106,043
0
$0
110
$167,364
4
$93,375
APPLICATIONS APPROVED, NOT ACCEPTED
0
$0
48
$258,010
73
$190,403
10
$109,858
0
$0
9
$161,447
6
$143,238
APPLICATIONS DENIED
2
$176,270
68
$254,664
151
$186,162
35
$117,875
1
$762,240
43
$150,232
8
$92,421
APPLICATIONS WITHDRAWN
0
$0
42
$191,422
161
$177,475
17
$120,557
0
$0
19
$141,165
1
$64,790
FILES CLOSED FOR INCOMPLETENESS
0
$0
7
$241,330
23
$178,961
1
$117,190
0
$0
3
$107,350
0
$0
Aggregated Statistics For Year 2003 (Based on 2 partial tracts)
A) FHA, FSA/RHS & VA Home Purchase Loans
B) Conventional Home Purchase Loans
C) Refinancings
D) Home Improvement Loans
F) Non-occupant Loans on < 5 Family Dwellings (A B C & D)
Number
Average Value
Number
Average Value
Number
Average Value
Number
Average Value
Number
Average Value
LOANS ORIGINATED
2
$201,995
218
$173,663
593
$158,743
27
$64,473
111
$125,478
APPLICATIONS APPROVED, NOT ACCEPTED
0
$0
39
$170,600
86
$147,762
6
$59,550
15
$115,035
APPLICATIONS DENIED
0
$0
38
$200,890
153
$144,975
16
$61,456
21
$121,777
APPLICATIONS WITHDRAWN
0
$0
20
$199,135
125
$172,053
5
$53,356
10
$129,390
FILES CLOSED FOR INCOMPLETENESS
0
$0
7
$165,651
32
$148,726
1
$33,350
3
$72,730
Aggregated Statistics For Year 2002 (Based on 2 partial tracts)
A) FHA, FSA/RHS & VA Home Purchase Loans
B) Conventional Home Purchase Loans
C) Refinancings
D) Home Improvement Loans
F) Non-occupant Loans on < 5 Family Dwellings (A B C & D)
Number
Average Value
Number
Average Value
Number
Average Value
Number
Average Value
Number
Average Value
LOANS ORIGINATED
10
$153,306
205
$143,599
397
$148,003
13
$47,787
85
$115,905
APPLICATIONS APPROVED, NOT ACCEPTED
0
$0
21
$136,523
88
$150,012
4
$28,345
15
$101,251
APPLICATIONS DENIED
0
$0
33
$138,560
117
$153,873
8
$33,110
12
$101,076
APPLICATIONS WITHDRAWN
2
$117,670
20
$143,396
100
$137,041
6
$23,343
10
$138,251
FILES CLOSED FOR INCOMPLETENESS
2
$128,150
10
$156,069
30
$146,477
3
$52,087
6
$86,070
Aggregated Statistics For Year 2001 (Based on 2 partial tracts)
A) FHA, FSA/RHS & VA Home Purchase Loans
B) Conventional Home Purchase Loans
C) Refinancings
D) Home Improvement Loans
F) Non-occupant Loans on < 5 Family Dwellings (A B C & D)
Number
Average Value
Number
Average Value
Number
Average Value
Number
Average Value
Number
Average Value
LOANS ORIGINATED
15
$138,601
177
$129,710
210
$142,598
8
$31,085
53
$96,359
APPLICATIONS APPROVED, NOT ACCEPTED
0
$0
23
$179,085
49
$133,431
1
$28,580
11
$106,194
APPLICATIONS DENIED
5
$134,344
44
$124,189
84
$107,961
6
$42,558
13
$109,498
APPLICATIONS WITHDRAWN
0
$0
30
$107,762
69
$136,596
4
$46,925
10
$137,680
FILES CLOSED FOR INCOMPLETENESS
1
$147,680
4
$181,270
22
$153,574
0
$0
5
$104,808
Aggregated Statistics For Year 2000 (Based on 2 partial tracts)
A) FHA, FSA/RHS & VA Home Purchase Loans
B) Conventional Home Purchase Loans
C) Refinancings
D) Home Improvement Loans
F) Non-occupant Loans on < 5 Family Dwellings (A B C & D)
Number
Average Value
Number
Average Value
Number
Average Value
Number
Average Value
Number
Average Value
LOANS ORIGINATED
10
$122,625
126
$126,208
59
$112,204
11
$41,490
27
$82,435
APPLICATIONS APPROVED, NOT ACCEPTED
0
$0
16
$143,932
19
$133,242
7
$36,070
3
$55,897
APPLICATIONS DENIED
1
$116,240
21
$118,964
33
$109,832
10
$38,970
6
$95,915
APPLICATIONS WITHDRAWN
1
$125,770
12
$124,499
19
$110,575
0
$0
4
$72,412
FILES CLOSED FOR INCOMPLETENESS
0
$0
5
$107,286
13
$179,639
1
$23,820
0
$0
Aggregated Statistics For Year 1999 (Based on 1 partial tract)
A) FHA, FSA/RHS & VA Home Purchase Loans
B) Conventional Home Purchase Loans
C) Refinancings
D) Home Improvement Loans
F) Non-occupant Loans on < 5 Family Dwellings (A B C & D)


 Nearest zip codes: 91739, 91737, 92336, 91701, 92407, 92377.


