Estimated zip code population in 2022: 60,442 Zip code population in 2010: 58,002 Zip code population in 2000: 48,645
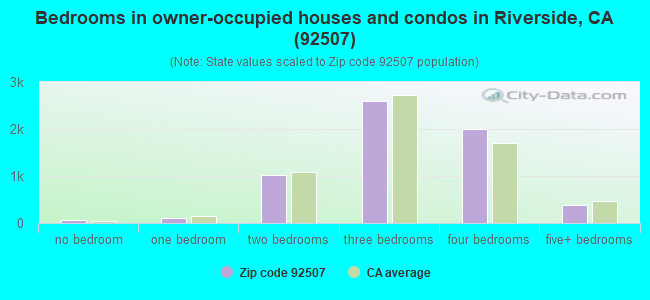
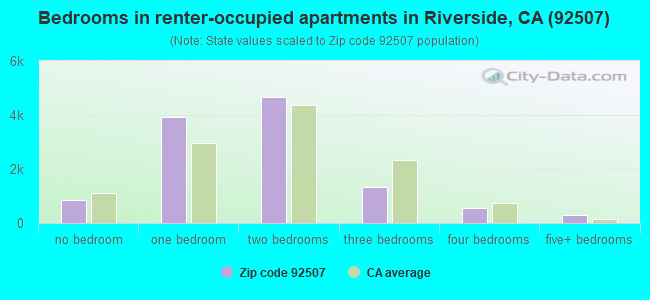
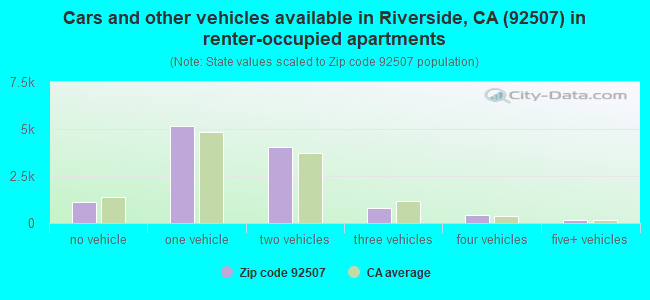
Houses and condos: 19,390 Renter-occupied apartments: 11,654
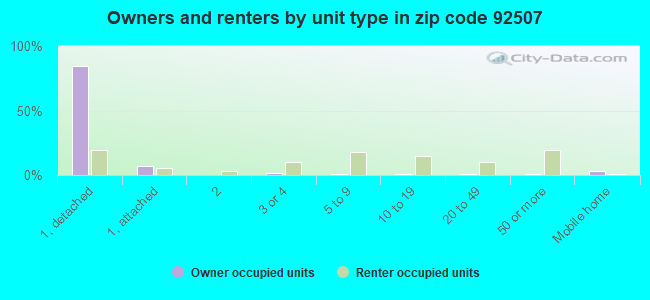
% of renters here:
65%
State:
44%
March 2022 cost of living index in zip code 92507: 83.0 (low, U.S. average is 100)
Land area: 20.2 sq. mi. Water area: 0.0 sq. mi.
Population density: 2,991 people per square mile
(average).
OSM Map
General Map
Google Map
MSN Map
OSM Map
General Map
Google Map
MSN Map
OSM Map
General Map
Google Map
MSN Map
OSM Map
General Map
Google Map
MSN Map
Please wait while loading the map...
Real estate property taxes paid for housing units in 2022:
This zip code:
0.6% ($3,052)
California:
0.7% ($4,831)
Median real estate property taxes paid for housing units with mortgages in 2022: $3,484 (0.7%) Median real estate property taxes paid for housing units with no mortgage in 2022: $2,351 (0.5%)
Averages for the 2020 tax year for zip code 92507, filed in 2021:
Average Adjusted Gross Income (AGI) in 2020: $50,986 (Individual Income Tax Returns)
Here:
$50,986
State:
$95,910
Salary/wage: $45,684 (reported on 86.6% of returns)
Here:
$45,684
State:
$77,331
(% of AGI for various income ranges: 1250.0% for AGIs below $25k, 4026.3% for AGIs $25k-50k, 7531.1% for AGIs $50k-75k, 11281.8% for AGIs $75k-100k, 19746.5% for AGIs $100k-200k, 61653.3% for AGIs over 200k)
Taxable interest for individuals: $819 (reported on 21.5% of returns)
This zip code:
$819
California:
$2,294
(% of AGI for various income ranges: 4.5% for AGIs below $25k, 5.6% for AGIs $25k-50k, 14.3% for AGIs $50k-75k, 32.3% for AGIs $75k-100k, 68.8% for AGIs $100k-200k, 1285.6% for AGIs over 200k)
Ordinary dividends: $4,119 (reported on 7.7% of returns)
Here:
$4,119
State:
$10,949
(% of AGI for various income ranges: 5.2% for AGIs below $25k, 8.0% for AGIs $25k-50k, 16.0% for AGIs $50k-75k, 58.6% for AGIs $75k-100k, 168.8% for AGIs $100k-200k, 2298.9% for AGIs over 200k)
Net capital gain/loss in AGI: +$10,205 (reported on 8.5% of returns)
Here:
+$10,205
State:
+$49,306
(% of AGI for various income ranges: 1.2% for AGIs below $25k, 5.7% for AGIs $25k-50k, 23.1% for AGIs $50k-75k, 120.6% for AGIs $75k-100k, 302.1% for AGIs $100k-200k, 9213.9% for AGIs over 200k)
Profit/loss from business: +$8,593 (reported on 15.1% of returns)
Here:
+$8,593
State:
+$15,671
(% of AGI for various income ranges: 120.5% for AGIs below $25k, 93.3% for AGIs $25k-50k, 150.8% for AGIs $50k-75k, 178.2% for AGIs $75k-100k, 430.8% for AGIs $100k-200k, 4434.4% for AGIs over 200k)
Taxable individual retirement arrangement distribution: $18,156 (reported on 3.0% of returns)
92507:
$18,156
California:
$23,505
(% of AGI for various income ranges: 13.4% for AGIs below $25k, 18.7% for AGIs $25k-50k, 55.8% for AGIs $50k-75k, 176.9% for AGIs $75k-100k, 409.3% for AGIs $100k-200k, 1779.4% for AGIs over 200k)
Self-employed (Keogh) retirement plans: $29,067 (reported on 0.1% of returns)
92507:
$29,067
California:
$30,163
(% of AGI for various income ranges: 67.1% for AGIs $100k-200k)
Total itemized deductions: $29,531 (reported on 9.1% of returns)
Here:
$29,531
State:
$39,517
(% of AGI for various income ranges: 28.6% for AGIs below $25k, 95.8% for AGIs $25k-50k, 408.3% for AGIs $50k-75k, 931.9% for AGIs $75k-100k, 2114.5% for AGIs $100k-200k, 7510.6% for AGIs over 200k)
Charity contributions: $7,527 (reported on 7.6% of returns)
Here:
$7,527
State:
$12,598
(% of AGI for various income ranges: 2.1% for AGIs below $25k, 15.0% for AGIs $25k-50k, 52.9% for AGIs $50k-75k, 171.2% for AGIs $75k-100k, 419.8% for AGIs $100k-200k, 2768.3% for AGIs over 200k)
Taxes paid: $8,148 (reported on 9.1% of returns)
92507:
$8,148
State:
$8,807
(% of AGI for various income ranges: 5.0% for AGIs below $25k, 21.7% for AGIs $25k-50k, 106.5% for AGIs $50k-75k, 294.9% for AGIs $75k-100k, 644.8% for AGIs $100k-200k, 1691.1% for AGIs over 200k)
Earned income credit: $2,213 (reported on 20.3% of returns)
Here:
$2,213
State:
$2,074
(% of AGI for various income ranges: 100.3% for AGIs below $25k, 73.2% for AGIs $25k-50k, 1.4% for AGIs $50k-75k)
Percentage of individuals using paid preparers for their 2020 taxes: 93.1%
Here:
93%
State:
92%
(% for various income ranges: 92.5% for AGIs below $25k, 93.8% for AGIs $25k-50k, 92.9% for AGIs $50k-75k, 93.0% for AGIs $75k-100k, 93.5% for AGIs $100k-200k, 93.1% for AGIs over 200k)
Averages for the 2012 tax year for zip code 92507, filed in 2013:
Average Adjusted Gross Income (AGI) in 2012: $39,997 (Individual Income Tax Returns)
Here:
$39,997
State:
$72,726
Salary/wage: $35,432 (reported on 86.6% of returns)
Here:
$35,432
State:
$59,079
(% of AGI for various income ranges: 81.0% for AGIs below $25k, 87.5% for AGIs $25k-50k, 80.7% for AGIs $50k-75k, 77.2% for AGIs $75k-100k, 74.2% for AGIs $100k-200k, 45.6% for AGIs over 200k)
Taxable interest for individuals: $678 (reported on 22.5% of returns)
This zip code:
$678
California:
$2,146
(% of AGI for various income ranges: 0.3% for AGIs below $25k, 0.3% for AGIs $25k-50k, 0.3% for AGIs $50k-75k, 0.2% for AGIs $75k-100k, 0.3% for AGIs $100k-200k, 1.1% for AGIs over 200k)
Ordinary dividends: $4,353 (reported on 7.9% of returns)
Here:
$4,353
State:
$9,308
(% of AGI for various income ranges: 0.3% for AGIs below $25k, 0.3% for AGIs $25k-50k, 0.5% for AGIs $50k-75k, 0.7% for AGIs $75k-100k, 1.1% for AGIs $100k-200k, 3.1% for AGIs over 200k)
Net capital gain/loss in AGI: +$5,144 (reported on 6.6% of returns)
Here:
+$5,144
State:
+$30,460
(% of AGI for various income ranges: 0.3% for AGIs $75k-100k, 1.1% for AGIs $100k-200k, 5.3% for AGIs over 200k)
Profit/loss from business: +$9,823 (reported on 14.0% of returns)
Here:
+$9,823
State:
+$17,064
(% of AGI for various income ranges: 8.9% for AGIs below $25k, 2.0% for AGIs $25k-50k, 2.3% for AGIs $50k-75k, 1.6% for AGIs $75k-100k, 2.2% for AGIs $100k-200k, 4.2% for AGIs over 200k)
Taxable individual retirement arrangement distribution: $13,640 (reported on 4.2% of returns)
92507:
$13,640
California:
$19,557
(% of AGI for various income ranges: 0.8% for AGIs below $25k, 1.0% for AGIs $25k-50k, 1.6% for AGIs $50k-75k, 1.8% for AGIs $75k-100k, 2.2% for AGIs $100k-200k, 1.4% for AGIs over 200k)
Self-employment retirement plans: $21,675 (reported on 0.2% of returns)
92507:
$21,675
California:
$24,530
Total itemized deductions: $22,799 (26% of AGI, reported on 22.2% of returns)
Here:
$22,799
State:
$34,004
Here:
25.7% of AGI
State:
22.7% of AGI
(% of AGI for various income ranges: 5.5% for AGIs below $25k, 8.2% for AGIs $25k-50k, 14.1% for AGIs $50k-75k, 16.3% for AGIs $75k-100k, 18.5% for AGIs $100k-200k, 16.3% for AGIs over 200k)
Charity contributions: $3,590 (reported on 18.3% of returns)
Here:
$3,590
State:
$4,659
(% of AGI for various income ranges: 0.4% for AGIs below $25k, 0.9% for AGIs $25k-50k, 1.7% for AGIs $50k-75k, 2.3% for AGIs $75k-100k, 2.6% for AGIs $100k-200k, 2.5% for AGIs over 200k)
Taxes paid: $7,132 (reported on 22.1% of returns)
92507:
$7,132
State:
$14,448
(% of AGI for various income ranges: 0.9% for AGIs below $25k, 1.5% for AGIs $25k-50k, 3.3% for AGIs $50k-75k, 5.0% for AGIs $75k-100k, 6.6% for AGIs $100k-200k, 8.7% for AGIs over 200k)
Earned income credit: $2,541 (reported on 28.7% of returns)
Here:
$2,541
State:
$2,286
(% of AGI for various income ranges: 8.6% for AGIs below $25k, 1.7% for AGIs $25k-50k)
Percentage of individuals using paid preparers for their 2012 taxes: 63.3%
Here:
63%
State:
64%
(% for various income ranges: 62.9% for AGIs below $25k, 62.3% for AGIs $25k-50k, 63.9% for AGIs $50k-75k, 65.0% for AGIs $75k-100k, 64.9% for AGIs $100k-200k, 76.2% for AGIs over 200k)
Averages for the 2004 tax year for zip code 92507, filed in 2005:
Average Adjusted Gross Income (AGI) in 2004: $35,968 (Individual Income Tax Returns)
Here:
$35,968
State:
$58,600
Salary/wage: $32,811 (reported on 88.3% of returns)
Here:
$32,811
State:
$49,455
(% of AGI for various income ranges: 146.0% for AGIs below $10k, 86.5% for AGIs $10k-25k, 89.2% for AGIs $25k-50k, 83.2% for AGIs $50k-75k, 79.5% for AGIs $75k-100k, 62.3% for AGIs over 100k)
Taxable interest for individuals: $1,008 (reported on 30.7% of returns)
This zip code:
$1,008
California:
$2,365
(% of AGI for various income ranges: 2.4% for AGIs below $10k, 0.7% for AGIs $10k-25k, 0.5% for AGIs $25k-50k, 0.7% for AGIs $50k-75k, 0.9% for AGIs $75k-100k, 1.3% for AGIs over 100k)
Taxable dividends: $2,362 (reported on 10.8% of returns)
Here:
$2,362
State:
$4,746
(% of AGI for various income ranges: 1.5% for AGIs below $10k, 0.4% for AGIs $10k-25k, 0.4% for AGIs $25k-50k, 0.7% for AGIs $50k-75k, 0.6% for AGIs $75k-100k, 1.2% for AGIs over 100k)
Net capital gain/loss: +$16,429 (reported on 9.0% of returns)
Here:
+$16,429
State:
+$23,418
(% of AGI for various income ranges: -1.0% for AGIs below $10k, 0.1% for AGIs $10k-25k, 0.2% for AGIs $25k-50k, 0.8% for AGIs $50k-75k, 1.7% for AGIs $75k-100k, 14.5% for AGIs over 100k)
Profit/loss from business: +$8,923 (reported on 11.7% of returns)
Here:
+$8,923
State:
+$16,826
(% of AGI for various income ranges: 11.7% for AGIs below $10k, 5.0% for AGIs $10k-25k, 1.9% for AGIs $25k-50k, 2.1% for AGIs $50k-75k, 2.0% for AGIs $75k-100k, 3.1% for AGIs over 100k)
Profit/loss from farming: +$7,167 (reported on 0.1% of returns)
Here:
+$7,167
State:
-$7,562
IRA payment deduction: $2,742 (reported on 1.4% of returns)
92507:
$2,742
California:
$3,192
(% of AGI for various income ranges: 0.3% for AGIs below $10k, 0.1% for AGIs $10k-25k, 0.1% for AGIs $25k-50k, 0.1% for AGIs $50k-75k, 0.2% for AGIs $75k-100k, 0.1% for AGIs over 100k)
Self-employed pension: $12,630 (reported on 0.3% of returns)
Here:
$12,630
California:
$17,688
Total itemized deductions: $19,329 (28% of AGI, reported on 29.2% of returns)
Here:
$19,329
State:
$28,113
Here:
27.8% of AGI
State:
25.3% of AGI
(% of AGI for various income ranges: 10.9% for AGIs below $10k, 7.0% for AGIs $10k-25k, 15.3% for AGIs $25k-50k, 18.2% for AGIs $50k-75k, 20.7% for AGIs $75k-100k, 17.1% for AGIs over 100k)
Charity contributions deductions: $2,867 (4% of AGI, reported on 24.2% of returns)
Here:
$2,867
State:
$3,923
Here:
3.8% of AGI
State:
3.3% of AGI
(% of AGI for various income ranges: 0.4% for AGIs below $10k, 0.6% for AGIs $10k-25k, 1.5% for AGIs $25k-50k, 2.4% for AGIs $50k-75k, 2.9% for AGIs $75k-100k, 2.5% for AGIs over 100k)
Total tax: $5,168 (reported on 65.3% of returns)
92507:
$5,168
State:
$10,761
(% of AGI for various income ranges: 4.1% for AGIs below $10k, 3.5% for AGIs $10k-25k, 5.8% for AGIs $25k-50k, 8.9% for AGIs $50k-75k, 10.3% for AGIs $75k-100k, 16.7% for AGIs over 100k)
Earned income credit: $1,874 (reported on 22.6% of returns)
Here:
$1,874
State:
$1,763
Percentage of individuals using paid preparers for their 2004 taxes: 63.7%
Here:
64%
State:
66%
(% for various income ranges: 53.5% for AGIs below $10k, 65.6% for AGIs $10k-25k, 65.8% for AGIs $25k-50k, 66.6% for AGIs $50k-75k, 67.2% for AGIs $75k-100k, 71.1% for AGIs over 100k)
Likely homosexual households (counted as self-reported same-sex unmarried-partner households)
Lesbian couples: 0.2% of all households
Gay men: 0.1% of all households
Household received Food Stamps/SNAP in the past 12 months: 2,650 Household did not receive Food Stamps/SNAP in the past 12 months: 15,299
Women who had a birth in the past 12 months: 708 (296 now married, 416 unmarried) Women who did not have a birth in the past 12 months: 19,263 (4,835 now married, 14,544 unmarried)
Housing units in zip code 92507 with a mortgage: 4,401 (368 second mortgage, 28 home equity loan, 285 both second mortgage and home equity loan) Houses without a mortgage: 126
Median monthly owner costs for units with a mortgage: $2,156 Median monthly owner costs for units without a mortgage: $613
Residents with income below the poverty level in 2022:
This zip code:
19.5%
Whole state:
12.2%
Residents with income below 50% of the poverty level in 2022:
This zip code:
9.0%
Whole state:
6.2%
Median number of rooms in houses and condos:
Here:
6.0
State:
6.0
Median number of rooms in apartments:
Here:
3.6
State:
3.9
Notable locations in this zip code not listed on our city pages
Notable locations in zip code 92507: Lily Cup (A), Box Springs (B), Victoria Golf Course (C), Canyon Crest Golf Course (D), American Medical Response Riverside (E), American Medical Response Downtown Riverside (F), University of California Riverside Fire Safety (G), Webber Hall (H), Tomas Rivera Library (I), Spieth Hall (J), Rupert Costo Library of the American Indian (K), Fawcett Laboratory (L), Boyden Laboratories (M), Boyce Hall (N), Batchelor Hall (O), Watkins House (P), Watkins Hall (Q), Veitch Student Center (R), Sproul Hall (S), Pierce Hall (T). Display/hide their locations on the map
Shopping Centers: University Shopping Center (1), University Center Shopping Center (2), Town Square Shopping Center (3), University Village Shopping Center (4). Display/hide their locations on the map
Churches in zip code 92507 include: Yeshua Ministry (A), Vietnamese United Methodist Church (B), Victory Worship Center (C), Unity Fellowship Church of Riverside (D), The Living Word Baptist Church (E), Set Free Christian Fellowship Church (F), Saint Andrews Orthodox Christian Church (G), Riverside Faith Temple Ministries International (H), River of Life Christian Center (I). Display/hide their locations on the map
Parks in zip code 92507 include: Bordwell Park (1), Hunter Park (2), Lincoln Park (3), North Park (4), Patterson Park (5), Islander Park (6), Mount Vernon Park (7), Quail Run Park (8), Sycamore Canyon Park (9). Display/hide their locations on the map
5,296 married couples with children.
3,626 single-parent households (847 men, 2,779 women).
50.5% of residents of 92507 zip code speak English at home.
36.9% of residents speak Spanish at home (66% very well, 13% well, 12% not well, 9% not at all).
3.4% of residents speak other Indo-European language at home (69% very well, 24% well, 4% not well, 2% not at all).
8.1% of residents speak Asian or Pacific Island language at home (67% very well, 27% well, 6% not well).
0.6% of residents speak other language at home (73% very well, 16% well, 12% not well).
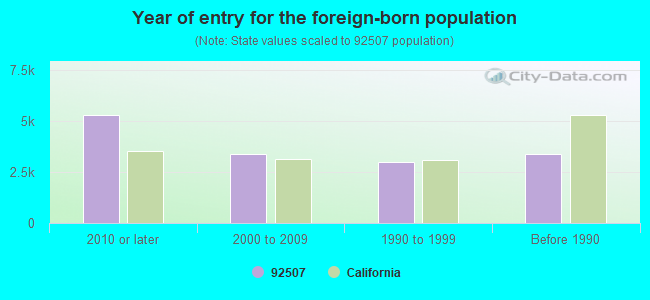
Foreign born population: 13,536 (22.4%) (38.0% of them are naturalized citizens)
Major facilities with environmental interests located in this zip code:
NEWBASIS INCORPORATED (2626 KANSAS AVENUE in RIVERSIDE, CA)
AIR MAJOR (AIRS/AFS) STATE MASTER (California - Hazardous Waste Tracking) - HAZARDOU WASTE PROGRAM (Integrated Compliance Information System) - ICIS-09-1999-0024, FORMAL ENFORCEMENT ACTION COMPLIANCE ACTIVITY (Tracking inspections of insecticide, fungicide, and rodenticide, and toxic substances) CRITERIA AND HAZARDOUS AIR POLLUTANT INVENTORY (Inventory of air pollution sources) Small Quantity Generators, between 100 kg and 1000 kg of hazardous waste/month (Resource Conservation and Recovery Act (tracking hazardous waste)) - notification TRI REPORTER (Tracking of toxic chemicals releasing facilities) Business SIC classification: CUSTOM COMPOUNDING OF PURCHASED PLASTICS RESINS; PLASTICS PRODUCTS Business NAICS classification: ALL OTHER PLASTICS PRODUCT MANUFACTURING. Organizations: ASSOCIATED PLASTICS (CONTACT/OWNER)
Alternative names: ASSOCIATED PLASTICS, NEW BASIS
METROPOLITAN WATER DIST OF STHRN CAL (550 E ALESSANDRO BLVD in RIVERSIDE, CA) . Federal Facility
STATE MASTER (California - Hazardous Waste Tracking) - HAZARDOU WASTE PROGRAM HAZARDOUS WASTE BIENNIAL REPORTER (Resource Conservation and Recovery Act (tracking hazardous waste)) Large Quantity Generators, more that 1000 kg of hazardous waste/month (Resource Conservation and Recovery Act (tracking hazardous waste)) Small Quantity Generators, between 100 kg and 1000 kg of hazardous waste/month (Resource Conservation and Recovery Act (tracking hazardous waste)) - notification Organizations: DAVID JOHNSON (CONTACT/OPERATOR)
, WESTERN MUNICIPAL WATER DIST (CONTACT/OWNER)
, METROPOLITAN WATER DIST. OF SO. CALIF. (CONTACT/OWNER)
Alternative names: HENRY J MILLS FILTRATION PLANT, MILLS FILTRATION PLANT, WESTERN MUNICIPAL WATER DIST
GAR LABS (1844 MASSACHUSETTS AVE in RIVERSIDE, CA)
(Integrated Compliance Information System) - ICIS-09-2002-0127, FORMAL ENFORCEMENT ACTION (Integrated Compliance Information System) - ICIS-09-2000-0413, FORMAL ENFORCEMENT ACTION COMPLIANCE ACTIVITY (Tracking inspections of insecticide, fungicide, and rodenticide, and toxic substances) Business SIC classification: INDUSTRIAL INORGANIC CHEMICALS; INDUSTRIAL ORGANIC CHEMICALS; FARM SUPPLIES
LUXFER INCORPORATED (1995 3RD STREET in RIVERSIDE, CA)
STATE MASTER (California - Hazardous Waste Tracking) - HAZARDOU WASTE PROGRAM CRITERIA AND HAZARDOUS AIR POLLUTANT INVENTORY (Inventory of air pollution sources) HAZARDOUS WASTE BIENNIAL REPORTER (Resource Conservation and Recovery Act (tracking hazardous waste)) Large Quantity Generators, more that 1000 kg of hazardous waste/month (Resource Conservation and Recovery Act (tracking hazardous waste)) TRI REPORTER (Tracking of toxic chemicals releasing facilities) Business SIC classification: ALUMINUM EXTRUDED PRODUCTS Business NAICS classification: ALUMINUM EXTRUDED PRODUCT MANUFACTURING.; PLATE WORK MANUFACTURING. Organizations: LUXFER GAS CYLINDERS (CONTACT/OPERATOR)
, LUXFER INC. (CONTACT/OWNER)
Alternative names: LUXFER GAS CYLINDERS, LUXFER USA LTD
220 LABORATORIES (2375 3RD ST in RIVERSIDE, CA)
STATE MASTER (California - Hazardous Waste Tracking) - HAZARDOU WASTE PROGRAM HAZARDOUS WASTE BIENNIAL REPORTER (Resource Conservation and Recovery Act (tracking hazardous waste)) Large Quantity Generators, more that 1000 kg of hazardous waste/month (Resource Conservation and Recovery Act (tracking hazardous waste)) TRI REPORTER (Tracking of toxic chemicals releasing facilities) Business SIC classification: PERFUMES, COSMETICS, AND OTHER TOILET PREPARATIONS Organizations: 220 LABORATORIES, INC. (CONTACT/OPERATOR)
, MR. YORAM FISHMAN (CONTACT/OWNER)
CALTRANS (1091 EVERTON PLACE in RIVERSIDE, CA)
STATE MASTER (California - Hazardous Waste Tracking) - HAZARDOU WASTE PROGRAM (Resource Conservation and Recovery Act (tracking hazardous waste)) Small Quantity Generators, between 100 kg and 1000 kg of hazardous waste/month (Resource Conservation and Recovery Act (tracking hazardous waste)) Organizations: CALIFORNIA DEPT OF TRANSPORTATION (CONTACT/OWNER)
Alternative names: CALTRANS DISTRICT 8, CALTRANS DISTRICT 8 RIVERSIDE
MODULAR STRUCTURES INT'L INC (920 CITRUS AV in RIVERSIDE, CA)
STATE MASTER (California - Hazardous Waste Tracking) - HAZARDOU WASTE PROGRAM CRITERIA AND HAZARDOUS AIR POLLUTANT INVENTORY (Inventory of air pollution sources) Large Quantity Generators, more that 1000 kg of hazardous waste/month (Resource Conservation and Recovery Act (tracking hazardous waste)) Business SIC classification: PREFABRICATED WOOD BUILDINGS AND COMPONENTS Business NAICS classification: PREFABRICATED WOOD BUILDING MANUFACTURING. Organizations: MODULAR STRUCTURES INTERNATIONAL (CONTACT/OPERATOR)
ICI PAINTS DEVOE COATINGS COMPANY (2625 DURAHART STREET in RIVERSIDE, CA)
SUPERFUND (Superfund database) COMPLIANCE ACTIVITY (Tracking inspections of insecticide, fungicide, and rodenticide, and toxic substances) CRITERIA AND HAZARDOUS AIR POLLUTANT INVENTORY (Inventory of air pollution sources) HAZARDOUS WASTE BIENNIAL REPORTER (Resource Conservation and Recovery Act (tracking hazardous waste)) Large Quantity Generators, more that 1000 kg of hazardous waste/month (Resource Conservation and Recovery Act (tracking hazardous waste)) - notification TRI REPORTER (Tracking of toxic chemicals releasing facilities) Business SIC classification: PAINTS, VARNISHES, LACQUERS, ENAMELS, AND ALLIED PRODUCTS Organizations: GLIDDEN CO (CONTACT/OWNER)
Alternative names: DEVOE MARINE COATING CO
EVEREADY PACIFIC (1499 PALMYRITA in RIVERSIDE, CA)
STATE MASTER (California - Hazardous Waste Tracking) - HAZARDOU WASTE PROGRAM Large Quantity Generators, more that 1000 kg of hazardous waste/month (Resource Conservation and Recovery Act (tracking hazardous waste)) - notification Organizations: JOHNSON MACHINERY (CONTACT/OWNER)
CADDOCK ELECTRONICS INCORPORATED (1717 CHICAGO AVE. in RIVERSIDE, CA)
STATE MASTER (California - Hazardous Waste Tracking) - HAZARDOU WASTE PROGRAM COMPLIANCE ACTIVITY (Tracking inspections of insecticide, fungicide, and rodenticide, and toxic substances) Small Quantity Generators, between 100 kg and 1000 kg of hazardous waste/month (Resource Conservation and Recovery Act (tracking hazardous waste)) TRI REPORTER (Tracking of toxic chemicals releasing facilities) Business SIC classification: ELECTRONIC RESISTORS Business NAICS classification: ELECTRONIC RESISTOR MANUFACTURING.
FMC TECHNOLOGIES INC (4430 COMMERCE STREET in RIVERSIDE, CA)
STATE MASTER (California - Hazardous Waste Tracking) - HAZARDOU WASTE PROGRAM Small Quantity Generators, between 100 kg and 1000 kg of hazardous waste/month (Resource Conservation and Recovery Act (tracking hazardous waste)) - notification TRI REPORTER (Tracking of toxic chemicals releasing facilities) Business SIC classification: CHEMICALS AND CHEMICAL PREPARATIONS Organizations: RICHARD L HOUTZER (CONTACT/OWNER)
Alternative names: F M C TECHNOLOGIES INC, FMC CORP., FMC CORP CITRUS MACHINERY DIV
FMC TECHNOLOGIES INC (1540 LINDEN STREET in RIVERSIDE, CA)
STATE MASTER (California - Hazardous Waste Tracking) - HAZARDOU WASTE PROGRAM Small Quantity Generators, between 100 kg and 1000 kg of hazardous waste/month (Resource Conservation and Recovery Act (tracking hazardous waste)) - notification Organizations: RICHARD L HOUTZER (CONTACT/OWNER)
Alternative names: F M C TECHNOLOGIES INC, FMC CORPORATION CITRUS MACH
EARTHWISE SERVICES LLC (20331 STANFORD AVE in RIVERSIDE, CA)
STATE MASTER (California - Hazardous Waste Tracking) - HAZARDOU WASTE PROGRAM TRANSPORTER (Resource Conservation and Recovery Act (tracking hazardous waste)) Business NAICS classification: HAZARDOUS WASTE COLLECTION.
Housing units lacking complete plumbing facilities: 0.7% Housing units lacking complete kitchen facilities: 3.3%
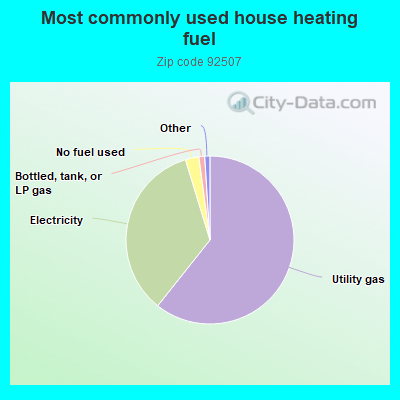
60.7%Utility gas
34.6%Electricity
2.6%No fuel used
1.1%Bottled, tank, or LP gas
Population in 1990: 45,844. Population change in the 1990s: +2,801 (+6.1%).
Place of birth for U.S.-born residents:
This state: 38,974
Northeast: 1,178
Midwest: 1,847
South: 2,241
West: 1,649
40% of the 92507 zip code residents lived in the same house 5 years ago. Out of people who lived in different houses, 56% lived in this county. Out of people who lived in different counties, 50% lived in California.
83% of the 92507 zip code residents lived in the same house 1 year ago. Out of people who lived in different houses, 40% moved from this county. Out of people who lived in different houses, 38% moved from different county within same state. Out of people who lived in different houses, 13% moved from different state. Out of people who lived in different houses, 10% moved from abroad.
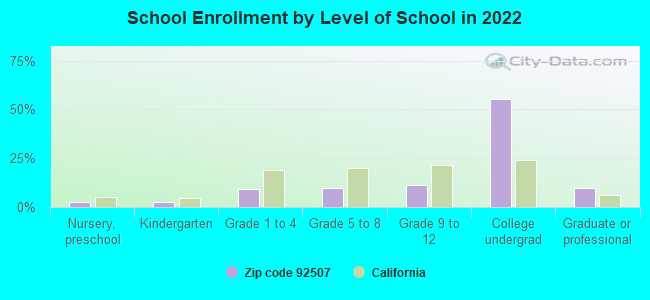
Private vs. public school enrollment:
Students in private schools in grades 1 to 8 (elementary and middle school): 270
Here:
6.1%
California:
10.5%
Students in private schools in grades 9 to 12 (high school): 112
Here:
4.1%
California:
8.5%
Students in private undergraduate colleges: 1,805
Here:
13.8%
California:
15.9%
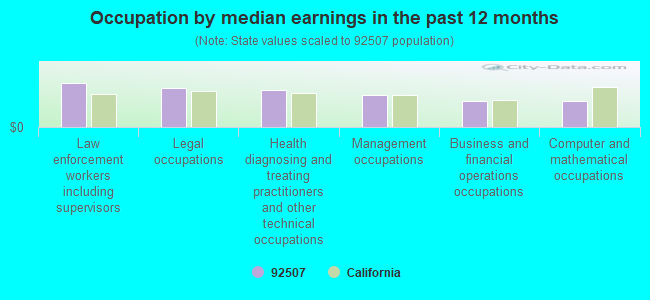
Occupation by median earnings in the past 12 months ($)
104,666Law enforcement workers including supervisors
93,430Legal occupations
87,525Health diagnosing and treating practitioners and other technical occupations
75,155Management occupations
61,760Business and financial operations occupations
61,115Computer and mathematical occupations
Companies with biggest federal contracts located in this zip code (RIVERSIDE, CA):
STRONGHOLD ENGINEERING, INC (3421 GATO COURT) : $323,640,720 in 838 contractsfrom 1999 to 2006
Contracts for Maintenance, Repair or Alteration of Real Property -- Office Buildings, Construction of Structures and Facilities -- Other Utilities, Construction of Structures and Facilities -- Family Housing Facilities, Maintenance, Repair or Alteration of Real Property -- Other Utilities, and moreby Public Buildings Service, Army, Navy, Department of State, and others Signed by year:2000: $26,034,362; 2001: $38,425,077; 2002: $54,767,364; 2003: $56,722,301; 2004: $80,569,486; 2005: $42,940,283; 2006: $21,727,103.
Biggest contracts:
$16,347,100 with Public Buildings Service for Maintenance, Repair or Alteration of Real Property -- Office Buildings. Signed on 2006-02-28. Effective on 2006-03-22. Completion date: 2007-05-22.
$6,971,127 with Army for Construction of Structures and Facilities -- Other Utilities. Taking place in HI. Signed on 2003-09-08. Completion date: 2004-07-31.
$6,581,250 with Army for Construction of Structures and Facilities -- Family Housing Facilities. Taking place in AZ. Signed on 2003-09-30. Completion date: 2004-09-30.
$6,387,100 with Navy for Maintenance, Repair or Alteration of Real Property -- Other Utilities. Signed on 2002-09-19. Completion date: 2004-09-21.
PHOENIX CONSTRUCTION SERVICES (2305 CHICAGO AVE; small business) : $15,008,129 in 226 contractsfrom 2001 to 2006
Contracts for Maintenance, Repair or Alteration of Real Property -- Other Non-Building Facilities, Maintenance, Repair and Rebuilding of Equipment -- Railway Equipment, Maintenance, Repair or Alteration of Real Property -- Miscellaneous Buildings, Maintenance, Repair or Alteration of Real Property -- Office Buildings, and moreby Navy, NASA, Air Force, Army, and others Signed by year:2000: $0; 2001: $579,884; 2002: $1,576,097; 2003: $3,813,723; 2004: $3,901,062; 2005: $4,791,756; 2006: $345,607.
Biggest contracts:
$1,867,330 with Navy for Maintenance, Repair or Alteration of Real Property -- Other Non-Building Facilities. Signed on 2005-04-06. Completion date: 2006-05-05.
$487,000 with NASA for Maintenance, Repair and Rebuilding of Equipment -- Railway Equipment. Taking place in FL. Signed on 2001-12-15. Completion date: 2003-12-15.
$480,000, same as above.Signed on 2003-12-15. Completion date: 2005-12-31.
$461,000, same as above.Signed on 2005-10-28. Effective on 2006-01-01. Completion date: 2006-12-31.
ROGAN BUILDING SERVICES,INC (1521 SEVENTH ST; small business) : $7,569,634 in 56 contractsfrom 1999 to 2004
Contracts for Custodial Janitorial Services by Public Buildings Service, Air Force, Navy, Department of Defense, and others Signed by year:2000: $3,120,205; 2001: $1,259,346; 2002: $1,892,253; 2003: $642,024; 2004: $221,776; 2005: $0; 2006: $0.
Biggest contracts:
$760,000 with Public Buildings Service for Custodial Janitorial Services. Signed on 2000-01-15. Completion date: 2000-12-15.
$635,110 with Air Force for Custodial Janitorial Services. Signed on 2002-09-27. Completion date: 2002-12-31.
$635,110, same as above.Signed on 2001-12-03. Completion date: 2002-12-31.
$634,179, same as above.Signed on 2002-12-02. Completion date: 2003-12-31.
FEDERAL EDGE INC (1735 SPRUCE ST STE A; small business) : $4,822,248 in 108 contractsfrom 2001 to 2006
Contracts for ADP Central Processing Unit (CPU, Computer), Analog, ADP Input/Output and Storage Devices, ADP Software, Equipment, and Telecommunications Training, ADP Software, and moreby Air Force, Army, Federal Technology Service, Navy, and others Signed by year:2000: $0; 2001: $238,000; 2002: $822,463; 2003: $789,310; 2004: $1,627,770; 2005: $939,672; 2006: $405,033.
Biggest contracts:
$345,249 with Air Force for ADP Central Processing Unit (CPU, Computer), Analog. Signed on 2005-09-02. Completion date: 2005-09-23.
$246,866, same as above.Signed on 2004-07-13. Completion date: 2004-08-16.
$225,389 with Air Force for ADP Input/Output and Storage Devices. Signed on 2002-04-05. Completion date: 2002-04-12.
$195,259 with Army for ADP Input/Output and Storage Devices. Signed on 2004-08-03. Completion date: 2004-09-02.
RECON/OPTICAL INC (DEL) (1190 COLUMBIA AVE) : $2,938,315 in 33 contractsfrom 1999 to 2005
Contracts for Optical Sighting and Ranging Equipment, Optical Instruments, Test Equipment, Components and Accessories, Aircraft Gunnery Fire Control Components, Maintenance, Repair and Rebuilding of Equipment -- Fire Control Equipment, and moreby Air Force, Defense Logistics Agency Signed by year:2000: $490,358; 2001: $831,355; 2002: $417,508; 2003: $72,250; 2004: $621,746; 2005: $479,313; 2006: $0.
Biggest contracts:
$285,355 with Air Force for Optical Sighting and Ranging Equipment. Signed on 2001-01-22. Completion date: 2001-12-31.
$231,885 with Defense Logistics Agency for Optical Sighting and Ranging Equipment. Signed on 2002-09-26. Completion date: 2003-06-23.
$220,192 with Air Force for Optical Sighting and Ranging Equipment. Signed on 2000-03-01. Completion date: 2000-12-31.
$214,758 with Defense Logistics Agency for Optical Instruments, Test Equipment, Components and Accessories. Signed on 2000-06-30. Completion date: 2001-05-20.
SHUTTLE BUS LEASING (1863 SERVICE COURT; small business) : $2,420,108 in 23 contractsfrom 2003 to 2006
Contracts for Lease or Rental of Equipment -- Ground Effect Vehicles, Motor Vehicles, Trailers, and Cycles, Passenger Motor Charter Service by Army, Air Force, Navy Signed by year:2000: $0; 2001: $0; 2002: $0; 2003: $30,000; 2004: $1,468,200; 2005: $268,789; 2006: $653,119.
Biggest contracts:
$845,800 with Army for Lease or Rental of Equipment -- Ground Effect Vehicles, Motor Vehicles, Trailers, and Cycles. Taking place in WI. Signed on 2004-11-19. Completion date: 2004-09-21.
$576,000, same as above.Signed on 2006-01-18. Completion date: 2006-10-21.
$460,800, same as above.Signed on 2004-03-10. Completion date: 2004-09-21.
$76,800, same as above.Signed on 2004-10-07. Completion date: 2004-09-21.
ISCA TECHNOLOGIES, INC (2060 CHICAGO AVE SUITE C2; small business) : $2,225,338 in 13 contractsfrom 2002 to 2006
Contracts for Other Medical -- Basic Research (R&D), Other Medical -- Operational Systems Development (R&D), Other Professional Services, Chemicals by Army, Animal and Plant Health Inspection Service Signed by year:2000: $0; 2001: $0; 2002: $70,000; 2003: $505,011; 2004: $775,442; 2005: $374,885; 2006: $500,000.
Biggest contracts:
$500,000 with Army for Other Medical -- Basic Research (R&D). Signed on 2006-02-09. Completion date: 2004-07-11.
$385,011 with Army for Other Medical -- Operational Systems Development (R&D). Signed on 2003-10-31. Completion date: 2006-02-24.
$365,115 with Army for Other Medical -- Basic Research (R&D). Signed on 2004-09-10. Completion date: 2004-07-11.
$364,885, same as above.Signed on 2005-12-08. Completion date: 2004-07-11.
BOTTLING GROUP LLC (6659 SYCAMORE CANYON BLVD) : $2,072,706 in 14 contractsfrom 1999 to 2001
Contracts for Food Items For Resale by Department of Defense Signed by year:2000: $907,103; 2001: $914,155; 2002: $0; 2003: $0; 2004: $0; 2005: $0; 2006: $0.
Biggest contracts:
$377,948 with Department of Defense for Food Items For Resale. Signed on 2001-09-26. Completion date: 2000-04-30.
$349,139, same as above.Signed on 2000-10-01. Completion date: 2000-07-31.
$306,604, same as above.Signed on 2001-09-25. Completion date: 2001-09-21.
$229,603, same as above.Signed on 2001-07-01. Completion date: 2001-09-30.
COMSERCO (2020 IOWA AVENUE, SUITE 10) : $1,264,996 in 13 contractsfrom 2000 to 2005
Contracts for Maintenance, Repair and Rebuilding of Equipment -- Communication, Detection, and Coherent Radiation Equipment, Maintenance, Repair and Rebuilding of Equipment -- Electrical and Electronic Equipment Components, Radio and Television Communication Equipment, Except Airborne, ADP Support Equipment by Air Force, Federal Technology Service Signed by year:2000: $438,478; 2001: $0; 2002: $107,860; 2003: $261,574; 2004: $228,292; 2005: $228,792; 2006: $0.
Biggest contracts:
$228,792 with Air Force for Maintenance, Repair and Rebuilding of Equipment -- Communication, Detection, and Coherent Radiation Equipment. Signed on 2005-10-12. Completion date: 2006-09-30.
$228,792 with Air Force for Maintenance, Repair and Rebuilding of Equipment -- Electrical and Electronic Equipment Components. Signed on 2004-10-01. Completion date: 2005-09-30.
$228,792 with Air Force for Radio and Television Communication Equipment, Except Airborne. Signed on 2003-11-17. Completion date: 2004-09-30.
$222,606 with Air Force for Maintenance, Repair and Rebuilding of Equipment -- Communication, Detection, and Coherent Radiation Equipment. Signed on 2000-11-29. Completion date: 2001-09-30.
EDWARD S BABCOCK & SONS, INC (6100 QUAIL VALLEY COURT; small business) : $1,209,880 in 322 contractsfrom 2000 to 2005
Contracts for Maintenance, Repair or Alteration of Real Property -- Sewage and Waste Facilities, Water Quality Support Services, Other Housekeeping Services by Navy Signed by year:2000: $82,383; 2001: $188,290; 2002: $155,919; 2003: $133,704; 2004: $524,621; 2005: $124,963; 2006: $0.
Biggest contracts:
$410,530 with Navy for Maintenance, Repair or Alteration of Real Property -- Sewage and Waste Facilities. Signed on 2004-06-03. Completion date: 2005-05-31.
$113,901 with Navy for Water Quality Support Services. Signed on 2005-06-30. Completion date: 2006-06-30.
$107,411, same as above.Signed on 2004-06-15. Completion date: 2005-06-30.
$82,383, same as above.Signed on 2001-06-15. Completion date: 2002-07-01.
Top industries in this zip code by the number of employees in 2005:
Administrative and Support and Waste Management and Remediation Services: Temporary Help Services (500-999 employees: 2 establishments, 250-499 employees: 1 establishment, 100-249 employees: 2 establishments, 50-99 employees: 4 establishments, 20-49 employees: 2 establishments, 10-19 employees: 1 establishment)
Administrative and Support and Waste Management and Remediation Services: Security Systems Services (except Locksmiths) (100-249: 2, 50-99: 1, 20-49: 3, 5-9: 1)
People in group quarters in 2010:
5,980 people in college/university student housing
144 people in emergency and transitional shelters (with sleeping facilities) for people experiencing homelessness
65 people in other noninstitutional facilities
51 people in group homes intended for adults
25 people in residential treatment centers for adults
3 people in group homes for juveniles (non-correctional)
People in group quarters in 2000:
1,855 people in college dormitories (includes college quarters off campus)
170 people in other noninstitutional group quarters
131 people in nursing homes
82 people in other group homes
60 people in homes for the mentally retarded
58 people in homes for the mentally ill
4 people in religious group quarters
Fatal accident statistics in 2014:
Fatal accident count: 8
Vehicles involved in fatal accidents: 16
Fatal accidents caused by drunken drivers: 2
Fatalities: 8
Persons involved in fatal accidents: 24
Pedestrians involved in fatal accidents: 0
Fatal accident statistics in 2013:
Fatal accident count: 9
Vehicles involved in fatal accidents: 20
Fatal accidents caused by drunken drivers: 4
Fatalities: 10
Persons involved in fatal accidents: 33
Pedestrians involved in fatal accidents: 1
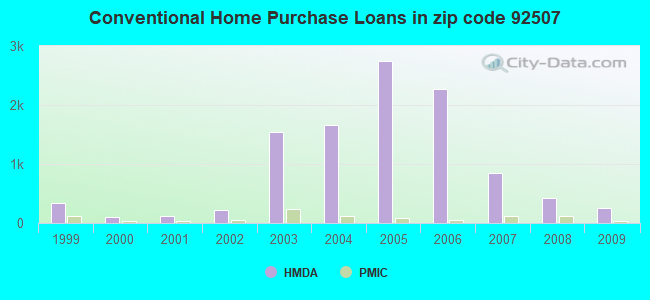
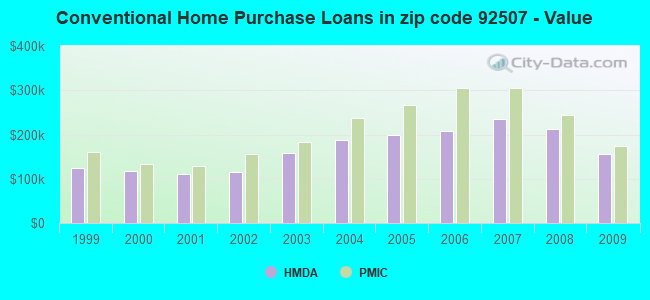
Home Mortgage Disclosure Act Aggregated Statistics For Year 2009 (Based on 14 full and 12 partial tracts)
A) FHA, FSA/RHS & VA Home Purchase Loans
B) Conventional Home Purchase Loans
C) Refinancings
D) Home Improvement Loans
E) Loans on Dwellings For 5+ Families
F) Non-occupant Loans on < 5 Family Dwellings (A B C & D)
G) Loans On Manufactured Home Dwelling (A B C & D)
Number
Average Value
Number
Average Value
Number
Average Value
Number
Average Value
Number
Average Value
Number
Average Value
Number
Average Value
LOANS ORIGINATED
283
$176,457
259
$156,500
552
$190,123
29
$136,320
3
$14,689,667
157
$127,135
3
$99,480
APPLICATIONS APPROVED, NOT ACCEPTED
29
$180,365
48
$152,252
67
$214,508
12
$97,284
0
$0
28
$133,648
0
$0
APPLICATIONS DENIED
59
$181,663
69
$129,824
319
$217,554
30
$41,168
3
$456,190
67
$146,818
1
$5,830
APPLICATIONS WITHDRAWN
46
$168,783
48
$151,532
160
$193,684
12
$105,103
1
$9,619,570
53
$127,383
0
$0
FILES CLOSED FOR INCOMPLETENESS
18
$185,295
10
$227,344
75
$196,293
4
$138,205
0
$0
12
$135,127
0
$0
Aggregated Statistics For Year 2008 (Based on 14 full and 12 partial tracts)
A) FHA, FSA/RHS & VA Home Purchase Loans
B) Conventional Home Purchase Loans
C) Refinancings
D) Home Improvement Loans
E) Loans on Dwellings For 5+ Families
F) Non-occupant Loans on < 5 Family Dwellings (A B C & D)
G) Loans On Manufactured Home Dwelling (A B C & D)
Number
Average Value
Number
Average Value
Number
Average Value
Number
Average Value
Number
Average Value
Number
Average Value
Number
Average Value
LOANS ORIGINATED
193
$211,275
420
$212,971
516
$205,354
65
$107,113
8
$2,595,796
219
$169,181
7
$58,784
APPLICATIONS APPROVED, NOT ACCEPTED
17
$240,735
135
$232,183
184
$220,064
35
$107,945
0
$0
51
$206,823
16
$79,994
APPLICATIONS DENIED
34
$225,573
177
$212,102
716
$246,378
125
$124,917
12
$990,050
131
$211,994
20
$67,008
APPLICATIONS WITHDRAWN
32
$259,550
106
$208,164
216
$228,535
25
$124,676
0
$0
54
$150,646
3
$109,620
FILES CLOSED FOR INCOMPLETENESS
14
$172,567
28
$232,586
71
$284,628
7
$164,996
0
$0
23
$264,387
1
$286,040
Aggregated Statistics For Year 2007 (Based on 14 full and 12 partial tracts)
A) FHA, FSA/RHS & VA Home Purchase Loans
B) Conventional Home Purchase Loans
C) Refinancings
D) Home Improvement Loans
E) Loans on Dwellings For 5+ Families
F) Non-occupant Loans on < 5 Family Dwellings (A B C & D)
G) Loans On Manufactured Home Dwelling (A B C & D)
Number
Average Value
Number
Average Value
Number
Average Value
Number
Average Value
Number
Average Value
Number
Average Value
Number
Average Value
LOANS ORIGINATED
18
$266,519
854
$236,098
1,676
$249,333
275
$170,353
33
$3,099,705
327
$231,664
9
$104,342
APPLICATIONS APPROVED, NOT ACCEPTED
2
$271,985
305
$239,314
474
$258,736
61
$139,030
0
$0
88
$261,955
16
$69,944
APPLICATIONS DENIED
2
$174,145
466
$257,864
1,502
$280,584
296
$162,264
8
$297,379
229
$265,111
26
$102,020
APPLICATIONS WITHDRAWN
7
$258,504
200
$264,239
569
$264,298
88
$204,420
1
$9,434,000
101
$281,586
2
$233,100
FILES CLOSED FOR INCOMPLETENESS
0
$0
71
$280,453
232
$282,376
19
$219,254
0
$0
19
$231,922
0
$0
Aggregated Statistics For Year 2006 (Based on 14 full and 12 partial tracts)
A) FHA, FSA/RHS & VA Home Purchase Loans
B) Conventional Home Purchase Loans
C) Refinancings
D) Home Improvement Loans
E) Loans on Dwellings For 5+ Families
F) Non-occupant Loans on < 5 Family Dwellings (A B C & D)
G) Loans On Manufactured Home Dwelling (A B C & D)
Number
Average Value
Number
Average Value
Number
Average Value
Number
Average Value
Number
Average Value
Number
Average Value
Number
Average Value
LOANS ORIGINATED
7
$331,281
2,267
$208,306
2,773
$246,341
428
$158,233
39
$3,983,855
634
$219,738
12
$53,512
APPLICATIONS APPROVED, NOT ACCEPTED
0
$0
486
$223,048
632
$260,044
91
$180,827
0
$0
157
$229,001
14
$80,516
APPLICATIONS DENIED
3
$259,827
942
$224,949
1,449
$274,372
307
$149,429
4
$380,755
217
$260,282
20
$125,988
APPLICATIONS WITHDRAWN
7
$257,833
549
$213,401
1,094
$269,339
102
$186,029
5
$2,521,280
176
$224,375
1
$115,470
FILES CLOSED FOR INCOMPLETENESS
0
$0
179
$209,482
265
$249,568
31
$179,997
1
$1,690,260
55
$221,109
0
$0
Aggregated Statistics For Year 2005 (Based on 14 full and 12 partial tracts)
A) FHA, FSA/RHS & VA Home Purchase Loans
B) Conventional Home Purchase Loans
C) Refinancings
D) Home Improvement Loans
E) Loans on Dwellings For 5+ Families
F) Non-occupant Loans on < 5 Family Dwellings (A B C & D)
G) Loans On Manufactured Home Dwelling (A B C & D)
Number
Average Value
Number
Average Value
Number
Average Value
Number
Average Value
Number
Average Value
Number
Average Value
Number
Average Value
LOANS ORIGINATED
33
$240,462
2,749
$198,505
3,222
$224,224
454
$153,055
27
$4,540,245
832
$205,018
17
$104,550
APPLICATIONS APPROVED, NOT ACCEPTED
3
$164,097
616
$191,918
551
$206,250
58
$106,653
0
$0
145
$192,244
27
$75,923
APPLICATIONS DENIED
3
$254,280
936
$186,736
1,334
$237,466
248
$118,453
3
$523,327
260
$213,171
36
$92,541
APPLICATIONS WITHDRAWN
15
$240,994
715
$201,091
1,129
$229,505
121
$155,710
0
$0
201
$187,811
4
$167,335
FILES CLOSED FOR INCOMPLETENESS
0
$0
128
$202,061
337
$215,256
25
$148,227
0
$0
29
$176,710
3
$190,173
Aggregated Statistics For Year 2004 (Based on 14 full and 12 partial tracts)
A) FHA, FSA/RHS & VA Home Purchase Loans
B) Conventional Home Purchase Loans
C) Refinancings
D) Home Improvement Loans
E) Loans on Dwellings For 5+ Families
F) Non-occupant Loans on < 5 Family Dwellings (A B C & D)
G) Loans On Manufactured Home Dwelling (A B C & D)
Number
Average Value
Number
Average Value
Number
Average Value
Number
Average Value
Number
Average Value
Number
Average Value
Number
Average Value
LOANS ORIGINATED
42
$186,896
1,653
$187,591
3,388
$183,641
464
$112,964
26
$753,325
567
$170,663
18
$56,853
APPLICATIONS APPROVED, NOT ACCEPTED
5
$177,284
386
$182,208
664
$182,128
78
$110,921
0
$0
81
$188,187
13
$84,942
APPLICATIONS DENIED
19
$188,317
552
$162,519
1,317
$179,530
277
$92,270
5
$333,094
180
$170,868
28
$72,905
APPLICATIONS WITHDRAWN
14
$174,381
335
$172,763
1,003
$183,005
114
$109,865
5
$1,183,934
106
$169,738
8
$164,369
FILES CLOSED FOR INCOMPLETENESS
2
$166,705
64
$179,027
368
$187,156
27
$125,363
0
$0
21
$141,143
2
$99,000
Aggregated Statistics For Year 2003 (Based on 14 full and 12 partial tracts)
A) FHA, FSA/RHS & VA Home Purchase Loans
B) Conventional Home Purchase Loans
C) Refinancings
D) Home Improvement Loans
E) Loans on Dwellings For 5+ Families
F) Non-occupant Loans on < 5 Family Dwellings (A B C & D)
Number
Average Value
Number
Average Value
Number
Average Value
Number
Average Value
Number
Average Value
Number
Average Value
LOANS ORIGINATED
187
$148,369
1,538
$159,198
5,081
$150,731
124
$54,330
36
$2,572,100
635
$140,703
APPLICATIONS APPROVED, NOT ACCEPTED
15
$159,401
326
$168,092
777
$151,872
35
$48,925
0
$0
100
$152,520
APPLICATIONS DENIED
46
$149,762
414
$157,724
1,458
$148,009
128
$42,792
4
$469,878
187
$140,493
APPLICATIONS WITHDRAWN
29
$152,218
214
$163,659
1,132
$149,831
27
$59,518
2
$4,041,750
86
$129,873
FILES CLOSED FOR INCOMPLETENESS
11
$145,688
47
$172,392
285
$156,258
13
$78,282
2
$2,948,100
37
$116,081
Aggregated Statistics For Year 2002 (Based on 3 full and 4 partial tracts)
A) FHA, FSA/RHS & VA Home Purchase Loans
B) Conventional Home Purchase Loans
C) Refinancings
D) Home Improvement Loans
E) Loans on Dwellings For 5+ Families
F) Non-occupant Loans on < 5 Family Dwellings (A B C & D)
Number
Average Value
Number
Average Value
Number
Average Value
Number
Average Value
Number
Average Value
Number
Average Value
LOANS ORIGINATED
113
$123,407
213
$115,245
568
$109,202
49
$23,810
3
$485,407
79
$96,567
APPLICATIONS APPROVED, NOT ACCEPTED
5
$148,526
51
$101,116
132
$107,231
8
$15,410
2
$739,040
19
$81,439
APPLICATIONS DENIED
33
$119,376
84
$116,502
236
$103,639
44
$20,386
8
$210,665
22
$89,268
APPLICATIONS WITHDRAWN
27
$125,776
48
$115,979
170
$114,965
13
$38,815
0
$0
10
$70,979
FILES CLOSED FOR INCOMPLETENESS
7
$93,591
8
$152,488
70
$116,825
0
$0
1
$205,430
5
$111,196
Aggregated Statistics For Year 2001 (Based on 3 full and 4 partial tracts)
A) FHA, FSA/RHS & VA Home Purchase Loans
B) Conventional Home Purchase Loans
C) Refinancings
D) Home Improvement Loans
E) Loans on Dwellings For 5+ Families
F) Non-occupant Loans on < 5 Family Dwellings (A B C & D)
Number
Average Value
Number
Average Value
Number
Average Value
Number
Average Value
Number
Average Value
Number
Average Value
LOANS ORIGINATED
115
$116,753
123
$110,965
401
$102,818
19
$22,991
5
$584,404
62
$86,196
APPLICATIONS APPROVED, NOT ACCEPTED
11
$127,577
24
$109,471
60
$118,340
3
$27,737
0
$0
10
$99,200
APPLICATIONS DENIED
20
$99,796
51
$89,475
250
$86,864
59
$21,451
3
$1,742,513
27
$78,776
APPLICATIONS WITHDRAWN
24
$109,457
23
$117,603
135
$99,106
17
$54,517
1
$2,915,050
13
$83,134
FILES CLOSED FOR INCOMPLETENESS
6
$116,188
12
$116,803
32
$87,710
2
$25,335
0
$0
0
$0
Aggregated Statistics For Year 2000 (Based on 3 full and 4 partial tracts)
A) FHA, FSA/RHS & VA Home Purchase Loans
B) Conventional Home Purchase Loans
C) Refinancings
D) Home Improvement Loans
E) Loans on Dwellings For 5+ Families
F) Non-occupant Loans on < 5 Family Dwellings (A B C & D)
Number
Average Value
Number
Average Value
Number
Average Value
Number
Average Value
Number
Average Value
Number
Average Value
LOANS ORIGINATED
155
$100,527
109
$118,570
132
$73,673
28
$29,395
2
$114,850
34
$82,891
APPLICATIONS APPROVED, NOT ACCEPTED
17
$89,855
37
$86,039
47
$83,150
22
$18,810
0
$0
9
$68,233
APPLICATIONS DENIED
21
$97,261
59
$72,912
163
$87,322
50
$20,824
2
$168,780
16
$86,001
APPLICATIONS WITHDRAWN
24
$98,902
27
$109,698
75
$66,293
3
$36,717
1
$6,500
5
$57,950
FILES CLOSED FOR INCOMPLETENESS
7
$96,779
3
$46,947
32
$88,198
0
$0
0
$0
6
$91,355
Aggregated Statistics For Year 1999 (Based on 4 full and 5 partial tracts)
A) FHA, FSA/RHS & VA Home Purchase Loans
B) Conventional Home Purchase Loans
C) Refinancings
D) Home Improvement Loans
E) Loans on Dwellings For 5+ Families
F) Non-occupant Loans on < 5 Family Dwellings (A B C & D)
2005 - 2018 National Fire Incident Reporting System (NFIRS) incidents
According to the data from the years 2005 - 2018 the average number of fires per year is 109. The highest number of fire incidents - 189 took place in 2005, and the least - 26 in 2011. The data has a dropping trend.
When looking into fire subcategories, the most incidents belonged to: Outside Fires (45.2%), and Structure Fires (27.3%).
Fire incident types reported to NFIRS in Zip Code 92507


+$7,167
-$7,562
 Nearest zip codes: 92501, 92506, 92313, 92324, 92557, 92508.


 According to the data from the years 2005 - 2018 the average number of fires per year is 109. The highest number of fire incidents - 189 took place in 2005, and the least - 26 in 2011. The data has a dropping trend.
 When looking into fire subcategories, the most incidents belonged to: Outside Fires (45.2%), and Structure Fires (27.3%).