Estimated zip code population in 2022: 1,608 Zip code population in 2010: 1,661 Zip code population in 2000: 1,495
Houses and condos: 1,064 Renter-occupied apartments: 135
% of renters here:
18%
State:
44%
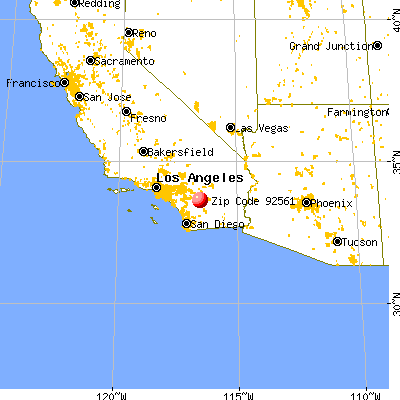
March 2022 cost of living index in zip code 92561: 74.2 (low, U.S. average is 100)
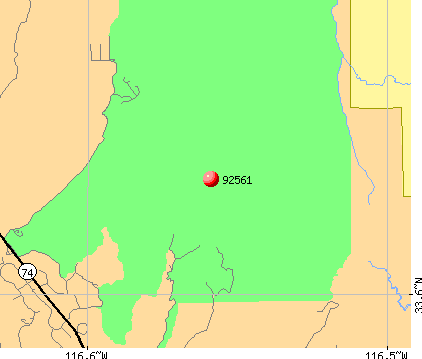
Land area: 158.2 sq. mi. Water area: 0.5 sq. mi.
Population density: 10 people per square mile
(very low).
OSM Map
General Map
Google Map
MSN Map
OSM Map
General Map
Google Map
MSN Map
OSM Map
General Map
Google Map
MSN Map
OSM Map
General Map
Google Map
MSN Map
Please wait while loading the map...
Real estate property taxes paid for housing units in 2022:
This zip code:
0.7% ($3,470)
California:
0.7% ($4,831)
Median real estate property taxes paid for housing units with mortgages in 2022: $3,508 (0.9%) Median real estate property taxes paid for housing units with no mortgage in 2022: $3,485 (0.6%)
Business Search- 14 Million verified businesses
Males: 801
(49.9%)
Females: 806
(50.1%)
For population 25 years and over in 92561:
High school or higher: 96.7%
Bachelor's degree or higher: 36.6%
Graduate or professional degree: 22.5%
Unemployed: 9.7%
Mean travel time to work (commute): 33.6 minutes
For population 15 years and over in 92561:
Never married: 16.3%
Now married: 53.1%
Separated: 1.8%
Widowed: 9.5%
Divorced: 19.3%
Zip code 92561 compared to state average:
Median house value below state average.
Unemployed percentage above state average.
Black race population percentage significantly below state average.
Hispanic race population percentage below state average.
Median age significantly above state average.
Foreign-born population percentage significantly below state average.
Renting percentage significantly below state average.
Length of stay since moving in significantly above state average.
Estimated median house/condo value in 2022: $474,190
92561:
$474,190
California:
$715,900
According to our research of California and other state lists, there was 1 registered sex offender living in 92561 zip code as of May 28, 2024. The ratio of all residents to sex offenders in zip code 92561 is 1,599 to 1. The ratio of registered sex offenders to all residents in this zip code is lower than the state average.
Median resident age:
This zip code:
60.5 years
California median age:
37.9 years
Average household size:
This zip code:
2.2 people
California:
2.8 people
Averages for the 2020 tax year for zip code 92561, filed in 2021:
Average Adjusted Gross Income (AGI) in 2020: $85,557 (Individual Income Tax Returns)
Here:
$85,557
State:
$95,910
Salary/wage: $65,843 (reported on 65.3% of returns)
Here:
$65,843
State:
$77,331
(% of AGI for various income ranges: 819.3% for AGIs below $25k, 3827.0% for AGIs $25k-50k, 5633.3% for AGIs $50k-75k, 9430.0% for AGIs $75k-100k, 15321.4% for AGIs $100k-200k)
Taxable interest for individuals: $815 (reported on 45.3% of returns)
This zip code:
$815
California:
$2,294
(% of AGI for various income ranges: 30.7% for AGIs below $25k, 24.0% for AGIs $25k-50k, 38.3% for AGIs $50k-75k, 60.0% for AGIs $75k-100k, 87.1% for AGIs $100k-200k)
Ordinary dividends: $5,575 (reported on 21.3% of returns)
Here:
$5,575
State:
$10,949
(% of AGI for various income ranges: 46.4% for AGIs below $25k, 85.0% for AGIs $25k-50k, 125.0% for AGIs $50k-75k, 167.1% for AGIs $100k-200k)
Net capital gain/loss in AGI: +$24,819 (reported on 21.3% of returns)
Here:
+$24,819
State:
+$49,306
(% of AGI for various income ranges: 10.7% for AGIs below $25k, 96.0% for AGIs $25k-50k, 451.7% for AGIs $50k-75k, 670.0% for AGIs $100k-200k)
Profit/loss from business: +$9,805 (reported on 26.7% of returns)
Here:
+$9,805
State:
+$15,671
(% of AGI for various income ranges: 341.4% for AGIs below $25k, 197.0% for AGIs $25k-50k, 1028.3% for AGIs $50k-75k, 955.7% for AGIs $100k-200k)
Taxable individual retirement arrangement distribution: $26,725 (reported on 10.7% of returns)
92561:
$26,725
California:
$23,505
(% of AGI for various income ranges: 663.0% for AGIs $25k-50k, 2107.1% for AGIs $100k-200k)
Total itemized deductions: $30,936 (reported on 18.7% of returns)
Here:
$30,936
State:
$39,517
(% of AGI for various income ranges: 592.1% for AGIs below $25k, 1696.7% for AGIs $50k-75k, 1758.6% for AGIs $100k-200k)
Charity contributions: $4,690 (reported on 13.3% of returns)
Here:
$4,690
State:
$12,598
(% of AGI for various income ranges: 233.3% for AGIs $50k-75k, 174.3% for AGIs $100k-200k)
Taxes paid: $7,793 (reported on 18.7% of returns)
92561:
$7,793
State:
$8,807
(% of AGI for various income ranges: 102.1% for AGIs below $25k, 416.7% for AGIs $50k-75k, 582.9% for AGIs $100k-200k)
Earned income credit: $1,864 (reported on 14.7% of returns)
Here:
$1,864
State:
$2,074
(% of AGI for various income ranges: 100.7% for AGIs below $25k, 64.0% for AGIs $25k-50k)
Percentage of individuals using paid preparers for their 2020 taxes: 90.7%
Here:
91%
State:
92%
(% for various income ranges: 83.3% for AGIs below $25k, 94.1% for AGIs $25k-50k, 90.0% for AGIs $50k-75k, 100.0% for AGIs $75k-100k, 91.7% for AGIs $100k-200k, 100.0% for AGIs over 200k)
Averages for the 2012 tax year for zip code 92561, filed in 2013:
Average Adjusted Gross Income (AGI) in 2012: $72,093 (Individual Income Tax Returns)
Here:
$72,093
State:
$72,726
Salary/wage: $54,843 (reported on 67.3% of returns)
Here:
$54,843
State:
$59,079
(% of AGI for various income ranges: 55.7% for AGIs below $25k, 62.1% for AGIs $25k-50k, 60.2% for AGIs $50k-75k, 56.6% for AGIs $75k-100k, 51.5% for AGIs $100k-200k, 39.4% for AGIs over 200k)
Taxable interest for individuals: $1,388 (reported on 47.3% of returns)
This zip code:
$1,388
California:
$2,146
(% of AGI for various income ranges: 1.8% for AGIs below $25k, 1.8% for AGIs $25k-50k, 0.3% for AGIs $50k-75k, 0.8% for AGIs $75k-100k, 1.2% for AGIs $100k-200k, 0.4% for AGIs over 200k)
Ordinary dividends: $5,046 (reported on 23.6% of returns)
Here:
$5,046
State:
$9,308
(% of AGI for various income ranges: 3.3% for AGIs below $25k, 4.5% for AGIs $25k-50k, 1.5% for AGIs $75k-100k, 2.7% for AGIs $100k-200k)
Net capital gain/loss in AGI: +$10,983 (reported on 21.8% of returns)
Here:
+$10,983
State:
+$30,460
(% of AGI for various income ranges: 11.3% for AGIs $100k-200k)
Profit/loss from business: +$17,333 (reported on 27.3% of returns)
Here:
+$17,333
State:
+$17,064
(% of AGI for various income ranges: 15.0% for AGIs below $25k, 7.3% for AGIs $25k-50k, 4.5% for AGIs $50k-75k, 14.2% for AGIs $100k-200k)
Taxable individual retirement arrangement distribution: $23,688 (reported on 14.5% of returns)
92561:
$23,688
California:
$19,557
(% of AGI for various income ranges: 16.3% for AGIs below $25k, 8.5% for AGIs $50k-75k, 9.0% for AGIs $100k-200k)
Total itemized deductions: $30,985 (26% of AGI, reported on 47.3% of returns)
Here:
$30,985
State:
$34,004
Here:
26.2% of AGI
State:
22.7% of AGI
(% of AGI for various income ranges: 20.2% for AGIs below $25k, 18.3% for AGIs $25k-50k, 20.4% for AGIs $50k-75k, 22.1% for AGIs $75k-100k, 23.3% for AGIs $100k-200k, 17.2% for AGIs over 200k)
Charity contributions: $2,845 (reported on 40.0% of returns)
Here:
$2,845
State:
$4,659
(% of AGI for various income ranges: 2.1% for AGIs $25k-50k, 1.7% for AGIs $50k-75k, 1.9% for AGIs $75k-100k, 1.7% for AGIs $100k-200k, 1.4% for AGIs over 200k)
Taxes paid: $11,019 (reported on 47.3% of returns)
92561:
$11,019
State:
$14,448
(% of AGI for various income ranges: 4.7% for AGIs below $25k, 4.4% for AGIs $25k-50k, 5.1% for AGIs $50k-75k, 8.2% for AGIs $75k-100k, 8.6% for AGIs $100k-200k, 8.0% for AGIs over 200k)
Earned income credit: $1,986 (reported on 12.7% of returns)
Here:
$1,986
State:
$2,286
(% of AGI for various income ranges: 6.2% for AGIs below $25k)
Percentage of individuals using paid preparers for their 2012 taxes: 65.5%
Here:
65%
State:
64%
(% for various income ranges: 55.6% for AGIs below $25k, 66.7% for AGIs $25k-50k, 62.5% for AGIs $50k-75k, 80.0% for AGIs $75k-100k, 66.7% for AGIs $100k-200k, 100.0% for AGIs over 200k)
Averages for the 2004 tax year for zip code 92561, filed in 2005:
Average Adjusted Gross Income (AGI) in 2004: $61,052 (Individual Income Tax Returns)
Here:
$61,052
State:
$58,600
Salary/wage: $51,327 (reported on 71.7% of returns)
Here:
$51,327
State:
$49,455
(% of AGI for various income ranges: 100.3% for AGIs below $10k, 62.8% for AGIs $10k-25k, 73.2% for AGIs $25k-50k, 69.5% for AGIs $50k-75k, 63.9% for AGIs $75k-100k, 52.4% for AGIs over 100k)
Taxable interest for individuals: $2,192 (reported on 56.3% of returns)
This zip code:
$2,192
California:
$2,365
(% of AGI for various income ranges: 31.0% for AGIs below $10k, 5.3% for AGIs $10k-25k, 1.1% for AGIs $25k-50k, 1.0% for AGIs $50k-75k, 3.0% for AGIs $75k-100k, 1.4% for AGIs over 100k)
Taxable dividends: $3,575 (reported on 28.2% of returns)
Here:
$3,575
State:
$4,746
(% of AGI for various income ranges: 10.1% for AGIs below $10k, 2.3% for AGIs $10k-25k, 0.5% for AGIs $25k-50k, 0.7% for AGIs $50k-75k, 2.3% for AGIs $75k-100k, 1.8% for AGIs over 100k)
Net capital gain/loss: +$12,520 (reported on 25.0% of returns)
Here:
+$12,520
State:
+$23,418
(% of AGI for various income ranges: -0.3% for AGIs below $10k, -0.4% for AGIs $25k-50k, 4.1% for AGIs $50k-75k, 2.1% for AGIs $75k-100k, 8.2% for AGIs over 100k)
Profit/loss from business: +$14,436 (reported on 25.1% of returns)
Here:
+$14,436
State:
+$16,826
(% of AGI for various income ranges: -33.0% for AGIs below $10k, 15.4% for AGIs $10k-25k, 10.6% for AGIs $25k-50k, 7.2% for AGIs $50k-75k, 8.5% for AGIs $75k-100k, 3.3% for AGIs over 100k)
IRA payment deduction: $3,824 (reported on 2.9% of returns)
92561:
$3,824
California:
$3,192
Total itemized deductions: $24,850 (24% of AGI, reported on 49.4% of returns)
Here:
$24,850
State:
$28,113
Here:
24.4% of AGI
State:
25.3% of AGI
(% of AGI for various income ranges: 26.7% for AGIs $10k-25k, 20.2% for AGIs $25k-50k, 23.3% for AGIs $50k-75k, 22.1% for AGIs $75k-100k, 18.0% for AGIs over 100k)
Charity contributions deductions: $2,593 (3% of AGI, reported on 41.8% of returns)
Here:
$2,593
State:
$3,923
Here:
2.6% of AGI
State:
3.3% of AGI
(% of AGI for various income ranges: 1.6% for AGIs $10k-25k, 1.7% for AGIs $25k-50k, 2.4% for AGIs $50k-75k, 2.8% for AGIs $75k-100k, 1.4% for AGIs over 100k)
Total tax: $11,199 (reported on 79.8% of returns)
92561:
$11,199
State:
$10,761
(% of AGI for various income ranges: 4.6% for AGIs below $10k, 5.5% for AGIs $10k-25k, 7.7% for AGIs $25k-50k, 9.7% for AGIs $50k-75k, 11.5% for AGIs $75k-100k, 19.9% for AGIs over 100k)
Earned income credit: $1,262 (reported on 11.0% of returns)
Here:
$1,262
State:
$1,763
Percentage of individuals using paid preparers for their 2004 taxes: 68.5%
Here:
68%
State:
66%
(% for various income ranges: 52.2% for AGIs below $10k, 69.0% for AGIs $10k-25k, 70.4% for AGIs $25k-50k, 67.3% for AGIs $50k-75k, 69.4% for AGIs $75k-100k, 88.0% for AGIs over 100k)
Likely homosexual households (counted as self-reported same-sex unmarried-partner households)
Lesbian couples: 1.9% of all households
Gay men: 1.6% of all households
Household received Food Stamps/SNAP in the past 12 months: 36 Household did not receive Food Stamps/SNAP in the past 12 months: 692
Women who had a birth in the past 12 months: 69 (69 now married, 0 unmarried) Women who did not have a birth in the past 12 months: 165 (42 now married, 124 unmarried)
Housing units in zip code 92561 with a mortgage: 276 (14 second mortgage, 15 both second mortgage and home equity loan) Houses without a mortgage: 7
Median monthly owner costs for units with a mortgage: $1,913 Median monthly owner costs for units without a mortgage: $812
Residents with income below the poverty level in 2022:
This zip code:
15.1%
Whole state:
12.2%
Residents with income below 50% of the poverty level in 2022:
This zip code:
6.2%
Whole state:
6.2%
Median number of rooms in houses and condos:
Here:
5.5
State:
6.0
Median number of rooms in apartments:
Here:
5.7
State:
3.9
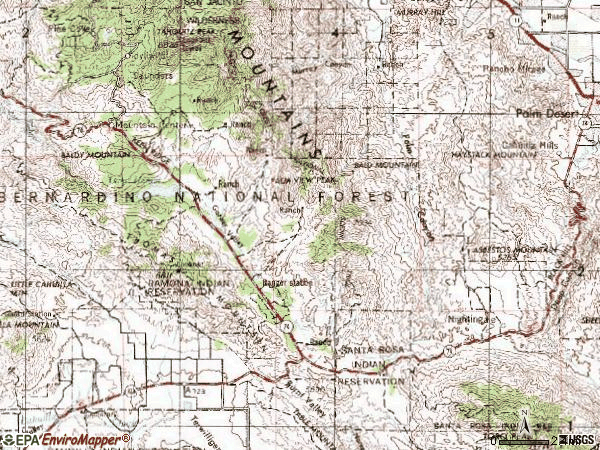
Notable locations in this zip code not listed on our city pages
Creeks: Gold Shot Creek (A), Martinez Creek (B), Morris Creek (C), Pipe Creek (D), Herkey Creek (E), Grapevine Creek (F), Dry Creek (G), Coldwater Creek (H), Strawberry Creek (I). Display/hide their locations on the map
In group quarters: 12 (-1 institutionalized population)
Size of family households: 308 2-persons, 77 3-persons, 108 4-persons
Size of nonfamily households: 243 1-person, 2 2-persons, 2 3-persons
152 married couples with children.
45 single-parent households (45 men).
89.2% of residents of 92561 zip code speak English at home.
10.9% of residents speak Spanish at home (51% very well, 49% not well).
0.1% of residents speak other Indo-European language at home (100% well).
0.3% of residents speak other language at home (100% very well).
Foreign born population: 164 (10.2%) (53.8% of them are naturalized citizens)
This zip code:
10.2%
Whole state:
26.7%
77%Brazil
9%Austria
9%India
1%Honduras
14%English
11%Norwegian
8%Swedish
8%German
6%American
6%Scottish
5%Irish
Year of entry for the foreign-born population
22010 or later
722000 to 2009
01990 to 1999
83Before 1990
Facilities with environmental interests located in this zip code:
CALTRANS DISTRICT 8 KEEN CAMP (ROUTE 74 PM 65 23 in MOUNTAIN CENTER, CA)
STATE MASTER (California - Hazardous Waste Tracking) - HAZARDOU WASTE PROGRAM Small Quantity Generators, between 100 kg and 1000 kg of hazardous waste/month (Resource Conservation and Recovery Act (tracking hazardous waste))
CAMP JOE SCHERMAN (32700 MORRIS RANCH ROAD in MOUNTAIN CENTER, CA)
Small Quantity Generators, between 100 kg and 1000 kg of hazardous waste/month (Resource Conservation and Recovery Act (tracking hazardous waste)) - notification Organizations: GIRL SCOUT COUNCIL OF ORANGE COUNTY (CONTACT/OWNER)
Housing units lacking complete plumbing facilities: 2.4% Housing units lacking complete kitchen facilities: 2.3%
42.9%Bottled, tank, or LP gas
31.8%Electricity
11.7%Utility gas
8.9%Wood
5.0%Other fuel
Population in 1990: 1,896.
Place of birth for U.S.-born residents:
This state: 828
Northeast: 139
Midwest: 157
South: 147
West: 155
57% of the 92561 zip code residents lived in the same house 5 years ago. Out of people who lived in different houses, 78% lived in this county. Out of people who lived in different counties, 50% lived in California.
95% of the 92561 zip code residents lived in the same house 1 year ago. Out of people who lived in different houses, 65% moved from this county. Out of people who lived in different houses, 37% moved from different county within same state.
Private vs. public school enrollment:
Students in private schools in grades 1 to 8 (elementary and middle school):
Here:
0.0%
California:
10.5%
Students in private schools in grades 9 to 12 (high school):
Here:
0.0%
California:
8.5%
Students in private undergraduate colleges:
Here:
0.0%
California:
15.9%
Occupation by median earnings in the past 12 months ($)
70,908Education, training, and library occupations
69,194Construction and extraction occupations
58,409Management occupations
35,305Office and administrative support occupations
29,250Sales and related occupations
9,842Healthcare support occupations
Companies with federal contracts located in this zip code:
PINE SPRINGS RANCH (58000 APPLE CANYON ROAD in MOUNTAIN CENTE, CA; small business)
$32,358 with Navy for Lease or Rental of Facilities -- Conference Space and Facilities. Signed on 1999-11-16. Completion date: 2000-09-24.
Top industries in this zip code by the number of employees in 2005:
Health Care and Social Assistance: Other Residential Care Facilities (250-499 employees: 1 establishment)
Accommodation and Food Services: Recreational and Vacation Camps (except Campgrounds) (20-49: 1, 1-4: 1)
Arts, Entertainment, and Recreation: Zoos and Botanical Gardens (10-19: 1)
Construction: Painting and Wall Covering Contractors (5-9: 1, 1-4: 1)
Construction: New Single-Family Housing Construction (except Operative Builders) (5-9: 1, 1-4: 1)
Accommodation and Food Services: Full-Service Restaurants (5-9: 1, 1-4: 1)
Professional, Scientific, and Technical Services: Marketing Consulting Services (5-9: 1)
People in group quarters in 2010:
7 people in other noninstitutional facilities
People in group quarters in 2000:
62 people in local jails and other confinement facilities (including police lockups)
9 people in religious group quarters
Fatal accident statistics in 2014:
Fatal accident count: 3
Vehicles involved in fatal accidents: 6
Fatal accidents caused by drunken drivers: 2
Fatalities: 3
Persons involved in fatal accidents: 14
Pedestrians involved in fatal accidents: 0
Fatal accident statistics in 2013:
Fatal accident count: 1
Vehicles involved in fatal accidents: 2
Fatal accidents caused by drunken drivers: 0
Fatalities: 1
Persons involved in fatal accidents: 3
Pedestrians involved in fatal accidents: 0
Home Mortgage Disclosure Act Aggregated Statistics For Year 2009 (Based on 8 partial tracts)
A) FHA, FSA/RHS & VA Home Purchase Loans
B) Conventional Home Purchase Loans
C) Refinancings
D) Home Improvement Loans
F) Non-occupant Loans on < 5 Family Dwellings (A B C & D)
G) Loans On Manufactured Home Dwelling (A B C & D)
Number
Average Value
Number
Average Value
Number
Average Value
Number
Average Value
Number
Average Value
Number
Average Value
LOANS ORIGINATED
27
$227,107
55
$311,299
157
$356,190
6
$134,783
83
$418,458
21
$195,096
APPLICATIONS APPROVED, NOT ACCEPTED
4
$241,148
7
$275,703
19
$331,425
1
$100,290
9
$410,038
4
$119,968
APPLICATIONS DENIED
6
$167,722
19
$318,498
97
$405,049
6
$168,685
36
$507,416
16
$157,797
APPLICATIONS WITHDRAWN
6
$222,573
13
$315,188
51
$380,137
3
$150,923
15
$484,276
11
$231,429
FILES CLOSED FOR INCOMPLETENESS
1
$244,510
2
$254,695
9
$297,957
1
$83,800
4
$338,998
1
$282,340
Aggregated Statistics For Year 2008 (Based on 8 partial tracts)
A) FHA, FSA/RHS & VA Home Purchase Loans
B) Conventional Home Purchase Loans
C) Refinancings
D) Home Improvement Loans
F) Non-occupant Loans on < 5 Family Dwellings (A B C & D)
G) Loans On Manufactured Home Dwelling (A B C & D)
Number
Average Value
Number
Average Value
Number
Average Value
Number
Average Value
Number
Average Value
Number
Average Value
LOANS ORIGINATED
13
$241,776
80
$419,876
119
$438,418
13
$249,952
71
$623,578
33
$187,999
APPLICATIONS APPROVED, NOT ACCEPTED
4
$253,668
13
$506,038
28
$398,639
1
$13,340
12
$493,216
8
$200,916
APPLICATIONS DENIED
3
$266,577
25
$601,360
116
$351,198
14
$189,876
28
$515,994
24
$196,640
APPLICATIONS WITHDRAWN
4
$239,145
12
$701,519
41
$395,149
8
$379,096
17
$450,089
6
$194,188
FILES CLOSED FOR INCOMPLETENESS
1
$110,320
3
$308,547
10
$280,878
2
$1,491,515
3
$794,927
3
$108,417
Aggregated Statistics For Year 2007 (Based on 8 partial tracts)
A) FHA, FSA/RHS & VA Home Purchase Loans
B) Conventional Home Purchase Loans
C) Refinancings
D) Home Improvement Loans
F) Non-occupant Loans on < 5 Family Dwellings (A B C & D)
G) Loans On Manufactured Home Dwelling (A B C & D)
Number
Average Value
Number
Average Value
Number
Average Value
Number
Average Value
Number
Average Value
Number
Average Value
LOANS ORIGINATED
10
$275,092
164
$450,081
250
$395,905
44
$289,258
121
$544,387
67
$209,269
APPLICATIONS APPROVED, NOT ACCEPTED
3
$210,163
31
$472,171
64
$390,611
9
$200,889
21
$417,410
14
$258,601
APPLICATIONS DENIED
3
$303,250
47
$387,998
206
$394,385
43
$199,145
45
$430,179
52
$227,715
APPLICATIONS WITHDRAWN
0
$0
23
$475,750
74
$391,868
9
$291,773
18
$675,567
10
$182,671
FILES CLOSED FOR INCOMPLETENESS
0
$0
6
$457,777
27
$365,196
6
$193,622
5
$276,428
7
$259,940
Aggregated Statistics For Year 2006 (Based on 8 partial tracts)
A) FHA, FSA/RHS & VA Home Purchase Loans
B) Conventional Home Purchase Loans
C) Refinancings
D) Home Improvement Loans
F) Non-occupant Loans on < 5 Family Dwellings (A B C & D)
G) Loans On Manufactured Home Dwelling (A B C & D)
Number
Average Value
Number
Average Value
Number
Average Value
Number
Average Value
Number
Average Value
Number
Average Value
LOANS ORIGINATED
10
$278,530
274
$403,958
333
$361,945
47
$218,807
143
$505,926
75
$213,779
APPLICATIONS APPROVED, NOT ACCEPTED
1
$338,950
49
$387,471
68
$348,871
11
$220,628
21
$442,390
11
$203,125
APPLICATIONS DENIED
3
$277,013
83
$392,516
175
$370,136
33
$183,705
39
$450,198
41
$210,480
APPLICATIONS WITHDRAWN
1
$397,010
45
$380,054
108
$392,226
11
$219,232
21
$520,811
14
$216,444
FILES CLOSED FOR INCOMPLETENESS
1
$239,510
9
$453,071
31
$368,887
2
$177,795
4
$314,990
3
$268,643
Aggregated Statistics For Year 2005 (Based on 8 partial tracts)
A) FHA, FSA/RHS & VA Home Purchase Loans
B) Conventional Home Purchase Loans
C) Refinancings
D) Home Improvement Loans
F) Non-occupant Loans on < 5 Family Dwellings (A B C & D)
G) Loans On Manufactured Home Dwelling (A B C & D)
Number
Average Value
Number
Average Value
Number
Average Value
Number
Average Value
Number
Average Value
Number
Average Value
LOANS ORIGINATED
9
$243,209
347
$412,120
367
$329,918
56
$198,451
185
$441,756
103
$195,774
APPLICATIONS APPROVED, NOT ACCEPTED
0
$0
52
$304,636
55
$294,795
9
$362,641
20
$351,838
16
$153,578
APPLICATIONS DENIED
3
$224,810
107
$285,752
162
$306,000
34
$120,074
35
$310,646
48
$177,748
APPLICATIONS WITHDRAWN
2
$279,795
74
$337,983
137
$286,081
15
$226,639
26
$511,577
44
$193,699
FILES CLOSED FOR INCOMPLETENESS
0
$0
17
$337,116
52
$292,718
4
$188,820
5
$234,432
9
$167,014
Aggregated Statistics For Year 2004 (Based on 8 partial tracts)
A) FHA, FSA/RHS & VA Home Purchase Loans
B) Conventional Home Purchase Loans
C) Refinancings
D) Home Improvement Loans
E) Loans on Dwellings For 5+ Families
F) Non-occupant Loans on < 5 Family Dwellings (A B C & D)
G) Loans On Manufactured Home Dwelling (A B C & D)
Number
Average Value
Number
Average Value
Number
Average Value
Number
Average Value
Number
Average Value
Number
Average Value
Number
Average Value
LOANS ORIGINATED
12
$207,892
385
$293,127
371
$292,654
27
$186,727
1
$994,650
208
$341,878
77
$170,510
APPLICATIONS APPROVED, NOT ACCEPTED
0
$0
61
$258,322
80
$255,475
9
$165,534
0
$0
25
$316,031
21
$158,311
APPLICATIONS DENIED
3
$180,723
87
$292,510
184
$236,814
30
$142,078
0
$0
46
$245,836
49
$149,074
APPLICATIONS WITHDRAWN
1
$275,800
47
$292,870
111
$254,700
12
$161,753
0
$0
20
$275,854
18
$151,879
FILES CLOSED FOR INCOMPLETENESS
1
$191,610
8
$234,168
40
$231,398
4
$38,232
0
$0
8
$218,129
6
$194,735
Aggregated Statistics For Year 2003 (Based on 8 partial tracts)
A) FHA, FSA/RHS & VA Home Purchase Loans
B) Conventional Home Purchase Loans
C) Refinancings
D) Home Improvement Loans
E) Loans on Dwellings For 5+ Families
F) Non-occupant Loans on < 5 Family Dwellings (A B C & D)
Number
Average Value
Number
Average Value
Number
Average Value
Number
Average Value
Number
Average Value
Number
Average Value
LOANS ORIGINATED
14
$148,524
247
$249,839
602
$269,170
6
$55,705
0
$0
222
$299,899
APPLICATIONS APPROVED, NOT ACCEPTED
1
$174,190
37
$228,139
84
$270,055
2
$99,395
0
$0
26
$297,369
APPLICATIONS DENIED
0
$0
46
$177,004
196
$211,430
12
$84,947
0
$0
26
$310,610
APPLICATIONS WITHDRAWN
2
$182,785
35
$238,705
155
$202,731
5
$268,214
1
$184,760
27
$324,087
FILES CLOSED FOR INCOMPLETENESS
1
$135,720
5
$220,896
29
$230,707
2
$79,290
0
$0
6
$195,868
Aggregated Statistics For Year 2002 (Based on 4 partial tracts)
A) FHA, FSA/RHS & VA Home Purchase Loans
B) Conventional Home Purchase Loans
C) Refinancings
D) Home Improvement Loans
E) Loans on Dwellings For 5+ Families
F) Non-occupant Loans on < 5 Family Dwellings (A B C & D)
Number
Average Value
Number
Average Value
Number
Average Value
Number
Average Value
Number
Average Value
Number
Average Value
LOANS ORIGINATED
17
$126,991
141
$147,361
255
$145,460
8
$52,945
0
$0
99
$131,918
APPLICATIONS APPROVED, NOT ACCEPTED
1
$53,710
16
$141,595
44
$154,262
3
$39,640
0
$0
10
$148,721
APPLICATIONS DENIED
1
$84,190
25
$137,559
96
$141,345
5
$37,244
1
$118,660
15
$120,687
APPLICATIONS WITHDRAWN
2
$153,505
13
$153,875
54
$146,924
5
$46,180
0
$0
9
$128,279
FILES CLOSED FOR INCOMPLETENESS
0
$0
6
$121,142
27
$150,269
0
$0
0
$0
3
$234,027
Aggregated Statistics For Year 2001 (Based on 4 partial tracts)
A) FHA, FSA/RHS & VA Home Purchase Loans
B) Conventional Home Purchase Loans
C) Refinancings
D) Home Improvement Loans
F) Non-occupant Loans on < 5 Family Dwellings (A B C & D)
Number
Average Value
Number
Average Value
Number
Average Value
Number
Average Value
Number
Average Value
LOANS ORIGINATED
18
$124,977
118
$137,029
181
$135,972
11
$39,265
72
$137,654
APPLICATIONS APPROVED, NOT ACCEPTED
1
$161,500
18
$145,626
38
$160,972
5
$44,792
8
$153,500
APPLICATIONS DENIED
2
$117,885
20
$138,448
76
$136,564
6
$47,910
6
$109,265
APPLICATIONS WITHDRAWN
2
$108,920
17
$162,859
42
$128,490
4
$46,450
8
$105,434
FILES CLOSED FOR INCOMPLETENESS
0
$0
4
$178,625
15
$125,391
1
$25,400
1
$340,720
Aggregated Statistics For Year 2000 (Based on 4 partial tracts)
A) FHA, FSA/RHS & VA Home Purchase Loans
B) Conventional Home Purchase Loans
C) Refinancings
D) Home Improvement Loans
F) Non-occupant Loans on < 5 Family Dwellings (A B C & D)
Number
Average Value
Number
Average Value
Number
Average Value
Number
Average Value
Number
Average Value
LOANS ORIGINATED
20
$109,653
114
$126,742
57
$112,306
12
$22,232
34
$127,185
APPLICATIONS APPROVED, NOT ACCEPTED
2
$136,725
17
$107,474
15
$115,336
3
$36,773
4
$103,242
APPLICATIONS DENIED
1
$177,990
24
$134,555
45
$104,937
12
$39,215
7
$155,247
APPLICATIONS WITHDRAWN
3
$98,280
16
$104,291
21
$94,560
4
$26,970
3
$92,067
FILES CLOSED FOR INCOMPLETENESS
1
$120,480
1
$119,000
9
$89,328
1
$12,070
1
$119,330
Aggregated Statistics For Year 1999 (Based on 3 partial tracts)
A) FHA, FSA/RHS & VA Home Purchase Loans
B) Conventional Home Purchase Loans
C) Refinancings
D) Home Improvement Loans
F) Non-occupant Loans on < 5 Family Dwellings (A B C & D)
2006 - 2018 National Fire Incident Reporting System (NFIRS) incidents
Based on the data from the years 2006 - 2018 the average number of fires per year is 9. The highest number of fires - 30 took place in 2018, and the least - 2 in 2010. The data has a growing trend.
When looking into fire subcategories, the most incidents belonged to: Outside Fires (47.9%), and Mobile Property/Vehicle Fires (28.1%).
Fire incident types reported to NFIRS in Zip Code 92561


 Nearest zip codes: 92539, 92264, 92549, 92262, 92260, 92270.


 Based on the data from the years 2006 - 2018 the average number of fires per year is 9. The highest number of fires - 30 took place in 2018, and the least - 2 in 2010. The data has a growing trend.
 When looking into fire subcategories, the most incidents belonged to: Outside Fires (47.9%), and Mobile Property/Vehicle Fires (28.1%).