Cities: French Valley, CA (13.11%) ,
Winchester, CA (8.82%) ,
Temecula, CA (1.46%) ,
Menifee, CA (0.69%) ,
Green Acres, CA (0.29%) County: Riverside County, CA Estimated zip code population in 2022: 35,429
Zip code population in 2010: 23,172
Zip code population in 2000: 4,080
Houses and condos: 10,090
Renter-occupied apartments: 1,743
% of renters here:
18%State:
44%
March 2022 cost of living index in zip code 92596: 82.6
(low, U.S. average is 100)
Land area: 61.2
sq. mi.
Water area: 0.0
sq. mi.
Population density: 579 people per square mile (low).
OSM Map
General Map
Google Map
MSN Map
OSM Map
General Map
Google Map
MSN Map
OSM Map
General Map
Google Map
MSN Map
OSM Map
General Map
Google Map
MSN Map
Please wait while loading the map...
Real estate property taxes paid for housing units in 2022:
This zip code:
1.0% ($6,159)California:
0.7% ($4,831)
Median real estate property taxes paid for housing units with mortgages in 2022: $6,298 (1.0%)
Median real estate property taxes paid for housing units with no mortgage in 2022: $5,857 (1.0%)
Profiles of local businesses
Business Search - 14 Million verified businesses
Males: 17,565 Females: 17,863
For population 25 years and over in 92596:
High school or higher: 90.8%Bachelor's degree or higher: 31.8%Graduate or professional degree: 8.7%Unemployed: 6.0%Mean travel time to work (commute): 40.9 minutes
For population 15 years and over in 92596:
Never married: 29.2%Now married: 56.4%Separated: 1.2%Widowed: 3.2%Divorced: 10.0%
Zip code 92596 compared to state average:
Foreign-born population percentage below state average. Renting percentage significantly below state average. Length of stay since moving in significantly below state average. Number of rooms per house above state average. House age significantly below state average. 14,579 41.2% White 12,305 34.7% Hispanic or Latino 3,291 9.3% Asian 2,307 6.5% Two or more races 2,233 6.3% Black 338 1.0% Native Hawaiian and Other 238 0.7% American Indian 134 0.4% Some other race
Data:
Median household income ($)
Median household income (% change since 2000)
Household income diversity
Ratio of average income to average house value (%)
Ratio of average income to average rent
Median household income ($) - White
Median household income ($) - Black or African American
Median household income ($) - Asian
Median household income ($) - Hispanic or Latino
Median household income ($) - American Indian and Alaska Native
Median household income ($) - Multirace
Median household income ($) - Other Race
Median household income for houses/condos with a mortgage ($)
Median household income for apartments without a mortgage ($)
Races - White alone (%)
Races - White alone (% change since 2000)
Races - Black alone (%)
Races - Black alone (% change since 2000)
Races - American Indian alone (%)
Races - American Indian alone (% change since 2000)
Races - Asian alone (%)
Races - Asian alone (% change since 2000)
Races - Hispanic (%)
Races - Hispanic (% change since 2000)
Races - Native Hawaiian and Other Pacific Islander alone (%)
Races - Native Hawaiian and Other Pacific Islander alone (% change since 2000)
Races - Two or more races (%)
Races - Two or more races (% change since 2000)
Races - Other race alone (%)
Races - Other race alone (% change since 2000)
Racial diversity
Unemployment (%)
Unemployment (% change since 2000)
Unemployment (%) - White
Unemployment (%) - Black or African American
Unemployment (%) - Asian
Unemployment (%) - Hispanic or Latino
Unemployment (%) - American Indian and Alaska Native
Unemployment (%) - Multirace
Unemployment (%) - Other Race
Population density (people per square mile)
Population - Males (%)
Population - Females (%)
Population - Males (%) - White
Population - Males (%) - Black or African American
Population - Males (%) - Asian
Population - Males (%) - Hispanic or Latino
Population - Males (%) - American Indian and Alaska Native
Population - Males (%) - Multirace
Population - Males (%) - Other Race
Population - Females (%) - White
Population - Females (%) - Black or African American
Population - Females (%) - Asian
Population - Females (%) - Hispanic or Latino
Population - Females (%) - American Indian and Alaska Native
Population - Females (%) - Multirace
Population - Females (%) - Other Race
Coronavirus confirmed cases (May 28, 2024)
Deaths caused by coronavirus (May 28, 2024)
Coronavirus confirmed cases (per 100k population) (May 28, 2024)
Deaths caused by coronavirus (per 100k population) (May 28, 2024)
Daily increase in number of cases (May 28, 2024)
Weekly increase in number of cases (May 28, 2024)
Cases doubled (in days) (May 28, 2024)
Hospitalized patients (Apr 18, 2022)
Negative test results (Apr 18, 2022)
Total test results (Apr 18, 2022)
COVID Vaccine doses distributed (per 100k population) (Sep 19, 2023)
COVID Vaccine doses administered (per 100k population) (Sep 19, 2023)
COVID Vaccine doses distributed (Sep 19, 2023)
COVID Vaccine doses administered (Sep 19, 2023)
Likely homosexual households (%)
Likely homosexual households (% change since 2000)
Likely homosexual households - Lesbian couples (%)
Likely homosexual households - Lesbian couples (% change since 2000)
Likely homosexual households - Gay men (%)
Likely homosexual households - Gay men (% change since 2000)
Cost of living index
Median gross rent ($)
Median contract rent ($)
Median monthly housing costs ($)
Median house or condo value ($)
Median house or condo value ($ change since 2000)
Mean house or condo value by units in structure - 1, detached ($)
Mean house or condo value by units in structure - 1, attached ($)
Mean house or condo value by units in structure - 2 ($)
Mean house or condo value by units in structure by units in structure - 3 or 4 ($)
Mean house or condo value by units in structure - 5 or more ($)
Mean house or condo value by units in structure - Boat, RV, van, etc. ($)
Mean house or condo value by units in structure - Mobile home ($)
Median house or condo value ($) - White
Median house or condo value ($) - Black or African American
Median house or condo value ($) - Asian
Median house or condo value ($) - Hispanic or Latino
Median house or condo value ($) - American Indian and Alaska Native
Median house or condo value ($) - Multirace
Median house or condo value ($) - Other Race
Median resident age
Resident age diversity
Median resident age - Males
Median resident age - Females
Median resident age - White
Median resident age - Black or African American
Median resident age - Asian
Median resident age - Hispanic or Latino
Median resident age - American Indian and Alaska Native
Median resident age - Multirace
Median resident age - Other Race
Median resident age - Males - White
Median resident age - Males - Black or African American
Median resident age - Males - Asian
Median resident age - Males - Hispanic or Latino
Median resident age - Males - American Indian and Alaska Native
Median resident age - Males - Multirace
Median resident age - Males - Other Race
Median resident age - Females - White
Median resident age - Females - Black or African American
Median resident age - Females - Asian
Median resident age - Females - Hispanic or Latino
Median resident age - Females - American Indian and Alaska Native
Median resident age - Females - Multirace
Median resident age - Females - Other Race
Commute - mean travel time to work (minutes)
Travel time to work - Less than 5 minutes (%)
Travel time to work - Less than 5 minutes (% change since 2000)
Travel time to work - 5 to 9 minutes (%)
Travel time to work - 5 to 9 minutes (% change since 2000)
Travel time to work - 10 to 19 minutes (%)
Travel time to work - 10 to 19 minutes (% change since 2000)
Travel time to work - 20 to 29 minutes (%)
Travel time to work - 20 to 29 minutes (% change since 2000)
Travel time to work - 30 to 39 minutes (%)
Travel time to work - 30 to 39 minutes (% change since 2000)
Travel time to work - 40 to 59 minutes (%)
Travel time to work - 40 to 59 minutes (% change since 2000)
Travel time to work - 60 to 89 minutes (%)
Travel time to work - 60 to 89 minutes (% change since 2000)
Travel time to work - 90 or more minutes (%)
Travel time to work - 90 or more minutes (% change since 2000)
Marital status - Never married (%)
Marital status - Now married (%)
Marital status - Separated (%)
Marital status - Widowed (%)
Marital status - Divorced (%)
Median family income ($)
Median family income (% change since 2000)
Median non-family income ($)
Median non-family income (% change since 2000)
Median per capita income ($)
Median per capita income (% change since 2000)
Median family income ($) - White
Median family income ($) - Black or African American
Median family income ($) - Asian
Median family income ($) - Hispanic or Latino
Median family income ($) - American Indian and Alaska Native
Median family income ($) - Multirace
Median family income ($) - Other Race
Median year house/condo built
Median year apartment built
Year house built - Built 2005 or later (%)
Year house built - Built 2000 to 2004 (%)
Year house built - Built 1990 to 1999 (%)
Year house built - Built 1980 to 1989 (%)
Year house built - Built 1970 to 1979 (%)
Year house built - Built 1960 to 1969 (%)
Year house built - Built 1950 to 1959 (%)
Year house built - Built 1940 to 1949 (%)
Year house built - Built 1939 or earlier (%)
Average household size
Household density (households per square mile)
Average household size - White
Average household size - Black or African American
Average household size - Asian
Average household size - Hispanic or Latino
Average household size - American Indian and Alaska Native
Average household size - Multirace
Average household size - Other Race
Occupied housing units (%)
Vacant housing units (%)
Owner occupied housing units (%)
Renter occupied housing units (%)
Vacancy status - For rent (%)
Vacancy status - For sale only (%)
Vacancy status - Rented or sold, not occupied (%)
Vacancy status - For seasonal, recreational, or occasional use (%)
Vacancy status - For migrant workers (%)
Vacancy status - Other vacant (%)
Residents with income below the poverty level (%)
Residents with income below 50% of the poverty level (%)
Children below poverty level (%)
Poor families by family type - Married-couple family (%)
Poor families by family type - Male, no wife present (%)
Poor families by family type - Female, no husband present (%)
Poverty status for native-born residents (%)
Poverty status for foreign-born residents (%)
Poverty among high school graduates not in families (%)
Poverty among people who did not graduate high school not in families (%)
Residents with income below the poverty level (%) - White
Residents with income below the poverty level (%) - Black or African American
Residents with income below the poverty level (%) - Asian
Residents with income below the poverty level (%) - Hispanic or Latino
Residents with income below the poverty level (%) - American Indian and Alaska Native
Residents with income below the poverty level (%) - Multirace
Residents with income below the poverty level (%) - Other Race
Air pollution - Air Quality Index (AQI)
Air pollution - CO
Air pollution - NO2
Air pollution - SO2
Air pollution - Ozone
Air pollution - PM10
Air pollution - PM25
Air pollution - Pb
Crime - Murders per 100,000 population
Crime - Rapes per 100,000 population
Crime - Robberies per 100,000 population
Crime - Assaults per 100,000 population
Crime - Burglaries per 100,000 population
Crime - Thefts per 100,000 population
Crime - Auto thefts per 100,000 population
Crime - Arson per 100,000 population
Crime - City-data.com crime index
Crime - Violent crime index
Crime - Property crime index
Crime - Murders per 100,000 population (5 year average)
Crime - Rapes per 100,000 population (5 year average)
Crime - Robberies per 100,000 population (5 year average)
Crime - Assaults per 100,000 population (5 year average)
Crime - Burglaries per 100,000 population (5 year average)
Crime - Thefts per 100,000 population (5 year average)
Crime - Auto thefts per 100,000 population (5 year average)
Crime - Arson per 100,000 population (5 year average)
Crime - City-data.com crime index (5 year average)
Crime - Violent crime index (5 year average)
Crime - Property crime index (5 year average)
1996 Presidential Elections Results (%) - Democratic Party (Clinton)
1996 Presidential Elections Results (%) - Republican Party (Dole)
1996 Presidential Elections Results (%) - Other
2000 Presidential Elections Results (%) - Democratic Party (Gore)
2000 Presidential Elections Results (%) - Republican Party (Bush)
2000 Presidential Elections Results (%) - Other
2004 Presidential Elections Results (%) - Democratic Party (Kerry)
2004 Presidential Elections Results (%) - Republican Party (Bush)
2004 Presidential Elections Results (%) - Other
2008 Presidential Elections Results (%) - Democratic Party (Obama)
2008 Presidential Elections Results (%) - Republican Party (McCain)
2008 Presidential Elections Results (%) - Other
2012 Presidential Elections Results (%) - Democratic Party (Obama)
2012 Presidential Elections Results (%) - Republican Party (Romney)
2012 Presidential Elections Results (%) - Other
2016 Presidential Elections Results (%) - Democratic Party (Clinton)
2016 Presidential Elections Results (%) - Republican Party (Trump)
2016 Presidential Elections Results (%) - Other
2020 Presidential Elections Results (%) - Democratic Party (Biden)
2020 Presidential Elections Results (%) - Republican Party (Trump)
2020 Presidential Elections Results (%) - Other
Ancestries Reported - Arab (%)
Ancestries Reported - Czech (%)
Ancestries Reported - Danish (%)
Ancestries Reported - Dutch (%)
Ancestries Reported - English (%)
Ancestries Reported - French (%)
Ancestries Reported - French Canadian (%)
Ancestries Reported - German (%)
Ancestries Reported - Greek (%)
Ancestries Reported - Hungarian (%)
Ancestries Reported - Irish (%)
Ancestries Reported - Italian (%)
Ancestries Reported - Lithuanian (%)
Ancestries Reported - Norwegian (%)
Ancestries Reported - Polish (%)
Ancestries Reported - Portuguese (%)
Ancestries Reported - Russian (%)
Ancestries Reported - Scotch-Irish (%)
Ancestries Reported - Scottish (%)
Ancestries Reported - Slovak (%)
Ancestries Reported - Subsaharan African (%)
Ancestries Reported - Swedish (%)
Ancestries Reported - Swiss (%)
Ancestries Reported - Ukrainian (%)
Ancestries Reported - United States (%)
Ancestries Reported - Welsh (%)
Ancestries Reported - West Indian (%)
Ancestries Reported - Other (%)
Educational Attainment - No schooling completed (%)
Educational Attainment - Less than high school (%)
Educational Attainment - High school or equivalent (%)
Educational Attainment - Less than 1 year of college (%)
Educational Attainment - 1 or more years of college (%)
Educational Attainment - Associate degree (%)
Educational Attainment - Bachelor's degree (%)
Educational Attainment - Master's degree (%)
Educational Attainment - Professional school degree (%)
Educational Attainment - Doctorate degree (%)
School Enrollment - Nursery, preschool (%)
School Enrollment - Kindergarten (%)
School Enrollment - Grade 1 to 4 (%)
School Enrollment - Grade 5 to 8 (%)
School Enrollment - Grade 9 to 12 (%)
School Enrollment - College undergrad (%)
School Enrollment - Graduate or professional (%)
School Enrollment - Not enrolled in school (%)
School enrollment - Public schools (%)
School enrollment - Private schools (%)
School enrollment - Not enrolled (%)
Median number of rooms in houses and condos
Median number of rooms in apartments
Housing units lacking complete plumbing facilities (%)
Housing units lacking complete kitchen facilities (%)
Density of houses
Urban houses (%)
Rural houses (%)
Households with people 60 years and over (%)
Households with people 65 years and over (%)
Households with people 75 years and over (%)
Households with one or more nonrelatives (%)
Households with no nonrelatives (%)
Population in households (%)
Family households (%)
Nonfamily households (%)
Population in families (%)
Family households with own children (%)
Median number of bedrooms in owner occupied houses
Mean number of bedrooms in owner occupied houses
Median number of bedrooms in renter occupied houses
Mean number of bedrooms in renter occupied houses
Median number of vehichles in owner occupied houses
Mean number of vehichles in owner occupied houses
Median number of vehichles in renter occupied houses
Mean number of vehichles in renter occupied houses
Mortgage status - with mortgage (%)
Mortgage status - with second mortgage (%)
Mortgage status - with home equity loan (%)
Mortgage status - with both second mortgage and home equity loan (%)
Mortgage status - without a mortgage (%)
Average family size
Average family size - White
Average family size - Black or African American
Average family size - Asian
Average family size - Hispanic or Latino
Average family size - American Indian and Alaska Native
Average family size - Multirace
Average family size - Other Race
Geographical mobility - Same house 1 year ago (%)
Geographical mobility - Moved within same county (%)
Geographical mobility - Moved from different county within same state (%)
Geographical mobility - Moved from different state (%)
Geographical mobility - Moved from abroad (%)
Place of birth - Born in state of residence (%)
Place of birth - Born in other state (%)
Place of birth - Native, outside of US (%)
Place of birth - Foreign born (%)
Housing units in structures - 1, detached (%)
Housing units in structures - 1, attached (%)
Housing units in structures - 2 (%)
Housing units in structures - 3 or 4 (%)
Housing units in structures - 5 to 9 (%)
Housing units in structures - 10 to 19 (%)
Housing units in structures - 20 to 49 (%)
Housing units in structures - 50 or more (%)
Housing units in structures - Mobile home (%)
Housing units in structures - Boat, RV, van, etc. (%)
House/condo owner moved in on average (years ago)
Renter moved in on average (years ago)
Year householder moved into unit - Moved in 1999 to March 2000 (%)
Year householder moved into unit - Moved in 1995 to 1998 (%)
Year householder moved into unit - Moved in 1990 to 1994 (%)
Year householder moved into unit - Moved in 1980 to 1989 (%)
Year householder moved into unit - Moved in 1970 to 1979 (%)
Year householder moved into unit - Moved in 1969 or earlier (%)
Means of transportation to work - Drove car alone (%)
Means of transportation to work - Carpooled (%)
Means of transportation to work - Public transportation (%)
Means of transportation to work - Bus or trolley bus (%)
Means of transportation to work - Streetcar or trolley car (%)
Means of transportation to work - Subway or elevated (%)
Means of transportation to work - Railroad (%)
Means of transportation to work - Ferryboat (%)
Means of transportation to work - Taxicab (%)
Means of transportation to work - Motorcycle (%)
Means of transportation to work - Bicycle (%)
Means of transportation to work - Walked (%)
Means of transportation to work - Other means (%)
Working at home (%)
Industry diversity
Most Common Industries - Agriculture, forestry, fishing and hunting, and mining (%)
Most Common Industries - Agriculture, forestry, fishing and hunting (%)
Most Common Industries - Mining, quarrying, and oil and gas extraction (%)
Most Common Industries - Construction (%)
Most Common Industries - Manufacturing (%)
Most Common Industries - Wholesale trade (%)
Most Common Industries - Retail trade (%)
Most Common Industries - Transportation and warehousing, and utilities (%)
Most Common Industries - Transportation and warehousing (%)
Most Common Industries - Utilities (%)
Most Common Industries - Information (%)
Most Common Industries - Finance and insurance, and real estate and rental and leasing (%)
Most Common Industries - Finance and insurance (%)
Most Common Industries - Real estate and rental and leasing (%)
Most Common Industries - Professional, scientific, and management, and administrative and waste management services (%)
Most Common Industries - Professional, scientific, and technical services (%)
Most Common Industries - Management of companies and enterprises (%)
Most Common Industries - Administrative and support and waste management services (%)
Most Common Industries - Educational services, and health care and social assistance (%)
Most Common Industries - Educational services (%)
Most Common Industries - Health care and social assistance (%)
Most Common Industries - Arts, entertainment, and recreation, and accommodation and food services (%)
Most Common Industries - Arts, entertainment, and recreation (%)
Most Common Industries - Accommodation and food services (%)
Most Common Industries - Other services, except public administration (%)
Most Common Industries - Public administration (%)
Occupation diversity
Most Common Occupations - Management, business, science, and arts occupations (%)
Most Common Occupations - Management, business, and financial occupations (%)
Most Common Occupations - Management occupations (%)
Most Common Occupations - Business and financial operations occupations (%)
Most Common Occupations - Computer, engineering, and science occupations (%)
Most Common Occupations - Computer and mathematical occupations (%)
Most Common Occupations - Architecture and engineering occupations (%)
Most Common Occupations - Life, physical, and social science occupations (%)
Most Common Occupations - Education, legal, community service, arts, and media occupations (%)
Most Common Occupations - Community and social service occupations (%)
Most Common Occupations - Legal occupations (%)
Most Common Occupations - Education, training, and library occupations (%)
Most Common Occupations - Arts, design, entertainment, sports, and media occupations (%)
Most Common Occupations - Healthcare practitioners and technical occupations (%)
Most Common Occupations - Health diagnosing and treating practitioners and other technical occupations (%)
Most Common Occupations - Health technologists and technicians (%)
Most Common Occupations - Service occupations (%)
Most Common Occupations - Healthcare support occupations (%)
Most Common Occupations - Protective service occupations (%)
Most Common Occupations - Fire fighting and prevention, and other protective service workers including supervisors (%)
Most Common Occupations - Law enforcement workers including supervisors (%)
Most Common Occupations - Food preparation and serving related occupations (%)
Most Common Occupations - Building and grounds cleaning and maintenance occupations (%)
Most Common Occupations - Personal care and service occupations (%)
Most Common Occupations - Sales and office occupations (%)
Most Common Occupations - Sales and related occupations (%)
Most Common Occupations - Office and administrative support occupations (%)
Most Common Occupations - Natural resources, construction, and maintenance occupations (%)
Most Common Occupations - Farming, fishing, and forestry occupations (%)
Most Common Occupations - Construction and extraction occupations (%)
Most Common Occupations - Installation, maintenance, and repair occupations (%)
Most Common Occupations - Production, transportation, and material moving occupations (%)
Most Common Occupations - Production occupations (%)
Most Common Occupations - Transportation occupations (%)
Most Common Occupations - Material moving occupations (%)
People in Group quarters - Institutionalized population (%)
People in Group quarters - Correctional institutions (%)
People in Group quarters - Federal prisons and detention centers (%)
People in Group quarters - Halfway houses (%)
People in Group quarters - Local jails and other confinement facilities (including police lockups) (%)
People in Group quarters - Military disciplinary barracks (%)
People in Group quarters - State prisons (%)
People in Group quarters - Other types of correctional institutions (%)
People in Group quarters - Nursing homes (%)
People in Group quarters - Hospitals/wards, hospices, and schools for the handicapped (%)
People in Group quarters - Hospitals/wards and hospices for chronically ill (%)
People in Group quarters - Hospices or homes for chronically ill (%)
People in Group quarters - Military hospitals or wards for chronically ill (%)
People in Group quarters - Other hospitals or wards for chronically ill (%)
People in Group quarters - Hospitals or wards for drug/alcohol abuse (%)
People in Group quarters - Mental (Psychiatric) hospitals or wards (%)
People in Group quarters - Schools, hospitals, or wards for the mentally retarded (%)
People in Group quarters - Schools, hospitals, or wards for the physically handicapped (%)
People in Group quarters - Institutions for the deaf (%)
People in Group quarters - Institutions for the blind (%)
People in Group quarters - Orthopedic wards and institutions for the physically handicapped (%)
People in Group quarters - Wards in general hospitals for patients who have no usual home elsewhere (%)
People in Group quarters - Wards in military hospitals for patients who have no usual home elsewhere (%)
People in Group quarters - Juvenile institutions (%)
People in Group quarters - Long-term care (%)
People in Group quarters - Homes for abused, dependent, and neglected children (%)
People in Group quarters - Residential treatment centers for emotionally disturbed children (%)
People in Group quarters - Training schools for juvenile delinquents (%)
People in Group quarters - Short-term care, detention or diagnostic centers for delinquent children (%)
People in Group quarters - Type of juvenile institution unknown (%)
People in Group quarters - Noninstitutionalized population (%)
People in Group quarters - College dormitories (includes college quarters off campus) (%)
People in Group quarters - Military quarters (%)
People in Group quarters - On base (%)
People in Group quarters - Barracks, unaccompanied personnel housing (UPH), (Enlisted/Officer), ;and similar group living quarters for military personnel (%)
People in Group quarters - Transient quarters for temporary residents (%)
People in Group quarters - Military ships (%)
People in Group quarters - Group homes (%)
People in Group quarters - Homes or halfway houses for drug/alcohol abuse (%)
People in Group quarters - Homes for the mentally ill (%)
People in Group quarters - Homes for the mentally retarded (%)
People in Group quarters - Homes for the physically handicapped (%)
People in Group quarters - Other group homes (%)
People in Group quarters - Religious group quarters (%)
People in Group quarters - Dormitories (%)
People in Group quarters - Agriculture workers' dormitories on farms (%)
People in Group quarters - Job Corps and vocational training facilities (%)
People in Group quarters - Other workers' dormitories (%)
People in Group quarters - Crews of maritime vessels (%)
People in Group quarters - Other nonhousehold living situations (%)
People in Group quarters - Other noninstitutional group quarters (%)
Residents speaking English at home (%)
Residents speaking English at home - Born in the United States (%)
Residents speaking English at home - Native, born elsewhere (%)
Residents speaking English at home - Foreign born (%)
Residents speaking Spanish at home (%)
Residents speaking Spanish at home - Born in the United States (%)
Residents speaking Spanish at home - Native, born elsewhere (%)
Residents speaking Spanish at home - Foreign born (%)
Residents speaking other language at home (%)
Residents speaking other language at home - Born in the United States (%)
Residents speaking other language at home - Native, born elsewhere (%)
Residents speaking other language at home - Foreign born (%)
Class of Workers - Employee of private company (%)
Class of Workers - Self-employed in own incorporated business (%)
Class of Workers - Private not-for-profit wage and salary workers (%)
Class of Workers - Local government workers (%)
Class of Workers - State government workers (%)
Class of Workers - Federal government workers (%)
Class of Workers - Self-employed workers in own not incorporated business and Unpaid family workers (%)
House heating fuel used in houses and condos - Utility gas (%)
House heating fuel used in houses and condos - Bottled, tank, or LP gas (%)
House heating fuel used in houses and condos - Electricity (%)
House heating fuel used in houses and condos - Fuel oil, kerosene, etc. (%)
House heating fuel used in houses and condos - Coal or coke (%)
House heating fuel used in houses and condos - Wood (%)
House heating fuel used in houses and condos - Solar energy (%)
House heating fuel used in houses and condos - Other fuel (%)
House heating fuel used in houses and condos - No fuel used (%)
House heating fuel used in apartments - Utility gas (%)
House heating fuel used in apartments - Bottled, tank, or LP gas (%)
House heating fuel used in apartments - Electricity (%)
House heating fuel used in apartments - Fuel oil, kerosene, etc. (%)
House heating fuel used in apartments - Coal or coke (%)
House heating fuel used in apartments - Wood (%)
House heating fuel used in apartments - Solar energy (%)
House heating fuel used in apartments - Other fuel (%)
House heating fuel used in apartments - No fuel used (%)
Armed forces status - In Armed Forces (%)
Armed forces status - Civilian (%)
Armed forces status - Civilian - Veteran (%)
Armed forces status - Civilian - Nonveteran (%)
Fatal accidents locations in years 2005-2021
Fatal accidents locations in 2005
Fatal accidents locations in 2006
Fatal accidents locations in 2007
Fatal accidents locations in 2008
Fatal accidents locations in 2009
Fatal accidents locations in 2010
Fatal accidents locations in 2011
Fatal accidents locations in 2012
Fatal accidents locations in 2013
Fatal accidents locations in 2014
Fatal accidents locations in 2015
Fatal accidents locations in 2016
Fatal accidents locations in 2017
Fatal accidents locations in 2018
Fatal accidents locations in 2019
Fatal accidents locations in 2020
Fatal accidents locations in 2021
Alcohol use - People drinking some alcohol every month (%)
Alcohol use - People not drinking at all (%)
Alcohol use - Average days/month drinking alcohol
Alcohol use - Average drinks/week
Alcohol use - Average days/year people drink much
Audiometry - Average condition of hearing (%)
Audiometry - People that can hear a whisper from across a quiet room (%)
Audiometry - People that can hear normal voice from across a quiet room (%)
Audiometry - Ears ringing, roaring, buzzing (%)
Audiometry - Had a job exposure to loud noise (%)
Audiometry - Had off-work exposure to loud noise (%)
Blood Pressure & Cholesterol - Has high blood pressure (%)
Blood Pressure & Cholesterol - Checking blood pressure at home (%)
Blood Pressure & Cholesterol - Frequently checking blood cholesterol (%)
Blood Pressure & Cholesterol - Has high cholesterol level (%)
Consumer Behavior - Money monthly spent on food at supermarket/grocery store
Consumer Behavior - Money monthly spent on food at other stores
Consumer Behavior - Money monthly spent on eating out
Consumer Behavior - Money monthly spent on carryout/delivered foods
Consumer Behavior - Income spent on food at supermarket/grocery store (%)
Consumer Behavior - Income spent on food at other stores (%)
Consumer Behavior - Income spent on eating out (%)
Consumer Behavior - Income spent on carryout/delivered foods (%)
Current Health Status - General health condition (%)
Current Health Status - Blood donors (%)
Current Health Status - Has blood ever tested for HIV virus (%)
Current Health Status - Left-handed people (%)
Dermatology - People using sunscreen (%)
Diabetes - Diabetics (%)
Diabetes - Had a blood test for high blood sugar (%)
Diabetes - People taking insulin (%)
Diet Behavior & Nutrition - Diet health (%)
Diet Behavior & Nutrition - Milk product consumption (# of products/month)
Diet Behavior & Nutrition - Meals not home prepared (#/week)
Diet Behavior & Nutrition - Meals from fast food or pizza place (#/week)
Diet Behavior & Nutrition - Ready-to-eat foods (#/month)
Diet Behavior & Nutrition - Frozen meals/pizza (#/month)
Drug Use - People that ever used marijuana or hashish (%)
Drug Use - Ever used hard drugs (%)
Drug Use - Ever used any form of cocaine (%)
Drug Use - Ever used heroin (%)
Drug Use - Ever used methamphetamine (%)
Health Insurance - People covered by health insurance (%)
Kidney Conditions-Urology - Avg. # of times urinating at night
Medical Conditions - People with asthma (%)
Medical Conditions - People with anemia (%)
Medical Conditions - People with psoriasis (%)
Medical Conditions - People with overweight (%)
Medical Conditions - Elderly people having difficulties in thinking or remembering (%)
Medical Conditions - People who ever received blood transfusion (%)
Medical Conditions - People having trouble seeing even with glass/contacts (%)
Medical Conditions - People with arthritis (%)
Medical Conditions - People with gout (%)
Medical Conditions - People with congestive heart failure (%)
Medical Conditions - People with coronary heart disease (%)
Medical Conditions - People with angina pectoris (%)
Medical Conditions - People who ever had heart attack (%)
Medical Conditions - People who ever had stroke (%)
Medical Conditions - People with emphysema (%)
Medical Conditions - People with thyroid problem (%)
Medical Conditions - People with chronic bronchitis (%)
Medical Conditions - People with any liver condition (%)
Medical Conditions - People who ever had cancer or malignancy (%)
Mental Health - People who have little interest in doing things (%)
Mental Health - People feeling down, depressed, or hopeless (%)
Mental Health - People who have trouble sleeping or sleeping too much (%)
Mental Health - People feeling tired or having little energy (%)
Mental Health - People with poor appetite or overeating (%)
Mental Health - People feeling bad about themself (%)
Mental Health - People who have trouble concentrating on things (%)
Mental Health - People moving or speaking slowly or too fast (%)
Mental Health - People having thoughts they would be better off dead (%)
Oral Health - Average years since last visit a dentist
Oral Health - People embarrassed because of mouth (%)
Oral Health - People with gum disease (%)
Oral Health - General health of teeth and gums (%)
Oral Health - Average days a week using dental floss/device
Oral Health - Average days a week using mouthwash for dental problem
Oral Health - Average number of teeth
Pesticide Use - Households using pesticides to control insects (%)
Pesticide Use - Households using pesticides to kill weeds (%)
Physical Activity - People doing vigorous-intensity work activities (%)
Physical Activity - People doing moderate-intensity work activities (%)
Physical Activity - People walking or bicycling (%)
Physical Activity - People doing vigorous-intensity recreational activities (%)
Physical Activity - People doing moderate-intensity recreational activities (%)
Physical Activity - Average hours a day doing sedentary activities
Physical Activity - Average hours a day watching TV or videos
Physical Activity - Average hours a day using computer
Physical Functioning - People having limitations keeping them from working (%)
Physical Functioning - People limited in amount of work they can do (%)
Physical Functioning - People that need special equipment to walk (%)
Physical Functioning - People experiencing confusion/memory problems (%)
Physical Functioning - People requiring special healthcare equipment (%)
Prescription Medications - Average number of prescription medicines taking
Preventive Aspirin Use - Adults 40+ taking low-dose aspirin (%)
Reproductive Health - Vaginal deliveries (%)
Reproductive Health - Cesarean deliveries (%)
Reproductive Health - Deliveries resulted in a live birth (%)
Reproductive Health - Pregnancies resulted in a delivery (%)
Reproductive Health - Women breastfeeding newborns (%)
Reproductive Health - Women that had a hysterectomy (%)
Reproductive Health - Women that had both ovaries removed (%)
Reproductive Health - Women that have ever taken birth control pills (%)
Reproductive Health - Women taking birth control pills (%)
Reproductive Health - Women that have ever used Depo-Provera or injectables (%)
Reproductive Health - Women that have ever used female hormones (%)
Sexual Behavior - People 18+ that ever had sex (vaginal, anal, or oral) (%)
Sexual Behavior - Males 18+ that ever had vaginal sex with a woman (%)
Sexual Behavior - Males 18+ that ever performed oral sex on a woman (%)
Sexual Behavior - Males 18+ that ever had anal sex with a woman (%)
Sexual Behavior - Males 18+ that ever had any sex with a man (%)
Sexual Behavior - Females 18+ that ever had vaginal sex with a man (%)
Sexual Behavior - Females 18+ that ever performed oral sex on a man (%)
Sexual Behavior - Females 18+ that ever had anal sex with a man (%)
Sexual Behavior - Females 18+ that ever had any kind of sex with a woman (%)
Sexual Behavior - Average age people first had sex
Sexual Behavior - Average number of female sex partners in lifetime (males 18+)
Sexual Behavior - Average number of female vaginal sex partners in lifetime (males 18+)
Sexual Behavior - Average age people first performed oral sex on a woman (18+)
Sexual Behavior - Average number of woman performed oral sex on in lifetime (18+)
Sexual Behavior - Average number of male sex partners in lifetime (males 18+)
Sexual Behavior - Average number of male anal sex partners in lifetime (males 18+)
Sexual Behavior - Average age people first performed oral sex on a man (18+)
Sexual Behavior - Average number of male oral sex partners in lifetime (18+)
Sexual Behavior - People using protection when performing oral sex (%)
Sexual Behavior - Average number of times people have vaginal or anal sex a year
Sexual Behavior - People having sex without condom (%)
Sexual Behavior - Average number of male sex partners in lifetime (females 18+)
Sexual Behavior - Average number of male vaginal sex partners in lifetime (females 18+)
Sexual Behavior - Average number of female sex partners in lifetime (females 18+)
Sexual Behavior - Circumcised males 18+ (%)
Sleep Disorders - Average hours sleeping at night
Sleep Disorders - People that has trouble sleeping (%)
Smoking-Cigarette Use - People smoking cigarettes (%)
Taste & Smell - People 40+ having problems with smell (%)
Taste & Smell - People 40+ having problems with taste (%)
Taste & Smell - People 40+ that ever had wisdom teeth removed (%)
Taste & Smell - People 40+ that ever had tonsils teeth removed (%)
Taste & Smell - People 40+ that ever had a loss of consciousness because of a head injury (%)
Taste & Smell - People 40+ that ever had a broken nose or other serious injury to face or skull (%)
Taste & Smell - People 40+ that ever had two or more sinus infections (%)
Weight - Average height (inches)
Weight - Average weight (pounds)
Weight - Average BMI
Weight - People that are obese (%)
Weight - People that ever were obese (%)
Weight - People trying to lose weight (%)
Urban population: 9,769
Rural population: 25,659
Estimated median house/condo value in 2022: $631,095
92596:
$631,095California:
$715,900
According to our research of California and other state lists, there were 25 registered sex offenders living in 92596 zip code as of May 28, 2024 . The ratio of all residents to sex offenders in zip code 92596 is 1,029 to 1.The ratio of registered sex offenders to all residents in this zip code is lower than the state average.
Median resident age: This zip code:
34.2 yearsCalifornia median age:
37.9 years
Average household size: This zip code:
3.7 peopleCalifornia:
2.8 people
Averages for the 2020 tax year for zip code 92596, filed in 2021:
Average Adjusted Gross Income (AGI) in 2020: $74,341 (Individual Income Tax Returns) Here:
$74,341State:
$95,910
Salary/wage: $69,354 (reported on 85.0% of returns )Here:
$69,354State:
$77,331
(% of AGI for various income ranges: 1156.3% for AGIs below $25k , 3584.7% for AGIs $25k-50k , 6641.2% for AGIs $50k-75k , 9891.7% for AGIs $75k-100k , 20612.6% for AGIs $100k-200k , 61131.2% for AGIs over 200k ) Taxable interest for individuals: $415 (reported on 41.0% of returns )This zip code:
$415California:
$2,294
(% of AGI for various income ranges: 10.2% for AGIs below $25k , 16.2% for AGIs $25k-50k , 17.3% for AGIs $50k-75k , 37.5% for AGIs $75k-100k , 44.3% for AGIs $100k-200k , 131.2% for AGIs over 200k ) Ordinary dividends: $2,141 (reported on 11.4% of returns )(% of AGI for various income ranges: 13.6% for AGIs below $25k , 18.7% for AGIs $25k-50k , 36.5% for AGIs $50k-75k , 36.3% for AGIs $75k-100k , 59.9% for AGIs $100k-200k , 281.7% for AGIs over 200k ) Net capital gain/loss in AGI: +$9,339 (reported on 13.1% of returns )Here:
+$9,339State:
+$49,306
(% of AGI for various income ranges: 6.9% for AGIs below $25k , 14.6% for AGIs $25k-50k , 39.5% for AGIs $50k-75k , 74.5% for AGIs $75k-100k , 198.4% for AGIs $100k-200k , 5009.6% for AGIs over 200k ) Profit/loss from business: +$8,470 (reported on 17.8% of returns )Here:
+$8,470State:
+$15,671
(% of AGI for various income ranges: 94.6% for AGIs below $25k , 173.8% for AGIs $25k-50k , 142.3% for AGIs $50k-75k , 263.7% for AGIs $75k-100k , 363.0% for AGIs $100k-200k , 1433.8% for AGIs over 200k ) Taxable individual retirement arrangement distribution: $18,621 (reported on 5.0% of returns )92596:
$18,621California:
$23,505
(% of AGI for various income ranges: 35.2% for AGIs below $25k , 70.5% for AGIs $25k-50k , 98.4% for AGIs $50k-75k , 166.9% for AGIs $75k-100k , 262.8% for AGIs $100k-200k , 1095.8% for AGIs over 200k ) Self-employed (Keogh) retirement plans: $15,200 (reported on 0.3% of returns )92596:
$15,200California:
$30,163
(% of AGI for various income ranges: 32.9% for AGIs $100k-200k ) Total itemized deductions: $30,588 (reported on 21.2% of returns )Here:
$30,588State:
$39,517
(% of AGI for various income ranges: 98.4% for AGIs below $25k , 248.1% for AGIs $25k-50k , 801.7% for AGIs $50k-75k , 1343.1% for AGIs $75k-100k , 2320.8% for AGIs $100k-200k , 6287.5% for AGIs over 200k ) Charity contributions: $5,420 (reported on 17.1% of returns )(% of AGI for various income ranges: 5.1% for AGIs below $25k , 18.9% for AGIs $25k-50k , 75.0% for AGIs $50k-75k , 150.3% for AGIs $75k-100k , 347.0% for AGIs $100k-200k , 1485.4% for AGIs over 200k ) Taxes paid: $8,897 (reported on 21.2% of returns )(% of AGI for various income ranges: 24.8% for AGIs below $25k , 65.3% for AGIs $25k-50k , 231.5% for AGIs $50k-75k , 413.1% for AGIs $75k-100k , 710.1% for AGIs $100k-200k , 1568.3% for AGIs over 200k ) Earned income credit: $2,146 (reported on 12.2% of returns )(% of AGI for various income ranges: 75.3% for AGIs below $25k , 75.8% for AGIs $25k-50k , 2.5% for AGIs $50k-75k ) Percentage of individuals using paid preparers for their 2020 taxes: 94.5%(% for various income ranges: 93.2% for AGIs below $25k , 95.2% for AGIs $25k-50k , 95.0% for AGIs $50k-75k , 94.1% for AGIs $75k-100k , 95.2% for AGIs $100k-200k , 95.7% for AGIs over 200k )
Averages for the 2012 tax year for zip code 92596, filed in 2013:
Average Adjusted Gross Income (AGI) in 2012: $60,018 (Individual Income Tax Returns) Here:
$60,018State:
$72,726
Salary/wage: $56,824 (reported on 86.4% of returns )Here:
$56,824State:
$59,079
(% of AGI for various income ranges: 74.5% for AGIs below $25k , 80.0% for AGIs $25k-50k , 83.2% for AGIs $50k-75k , 85.0% for AGIs $75k-100k , 86.1% for AGIs $100k-200k , 60.6% for AGIs over 200k ) Taxable interest for individuals: $403 (reported on 39.6% of returns )This zip code:
$403California:
$2,146
(% of AGI for various income ranges: 1.1% for AGIs below $25k , 0.3% for AGIs $25k-50k , 0.3% for AGIs $50k-75k , 0.2% for AGIs $75k-100k , 0.1% for AGIs $100k-200k , 0.2% for AGIs over 200k ) Ordinary dividends: $2,031 (reported on 10.8% of returns )(% of AGI for various income ranges: 1.2% for AGIs below $25k , 0.4% for AGIs $25k-50k , 0.4% for AGIs $50k-75k , 0.2% for AGIs $75k-100k , 0.3% for AGIs $100k-200k , 0.2% for AGIs over 200k ) Net capital gain/loss in AGI: +$4,514 (reported on 9.4% of returns )Here:
+$4,514State:
+$30,460
(% of AGI for various income ranges: 0.1% for AGIs $50k-75k , 0.2% for AGIs $75k-100k , 0.4% for AGIs $100k-200k , 6.7% for AGIs over 200k ) Profit/loss from business: +$9,307 (reported on 18.4% of returns )Here:
+$9,307State:
+$17,064
(% of AGI for various income ranges: 11.9% for AGIs below $25k , 4.8% for AGIs $25k-50k , 1.9% for AGIs $50k-75k , 1.2% for AGIs $75k-100k , 1.7% for AGIs $100k-200k , 3.3% for AGIs over 200k ) Taxable individual retirement arrangement distribution: $16,277 (reported on 6.0% of returns )92596:
$16,277California:
$19,557
(% of AGI for various income ranges: 1.9% for AGIs below $25k , 1.7% for AGIs $25k-50k , 1.8% for AGIs $50k-75k , 1.7% for AGIs $75k-100k , 1.7% for AGIs $100k-200k ) Total itemized deductions: $25,333 (29% of AGI, reported on 50.4% of returns )Here:
$25,333State:
$34,004
Here:
28.9% of AGIState:
22.7% of AGI
(% of AGI for various income ranges: 18.6% for AGIs below $25k , 19.8% for AGIs $25k-50k , 22.5% for AGIs $50k-75k , 22.5% for AGIs $75k-100k , 21.6% for AGIs $100k-200k , 18.8% for AGIs over 200k ) Charity contributions: $2,559 (reported on 40.3% of returns )(% of AGI for various income ranges: 0.9% for AGIs below $25k , 1.3% for AGIs $25k-50k , 1.7% for AGIs $50k-75k , 1.8% for AGIs $75k-100k , 2.0% for AGIs $100k-200k , 1.7% for AGIs over 200k ) Taxes paid: $8,117 (reported on 50.2% of returns )92596:
$8,117State:
$14,448
(% of AGI for various income ranges: 4.3% for AGIs below $25k , 5.3% for AGIs $25k-50k , 6.4% for AGIs $50k-75k , 6.9% for AGIs $75k-100k , 7.6% for AGIs $100k-200k , 8.2% for AGIs over 200k ) Earned income credit: $2,388 (reported on 17.4% of returns )(% of AGI for various income ranges: 7.1% for AGIs below $25k , 1.8% for AGIs $25k-50k ) Percentage of individuals using paid preparers for their 2012 taxes: 60.3%(% for various income ranges: 54.3% for AGIs below $25k , 58.9% for AGIs $25k-50k , 62.4% for AGIs $50k-75k , 64.3% for AGIs $75k-100k , 66.4% for AGIs $100k-200k , 73.3% for AGIs over 200k )
Averages for the 2004 tax year for zip code 92596, filed in 2005:
Average Adjusted Gross Income (AGI) in 2004: $53,785 (Individual Income Tax Returns) Here:
$53,785State:
$58,600
Salary/wage: $50,219 (reported on 89.2% of returns )Here:
$50,219State:
$49,455
(% of AGI for various income ranges: 154.4% for AGIs below $10k , 78.1% for AGIs $10k-25k , 84.0% for AGIs $25k-50k , 88.6% for AGIs $50k-75k , 90.4% for AGIs $75k-100k , 73.7% for AGIs over 100k ) Taxable interest for individuals: $704 (reported on 50.9% of returns )This zip code:
$704California:
$2,365
(% of AGI for various income ranges: 4.8% for AGIs below $10k , 1.4% for AGIs $10k-25k , 0.7% for AGIs $25k-50k , 0.7% for AGIs $50k-75k , 0.4% for AGIs $75k-100k , 0.6% for AGIs over 100k ) Taxable dividends: $1,246 (reported on 13.5% of returns )(% of AGI for various income ranges: 2.1% for AGIs below $10k , 0.4% for AGIs $10k-25k , 0.3% for AGIs $25k-50k , 0.2% for AGIs $50k-75k , 0.1% for AGIs $75k-100k , 0.5% for AGIs over 100k ) Net capital gain/loss: +$17,046 (reported on 14.3% of returns )Here:
+$17,046State:
+$23,418
(% of AGI for various income ranges: -1.8% for AGIs below $10k , -0.4% for AGIs $10k-25k , 0.5% for AGIs $25k-50k , 0.8% for AGIs $50k-75k , 1.1% for AGIs $75k-100k , 12.2% for AGIs over 100k ) Profit/loss from business: +$8,692 (reported on 19.5% of returns )Here:
+$8,692State:
+$16,826
(% of AGI for various income ranges: -6.5% for AGIs below $10k , 9.8% for AGIs $10k-25k , 6.3% for AGIs $25k-50k , 1.7% for AGIs $50k-75k , 2.3% for AGIs $75k-100k , 2.3% for AGIs over 100k ) IRA payment deduction: $2,698 (reported on 2.3% of returns )92596:
$2,698California:
$3,192
(% of AGI for various income ranges: 0.1% for AGIs $10k-25k , 0.2% for AGIs $25k-50k , 0.1% for AGIs $50k-75k , 0.1% for AGIs $75k-100k , 0.1% for AGIs over 100k ) Self-employed pension: $12,185 (reported on 0.5% of returns )Here:
$12,185California:
$17,688
Total itemized deductions: $25,749 (34% of AGI, reported on 59.3% of returns )Here:
$25,749State:
$28,113
Here:
34.1% of AGIState:
25.3% of AGI
(% of AGI for various income ranges: 48.3% for AGIs below $10k , 22.8% for AGIs $10k-25k , 31.9% for AGIs $25k-50k , 32.6% for AGIs $50k-75k , 30.2% for AGIs $75k-100k , 23.2% for AGIs over 100k ) Charity contributions deductions: $2,234 (3% of AGI, reported on 51.6% of returns )Here:
2.8% of AGIState:
3.3% of AGI
(% of AGI for various income ranges: 1.9% for AGIs below $10k , 1.5% for AGIs $10k-25k , 2.2% for AGIs $25k-50k , 2.3% for AGIs $50k-75k , 2.2% for AGIs $75k-100k , 2.0% for AGIs over 100k ) Total tax: $5,913 (reported on 75.8% of returns )92596:
$5,913State:
$10,761
(% of AGI for various income ranges: 5.9% for AGIs below $10k , 4.4% for AGIs $10k-25k , 4.9% for AGIs $25k-50k , 5.7% for AGIs $50k-75k , 7.2% for AGIs $75k-100k , 13.2% for AGIs over 100k ) Earned income credit: $1,752 (reported on 13.2% of returns )Percentage of individuals using paid preparers for their 2004 taxes: 67.6%(% for various income ranges: 55.4% for AGIs below $10k , 64.5% for AGIs $10k-25k , 70.4% for AGIs $25k-50k , 71.1% for AGIs $50k-75k , 69.2% for AGIs $75k-100k , 73.5% for AGIs over 100k )
Estimated median household income in 2022: This zip code:
$114,101California:
$91,551
Nearest zip codes: 92545 ,
92543 ,
92548 ,
92584 ,
92563 ,
92591 .
Winchester Zip Code Map
Percentage of family households: This zip code:
63.2%California:
46.8%
Percentage of households with unmarried partners: This zip code:
4.1%California:
48.1%
Likely homosexual households (counted as self-reported same-sex unmarried-partner households)
Lesbian couples: 0.1% of all households Gay men: 0.0% of all households
Household received Food Stamps/SNAP in the past 12 months: 711Household did not receive Food Stamps/SNAP in the past 12 months: 8,762
Women who had a birth in the past 12 months: 417 (277 now married , 140 unmarried) Women who did not have a birth in the past 12 months: 7,945 (4,022 now married , 3,887 unmarried)
Housing units in zip code 92596 with a mortgage: 6,404 (430
second mortgage , 264
both second mortgage and home equity loan )
Median monthly owner costs for units with a mortgage: $2,879
Median monthly owner costs for units without a mortgage: $846
Residents with income below the poverty level in 2022:
This zip code:
7.6%Whole state:
12.2%
Residents with income below 50% of the poverty level in 2022:
This zip code:
4.2%Whole state:
6.2%
Median number of rooms in houses and condos: Median number of rooms in apartments:
Year house built (houses)
708 2020 or later3,089 2010 to 20195,515 2000 to 2009602 1990 to 1999577 1980 to 1989210 1970 to 197937 1960 to 196972 1950 to 19594 1940 to 194922 1939 or earlier
Zip code 92596 household income distribution in 2022 225 Less than $10,00051 $10,000 to $14,999211 $15,000 to $19,99924 $20,000 to $24,99968 $25,000 to $29,99993 $30,000 to $34,99971 $35,000 to $39,999179 $40,000 to $44,999148 $45,000 to $49,999427 $50,000 to $59,999882 $60,000 to $74,9991,490 $75,000 to $99,9991,731 $100,000 to $124,9991,024 $125,000 to $149,9991,483 $150,000 to $199,9991,461 $200,000 or moreEstimate of home value of owner-occupied houses/condos in 2022 in zip code 92596 93 Less than $10,00015 $10,000 to $14,9992 $15,000 to $19,99924 $40,000 to $49,99915 $60,000 to $69,99911 $70,000 to $79,99990 $150,000 to $174,99926 $175,000 to $199,99978 $200,000 to $249,99922 $250,000 to $299,999154 $300,000 to $399,9991,658 $400,000 to $499,9994,302 $500,000 to $749,999726 $750,000 to $999,999140 $1,000,000 to $1,499,99911 $1,500,000 to $1,999,999294 $2,000,000 or moreRent paid by renters in 2022 in zip code 92596 31 $550 to $59920 $600 to $64913 $900 to $99924 $1,000 to $1,24979 $1,250 to $1,499713 $1,500 to $1,999400 $2,000 to $2,499382 $2,500 to $2,99929 $3,000 to $3,49953 $3,500 or more11 No cash rent
Median gross rent in 2022: $2,361.
Median price asked for vacant for-sale houses and condos in 2022: $451,699.
Estimated median house (or condo) value in 2022 for: White Non-Hispanic householders: $680,215Asian householders: $638,561Native Hawaiian and other Pacific Islander householders: $638,561Some other race householders: $919,921Two or more races householders: $638,561Hispanic or Latino householders: $706,936Estimated median house or condo value in 2022: $631,095
92596:
$631,095California:
$715,900
Lower value quartile - upper value quartile: $521,673 - $758,115
Mean price in 2022: Detached houses: $631,165Here:
$631,165State:
$988,808
Townhouses or other attached units: $625,082Here:
$625,082State:
$838,546
In 2-unit structures: $464,831Here:
$464,831State:
$1,138,100
In 3-to-4-unit structures: $482,529Here:
$482,529State:
$824,253
In 5-or-more-unit structures: $526,423Here:
$526,423State:
$730,996
Mobile homes: $178,284Here:
$178,284State:
$184,506
Occupied boats, RVs, vans, etc.: $86,227Here:
$86,227State:
$204,957
Housing units in structures:
One, detached: 9,005One, attached: 2153 or 4: 745 to 9: 8410 to 19: 9820 to 49: 18450 or more: 7Mobile homes: 390Boats, RVs, vans, etc.: 7Unemployment : 6.0%
Means of transportation to work in zip code 92596 67.4% 9,864 Drove a car alone14.6% 2,132 Carpooled0.3% 50 Bus or trolley bus0.1% 21 Motorcycle0.1% 18 Bicycle1.1% 164 Walked0.4% 60 Other means16.6% 2,434 Worked at homeTravel time to work (commute) in zip code 92596 73 Less than 5 minutes393 5 to 9 minutes861 10 to 14 minutes1,553 15 to 19 minutes1,476 20 to 24 minutes875 25 to 29 minutes1,306 30 to 34 minutes247 35 to 39 minutes235 40 to 44 minutes1,702 45 to 59 minutes1,928 60 to 89 minutes1,522 90 or more minutes
Percentage of zip code residents living and working in this county: 74.1%
Household type by relationship:
Households: 35,429
Male householders: 4,863 (443 living alone ), Female householders: 4,721 (218 living alone )6,253 spouses (6,214 opposite-sex spouses ), 915 unmarried partners , (915 opposite-sex unmarried partners ), 13,587 children (12,560 natural , 449 adopted , 576 stepchildren ), 658 grandchildren , 667 brothers or sisters , 1,443 parents , 0 foster children , 977 other relatives , 1,187 non-relatives In group quarters: 11 (-1 institutionalized population )
Size of family households: 2,331 2-persons , 1,232 3-persons , 2,104 4-persons , 1,386 5-persons , 554 6-persons , 546 7-or-more-persons
Size of nonfamily households: 657 1-person , 411 2-persons , 149 3-persons , 18 4-persons , 88 5-persons
7,339 married couples with children. single-parent households (892 men , 1,910 women ).
74.7% of residents of 92596 zip code speak English at home. of residents speak Spanish at home (68% very well, 14% well, 15% not well, 4% not at all ).of residents speak other Indo-European language at home (39% very well, 53% well, 9% not at all ).of residents speak Asian or Pacific Island language at home (56% very well, 30% well, 12% not well, 2% not at all ).of residents speak other language at home (78% very well, 22% well ).
Foreign born population: 5,005 (14.1%)
(63.4%
of them are naturalized citizens )
This zip code:
14.1%Whole state:
26.7%
42% Honduras 16% Malaysia 7% Thailand 5% Indonesia 3% Sweden 2% United Kingdom, excluding England and Scotland 2% Liberia 6% English 4% Irish 4% American 4% European 3% German 2% Italian 1% Scotch-Irish
Year of entry for the foreign-born population
1,109 2010 or later 1,620 2000 to 2009 682 1990 to 1999 2,463 Before 1990
Facilities with environmental interests located in this zip code:
METROPOLITAN WATER DIST OF STHRN CAL (33740 BOREL RD in WINCHESTER, CA)
STATE MASTER (California - Hazardous Waste Tracking) - HAZARDOU WASTE PROGRAM HAZARDOUS WASTE BIENNIAL REPORTER (Resource Conservation and Recovery Act (tracking hazardous waste)) Large Quantity Generators, more that 1000 kg of hazardous waste/month (Resource Conservation and Recovery Act (tracking hazardous waste)) Organizations: KEVIN CARR (CONTACT/OPERATOR)
, METROPOLITAN WATER DIST. OF SO. CALIF. (CONTACT/OWNER)
Alternative names: LAKE SKINEER FILTRATION PLANT, ROBERT A SKINNER FILTRATION PLANT
MARLYN MILLS SUBDIVISON (1501 BROOKDALE COURT in WINCHESTER, CA)
National Pollutant Discharge Elimination System NON-MAJOR (Tracking pollutant discharge elimination systems) - permit Business SIC classification: GENERAL CONTRACTORS-SINGLE-FAMILY HOUSESAlternative names: RICHMOND AMERICAN HOMES OF VA
GREEN CHEMICAL (206 WYCK STREET in WINCHESTER, CA)
COMPLIANCE ACTIVITY (Tracking inspections of insecticide, fungicide, and rodenticide, and toxic substances)
Housing units lacking complete plumbing facilities: 0.8%
Housing units lacking complete kitchen facilities: 1.6%
69.3% Utility gas 17.7% Electricity 5.7% Bottled, tank, or LP gas 5.6% Solar energy 0.9% Other fuel
Population in 1990: 1,195. Population change in the 1990s: +2,885 (+241.4%).
Place of birth for U.S.-born residents:
This state: 22,947Northeast: 1,367Midwest: 1,785South: 1,694West: 1,641
40% of the 92596 zip code residents lived in the same house 5 years ago.
Out of people who lived in different houses, 51% lived in this county.
Out of people who lived in different counties, 50% lived in California.
87% of the 92596 zip code residents lived in the same house 1 year ago.
Out of people who lived in different houses, 56% moved from this county.
Out of people who lived in different houses, 30% moved from different county within same state.
Out of people who lived in different houses, 10% moved from different state.
Out of people who lived in different houses, 2% moved from abroad.
Private vs. public school enrollment:
Students in private schools in grades 1 to 8 (elementary and middle school): 653
Here:
12.2%California:
10.5%
Students in private schools in grades 9 to 12 (high school): 155
Students in private undergraduate colleges: 453
Here:
29.2%California:
15.9%
Occupation by median earnings in the past 12 months ($)
164,060 Fire fighting and prevention, and other protective service workers including supervisors 133,477 Computer and mathematical occupations 96,816 Law enforcement workers including supervisors 84,608 Architecture and engineering occupations 84,471 Health diagnosing and treating practitioners and other technical occupations 82,433 Education, training, and library occupations
Top industries in this zip code by the number of employees in 2005:
Administrative and Support and Waste Management and Remediation Services: Landscaping Services (50-99 employees: 1 establishment, 1-4 employees: 4 establishments)Health Care and Social Assistance: Other Individual and Family Services (50-99: 1)Accommodation and Food Services: Full-Service Restaurants (20-49: 1, 5-9: 1, 1-4: 1)Educational Services: Elementary and Secondary Schools (20-49: 1)Accommodation and Food Services: Limited-Service Restaurants (10-19: 1, 1-4: 1)Professional, Scientific, and Technical Services: Other Accounting Services (10-19: 1, 1-4: 1)Construction: Electrical Contractors (10-19: 1, 1-4: 1)Health Care and Social Assistance: Home Health Care Services (10-19: 1)Construction: Plumbing, Heating, and Air-Conditioning Contractors (5-9: 1, 1-4: 3)
People in group quarters in 2010:
5 people in group homes intended for adults
3 people in group homes for juveniles (non-correctional)
Fatal accident statistics in 2014:
Fatal accident count: 3Vehicles involved in fatal accidents: 6Fatal accidents caused by drunken drivers: 1Fatalities: 3Persons involved in fatal accidents: 7Pedestrians involved in fatal accidents: 0
Fatal accident statistics in 2013:
Fatal accident count: 2Vehicles involved in fatal accidents: 4Fatal accidents caused by drunken drivers: 1Fatalities: 2Persons involved in fatal accidents: 5Pedestrians involved in fatal accidents: 0
Home Mortgage Disclosure Act Aggregated Statistics For Year 2009(Based on 10 partial tracts) A) FHA, FSA/RHS & VA B) Conventional C) Refinancings D) Home Improvement Loans F) Non-occupant Loans on G) Loans On Manufactured Number Average Value Number Average Value Number Average Value Number Average Value Number Average Value Number Average Value
LOANS ORIGINATED 1,441 $226,264 618 $180,742 852 $241,875 31 $83,740 256 $160,285 35 $204,198 APPLICATIONS APPROVED, NOT ACCEPTED 117 $226,529 86 $194,988 134 $253,662 7 $141,174 34 $188,806 7 $167,786 APPLICATIONS DENIED 293 $235,035 143 $198,414 404 $258,353 35 $46,577 80 $182,887 29 $177,353 APPLICATIONS WITHDRAWN 179 $233,843 96 $187,611 268 $255,505 11 $96,248 42 $182,672 10 $251,545 FILES CLOSED FOR INCOMPLETENESS 48 $221,858 29 $209,028 68 $259,144 6 $121,015 13 $167,512 3 $75,687
Aggregated Statistics For Year 2008(Based on 10 partial tracts) A) FHA, FSA/RHS & VA B) Conventional C) Refinancings D) Home Improvement Loans F) Non-occupant Loans on G) Loans On Manufactured Number Average Value Number Average Value Number Average Value Number Average Value Number Average Value Number Average Value
LOANS ORIGINATED 1,112 $272,345 934 $228,089 417 $258,162 60 $81,663 237 $196,516 46 $222,376 APPLICATIONS APPROVED, NOT ACCEPTED 101 $277,254 218 $236,258 142 $294,597 20 $85,480 59 $214,346 16 $204,673 APPLICATIONS DENIED 258 $287,018 320 $270,446 707 $307,678 128 $112,264 128 $244,664 58 $233,274 APPLICATIONS WITHDRAWN 168 $268,565 231 $233,348 235 $294,566 15 $129,567 60 $215,550 12 $249,402 FILES CLOSED FOR INCOMPLETENESS 29 $278,189 42 $305,043 62 $313,331 5 $110,282 14 $245,170 1 $318,340
Aggregated Statistics For Year 2007(Based on 10 partial tracts) A) FHA, FSA/RHS & VA B) Conventional C) Refinancings D) Home Improvement Loans F) Non-occupant Loans on G) Loans On Manufactured Number Average Value Number Average Value Number Average Value Number Average Value Number Average Value Number Average Value
LOANS ORIGINATED 114 $324,722 1,993 $279,392 1,892 $300,173 273 $158,115 267 $291,131 103 $227,228 APPLICATIONS APPROVED, NOT ACCEPTED 9 $321,248 636 $265,189 610 $309,094 91 $136,524 69 $293,459 32 $198,272 APPLICATIONS DENIED 28 $324,334 919 $331,520 2,159 $342,209 347 $174,856 185 $325,864 76 $252,209 APPLICATIONS WITHDRAWN 10 $354,329 590 $280,949 818 $324,097 61 $191,523 76 $292,949 19 $231,703 FILES CLOSED FOR INCOMPLETENESS 3 $293,613 111 $325,582 286 $372,644 14 $134,984 24 $312,672 5 $238,002
Aggregated Statistics For Year 2006(Based on 10 partial tracts) A) FHA, FSA/RHS & VA B) Conventional C) Refinancings D) Home Improvement Loans F) Non-occupant Loans on G) Loans On Manufactured Number Average Value Number Average Value Number Average Value Number Average Value Number Average Value Number Average Value
LOANS ORIGINATED 17 $304,210 4,449 $263,189 3,305 $295,537 434 $153,298 512 $270,050 91 $235,119 APPLICATIONS APPROVED, NOT ACCEPTED 2 $307,530 1,046 $262,374 782 $305,987 124 $140,518 137 $271,348 25 $202,435 APPLICATIONS DENIED 5 $355,936 1,425 $281,014 2,268 $324,147 412 $158,561 234 $312,900 84 $240,649 APPLICATIONS WITHDRAWN 4 $313,550 1,324 $276,029 1,468 $327,992 119 $158,579 148 $279,360 26 $249,282 FILES CLOSED FOR INCOMPLETENESS 2 $255,705 244 $259,861 335 $324,426 25 $182,932 24 $279,767 9 $224,761
Aggregated Statistics For Year 2005(Based on 10 partial tracts) A) FHA, FSA/RHS & VA B) Conventional C) Refinancings D) Home Improvement Loans E) Loans on Dwellings For 5+ Families F) Non-occupant Loans on G) Loans On Manufactured Number Average Value Number Average Value Number Average Value Number Average Value Number Average Value Number Average Value Number Average Value
LOANS ORIGINATED 17 $273,277 5,671 $253,876 3,368 $301,201 483 $169,267 0 $0 628 $265,523 144 $236,894 APPLICATIONS APPROVED, NOT ACCEPTED 4 $265,178 1,349 $250,791 642 $295,127 99 $128,934 0 $0 132 $262,781 39 $193,206 APPLICATIONS DENIED 3 $213,367 1,529 $274,343 1,657 $315,897 387 $118,596 0 $0 205 $281,483 112 $224,651 APPLICATIONS WITHDRAWN 9 $286,724 1,831 $263,834 1,310 $303,544 164 $181,094 1 $462,820 217 $268,783 53 $245,653 FILES CLOSED FOR INCOMPLETENESS 0 $0 285 $265,757 433 $320,413 26 $155,424 0 $0 25 $270,463 20 $246,020
Aggregated Statistics For Year 2004(Based on 10 partial tracts) A) FHA, FSA/RHS & VA B) Conventional C) Refinancings D) Home Improvement Loans E) Loans on Dwellings For 5+ Families F) Non-occupant Loans on G) Loans On Manufactured Number Average Value Number Average Value Number Average Value Number Average Value Number Average Value Number Average Value Number Average Value
LOANS ORIGINATED 20 $215,432 4,145 $242,059 3,769 $259,582 437 $138,529 1 $2,357,970 591 $239,111 183 $202,645 APPLICATIONS APPROVED, NOT ACCEPTED 4 $211,865 936 $246,204 736 $256,313 108 $124,837 0 $0 87 $241,699 89 $193,893 APPLICATIONS DENIED 3 $214,923 924 $253,661 1,429 $258,678 366 $110,803 0 $0 143 $246,465 102 $194,768 APPLICATIONS WITHDRAWN 12 $196,667 1,208 $249,977 1,299 $259,482 131 $137,773 0 $0 130 $253,937 56 $199,293 FILES CLOSED FOR INCOMPLETENESS 3 $124,337 172 $253,567 246 $282,626 29 $76,411 0 $0 22 $234,124 11 $213,115
Aggregated Statistics For Year 2003(Based on 10 partial tracts) A) FHA, FSA/RHS & VA B) Conventional C) Refinancings D) Home Improvement Loans F) Non-occupant Loans on Number Average Value Number Average Value Number Average Value Number Average Value Number Average Value
LOANS ORIGINATED 170 $226,665 3,839 $196,523 4,201 $194,730 189 $63,804 433 $174,540 APPLICATIONS APPROVED, NOT ACCEPTED 11 $243,150 751 $200,624 710 $196,595 50 $56,021 71 $210,788 APPLICATIONS DENIED 35 $223,636 627 $205,292 1,181 $191,484 180 $48,309 90 $198,920 APPLICATIONS WITHDRAWN 28 $242,015 1,004 $204,458 1,086 $200,163 44 $77,987 58 $179,163 FILES CLOSED FOR INCOMPLETENESS 4 $160,450 142 $211,035 182 $218,132 23 $54,885 13 $167,452
Aggregated Statistics For Year 2002(Based on 2 partial tracts) A) FHA, FSA/RHS & VA B) Conventional C) Refinancings D) Home Improvement Loans F) Non-occupant Loans on Number Average Value Number Average Value Number Average Value Number Average Value Number Average Value
LOANS ORIGINATED 38 $196,318 427 $203,370 595 $212,301 38 $44,412 37 $200,888 APPLICATIONS APPROVED, NOT ACCEPTED 2 $209,900 62 $198,883 104 $206,404 19 $36,837 5 $209,752 APPLICATIONS DENIED 4 $185,362 57 $215,871 144 $194,578 28 $34,961 3 $163,213 APPLICATIONS WITHDRAWN 4 $179,298 84 $222,297 144 $202,545 9 $59,061 4 $162,755 FILES CLOSED FOR INCOMPLETENESS 1 $129,030 26 $227,219 54 $206,033 1 $23,890 1 $146,670
Aggregated Statistics For Year 2001(Based on 2 partial tracts) A) FHA, FSA/RHS & VA B) Conventional C) Refinancings D) Home Improvement Loans E) Loans on Dwellings For 5+ Families F) Non-occupant Loans on Number Average Value Number Average Value Number Average Value Number Average Value Number Average Value Number Average Value
LOANS ORIGINATED 40 $189,140 368 $182,890 378 $187,165 33 $51,108 1 $708,370 24 $169,785 APPLICATIONS APPROVED, NOT ACCEPTED 2 $229,200 56 $189,327 57 $185,225 8 $31,016 0 $0 4 $213,760 APPLICATIONS DENIED 6 $176,325 56 $217,219 142 $180,867 24 $32,287 0 $0 8 $219,504 APPLICATIONS WITHDRAWN 4 $181,228 71 $182,775 83 $158,338 11 $44,212 0 $0 4 $136,012 FILES CLOSED FOR INCOMPLETENESS 0 $0 18 $164,399 24 $209,134 1 $16,540 0 $0 1 $171,300
Aggregated Statistics For Year 2000(Based on 2 partial tracts) A) FHA, FSA/RHS & VA B) Conventional C) Refinancings D) Home Improvement Loans E) Loans on Dwellings For 5+ Families F) Non-occupant Loans on Number Average Value Number Average Value Number Average Value Number Average Value Number Average Value Number Average Value
LOANS ORIGINATED 44 $175,028 199 $173,927 89 $144,017 28 $43,180 0 $0 10 $167,846 APPLICATIONS APPROVED, NOT ACCEPTED 1 $255,110 29 $208,379 20 $122,172 16 $32,671 0 $0 3 $321,403 APPLICATIONS DENIED 6 $176,203 34 $212,019 61 $155,694 24 $38,185 1 $98,150 4 $305,292 APPLICATIONS WITHDRAWN 4 $167,532 29 $196,083 22 $125,452 4 $79,492 1 $1,559,360 2 $195,565 FILES CLOSED FOR INCOMPLETENESS 1 $212,110 11 $187,776 14 $170,225 1 $31,980 0 $0 1 $124,980
Aggregated Statistics For Year 1999(Based on 4 partial tracts) A) FHA, FSA/RHS & VA B) Conventional C) Refinancings D) Home Improvement Loans E) Loans on Dwellings For 5+ Families F) Non-occupant Loans on Number Average Value Number Average Value Number Average Value Number Average Value Number Average Value Number Average Value
LOANS ORIGINATED 203 $136,527 495 $145,879 498 $138,303 89 $32,649 3 $1,162,707 68 $119,014 APPLICATIONS APPROVED, NOT ACCEPTED 12 $147,838 65 $164,800 110 $130,218 45 $33,063 1 $129,720 7 $130,886 APPLICATIONS DENIED 27 $148,897 110 $153,930 276 $117,881 66 $25,570 1 $98,360 16 $118,945 APPLICATIONS WITHDRAWN 28 $136,832 98 $141,495 154 $124,506 8 $39,621 1 $98,980 15 $104,311 FILES CLOSED FOR INCOMPLETENESS 4 $158,775 16 $175,384 56 $128,661 2 $38,015 0 $0 1 $154,270
Private Mortgage Insurance Companies Aggregated Statistics For Year 2009(Based on 10 partial tracts) A) Conventional B) Refinancings C) Non-occupant Loans on Number Average Value Number Average Value Number Average Value
LOANS ORIGINATED 57 $214,474 5 $216,198 5 $201,340 APPLICATIONS APPROVED, NOT ACCEPTED 32 $240,118 3 $300,727 2 $200,640 APPLICATIONS DENIED 16 $216,954 1 $213,430 1 $301,800 APPLICATIONS WITHDRAWN 2 $259,860 0 $0 0 $0 FILES CLOSED FOR INCOMPLETENESS 11 $324,425 5 $318,106 2 $293,870
Aggregated Statistics For Year 2008(Based on 10 partial tracts) A) Conventional B) Refinancings C) Non-occupant Loans on D) Loans On Manufactured Number Average Value Number Average Value Number Average Value Number Average Value
LOANS ORIGINATED 362 $281,747 39 $339,040 23 $260,588 0 $0 APPLICATIONS APPROVED, NOT ACCEPTED 236 $323,026 80 $364,282 24 $275,132 0 $0 APPLICATIONS DENIED 30 $262,147 9 $332,138 8 $219,109 1 $205,460 APPLICATIONS WITHDRAWN 34 $285,921 6 $373,060 3 $241,980 0 $0 FILES CLOSED FOR INCOMPLETENESS 9 $349,964 1 $396,330 1 $279,440 0 $0
Aggregated Statistics For Year 2007(Based on 10 partial tracts) A) Conventional B) Refinancings C) Non-occupant Loans on D) Loans On Manufactured Number Average Value Number Average Value Number Average Value Number Average Value
LOANS ORIGINATED 268 $355,815 105 $381,143 16 $363,872 7 $298,379 APPLICATIONS APPROVED, NOT ACCEPTED 37 $350,447 56 $406,882 6 $382,753 3 $250,693 APPLICATIONS DENIED 16 $358,431 11 $419,920 6 $340,792 0 $0 APPLICATIONS WITHDRAWN 20 $382,982 12 $396,358 2 $346,620 0 $0 FILES CLOSED FOR INCOMPLETENESS 2 $483,955 2 $369,495 2 $313,005 1 $493,670
Aggregated Statistics For Year 2006(Based on 10 partial tracts) A) Conventional B) Refinancings C) Non-occupant Loans on D) Loans On Manufactured Number Average Value Number Average Value Number Average Value Number Average Value
LOANS ORIGINATED 64 $374,713 69 $398,296 6 $390,032 5 $321,386 APPLICATIONS APPROVED, NOT ACCEPTED 40 $385,254 27 $391,963 1 $497,810 2 $213,195 APPLICATIONS DENIED 3 $421,960 7 $434,473 1 $233,470 0 $0 APPLICATIONS WITHDRAWN 9 $373,406 6 $437,667 0 $0 0 $0 FILES CLOSED FOR INCOMPLETENESS 1 $294,490 0 $0 0 $0 0 $0
Aggregated Statistics For Year 2005(Based on 10 partial tracts) A) Conventional B) Refinancings C) Non-occupant Loans on D) Loans On Manufactured Number Average Value Number Average Value Number Average Value Number Average Value
LOANS ORIGINATED 103 $343,981 59 $369,746 19 $298,854 3 $341,847 APPLICATIONS APPROVED, NOT ACCEPTED 24 $346,615 15 $378,252 5 $319,330 1 $319,350 APPLICATIONS DENIED 4 $302,355 3 $425,127 0 $0 0 $0 APPLICATIONS WITHDRAWN 4 $316,908 9 $297,139 2 $262,135 0 $0 FILES CLOSED FOR INCOMPLETENESS 2 $273,710 1 $339,370 1 $385,680 0 $0
Aggregated Statistics For Year 2004(Based on 10 partial tracts) A) Conventional B) Refinancings C) Non-occupant Loans on D) Loans On Manufactured Number Average Value Number Average Value Number Average Value Number Average Value
LOANS ORIGINATED 226 $291,351 88 $288,642 52 $276,358 3 $253,850 APPLICATIONS APPROVED, NOT ACCEPTED 86 $290,220 44 $261,718 14 $238,513 1 $267,370 APPLICATIONS DENIED 4 $309,845 8 $333,416 2 $273,865 0 $0 APPLICATIONS WITHDRAWN 21 $290,925 12 $264,602 4 $308,465 0 $0 FILES CLOSED FOR INCOMPLETENESS 14 $284,086 2 $152,430 0 $0 1 $264,830
Aggregated Statistics For Year 2003(Based on 10 partial tracts) A) Conventional B) Refinancings C) Non-occupant Loans on Number Average Value Number Average Value Number Average Value
LOANS ORIGINATED 375 $253,188 183 $230,332 25 $219,889 APPLICATIONS APPROVED, NOT ACCEPTED 86 $242,300 88 $225,318 8 $226,562 APPLICATIONS DENIED 6 $255,778 6 $273,160 0 $0 APPLICATIONS WITHDRAWN 16 $267,184 13 $232,673 2 $244,160 FILES CLOSED FOR INCOMPLETENESS 0 $0 1 $176,320 0 $0
Aggregated Statistics For Year 2002(Based on 2 partial tracts) A) Conventional B) Refinancings C) Non-occupant Loans on Number Average Value Number Average Value Number Average Value
LOANS ORIGINATED 62 $253,217 31 $226,667 2 $199,790 APPLICATIONS APPROVED, NOT ACCEPTED 11 $231,755 12 $233,365 0 $0 APPLICATIONS DENIED 1 $244,450 1 $243,720 0 $0 APPLICATIONS WITHDRAWN 5 $218,722 3 $198,750 1 $121,310 FILES CLOSED FOR INCOMPLETENESS 1 $136,750 0 $0 0 $0
Aggregated Statistics For Year 2001(Based on 2 partial tracts) A) Conventional B) Refinancings C) Non-occupant Loans on Number Average Value Number Average Value Number Average Value
LOANS ORIGINATED 100 $222,185 46 $195,819 3 $204,630 APPLICATIONS APPROVED, NOT ACCEPTED 21 $211,790 6 $201,628 1 $220,930 APPLICATIONS DENIED 2 $226,075 2 $271,475 1 $272,390 APPLICATIONS WITHDRAWN 3 $242,127 3 $177,550 0 $0 FILES CLOSED FOR INCOMPLETENESS 0 $0 0 $0 0 $0
Aggregated Statistics For Year 2000(Based on 2 partial tracts) A) Conventional B) Refinancings C) Non-occupant Loans on Number Average Value Number Average Value Number Average Value
LOANS ORIGINATED 35 $220,560 5 $163,876 1 $185,640 APPLICATIONS APPROVED, NOT ACCEPTED 7 $210,687 1 $182,700 0 $0 APPLICATIONS DENIED 0 $0 0 $0 0 $0 APPLICATIONS WITHDRAWN 1 $316,870 0 $0 0 $0 FILES CLOSED FOR INCOMPLETENESS 0 $0 0 $0 0 $0
Aggregated Statistics For Year 1999(Based on 4 partial tracts) A) Conventional B) Refinancings C) Non-occupant Loans on Number Average Value Number Average Value Number Average Value
LOANS ORIGINATED 106 $168,869 49 $155,773 8 $114,752 APPLICATIONS APPROVED, NOT ACCEPTED 11 $146,804 12 $149,634 0 $0 APPLICATIONS DENIED 5 $167,948 5 $195,360 1 $121,050 APPLICATIONS WITHDRAWN 3 $160,700 1 $81,790 0 $0 FILES CLOSED FOR INCOMPLETENESS 1 $214,940 1 $303,120 0 $0
2006 - 2018 National Fire Incident Reporting System (NFIRS) incidents See full 2006 National Fire Incident Reporting System statistics for zip code 92596, California
Most common first names in zip code 92596 among deceased individuals Name Count Lived (average)
William 17 75.6 years Robert 17 69.4 years James 12 72.3 years John 9 72.6 years Charles 8 76.4 years Dorothy 8 79.2 years Mary 6 79.2 years Betty 6 65.2 years Donald 6 79.2 years Arthur 6 84.7 years
Most common last names in zip code 92596 among deceased individuals Last name Count Lived (average)
Brown 8 80.3 years Miller 4 77.0 years Lee 4 69.2 years Mitchell 4 65.5 years Guy 3 79.4 years Boyd 3 66.0 years Domenigoni 3 83.3 years Cooper 3 75.7 years Corley 3 73.3 years Lilly 3 85.0 years
Businesses in zip code 92596
Name Count Name Count
CVS 1 FedEx 1 Carl\s Jr. 1 Starbucks 1 Cold Stone Creamery 1
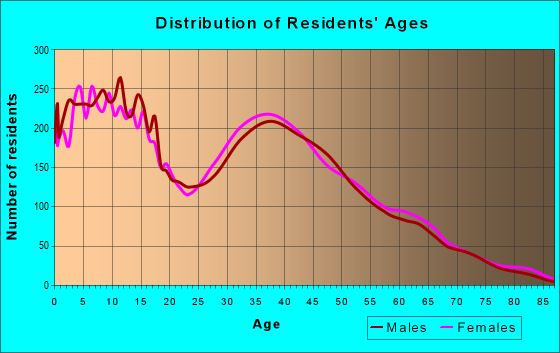
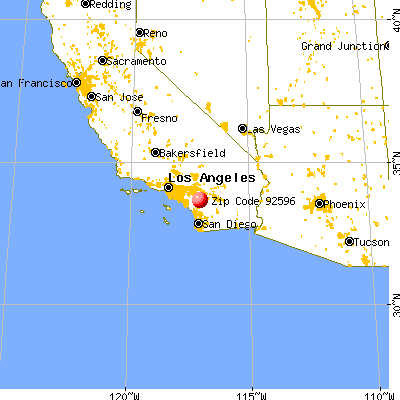


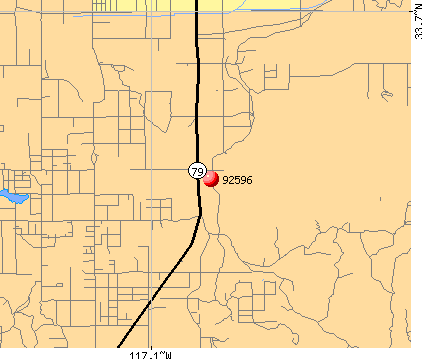 Nearest zip codes: 92545, 92543, 92548, 92584, 92563, 92591.


 . Federal Facility
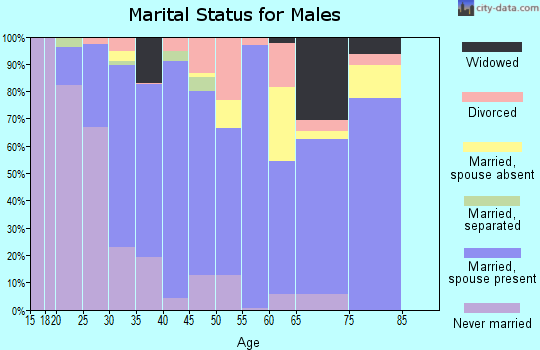


 Based on the data from the years 2006 - 2018 the average number of fires per year is 36. The highest number of fires - 51 took place in 2013, and the least - 17 in 2006. The data has a growing trend.
 When looking into fire subcategories, the most incidents belonged to: Outside Fires (58.8%), and Mobile Property/Vehicle Fires (23.7%).